 TIGER
HOTLINE
TIGER
HOTLINE 
william_schmidt@hotmail.com
 A Guide To Profitably Using The
Tiger Nightly HOTLINE
A Guide To Profitably Using The
Tiger Nightly HOTLINE TIGER
HOTLINE
william_schmidt@hotmail.com
A Guide To Profitably Using The
Tiger Nightly HOTLINE
TigerSoft and
Peerless Daily Hotline
(C)
1985-2012 William Schmidt, Ph.D. www.tigersoft.com
All rights
strictly reserved.
| Earlier Hotlines - See MASTER-LINK which was sent to subscribers. |
|
To Renew the Hotline, order here 350 (check) - 360(Visa/MC) |
Hotline 1/30/2012
12661 -74
Advance= 1112 Declines= 1904
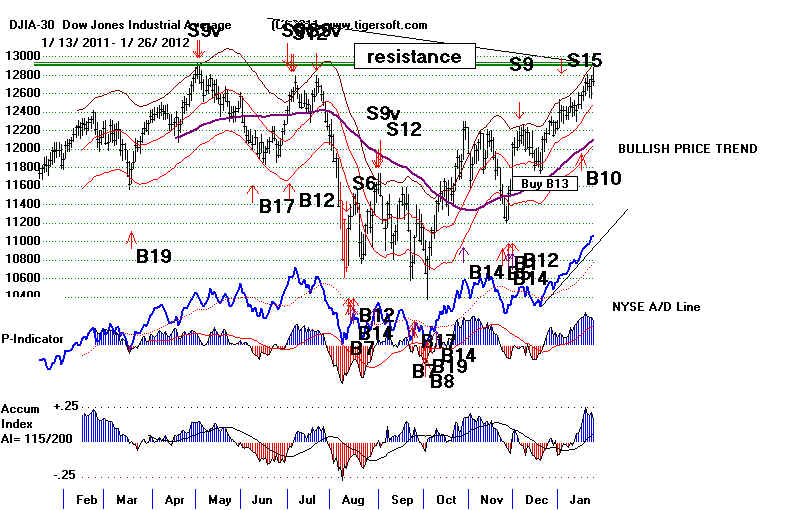
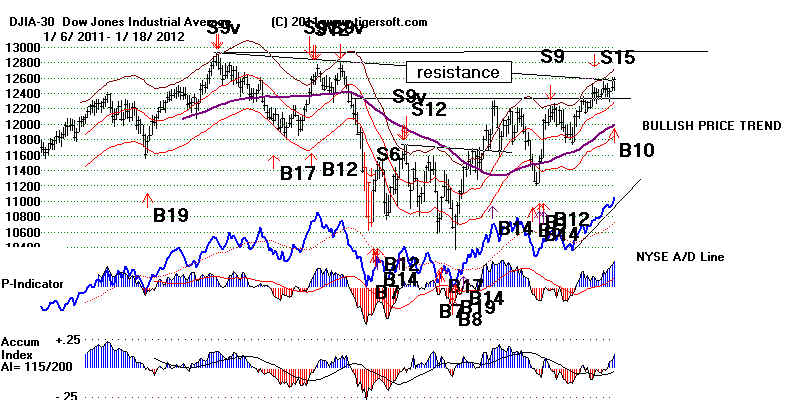
BUY B10 and
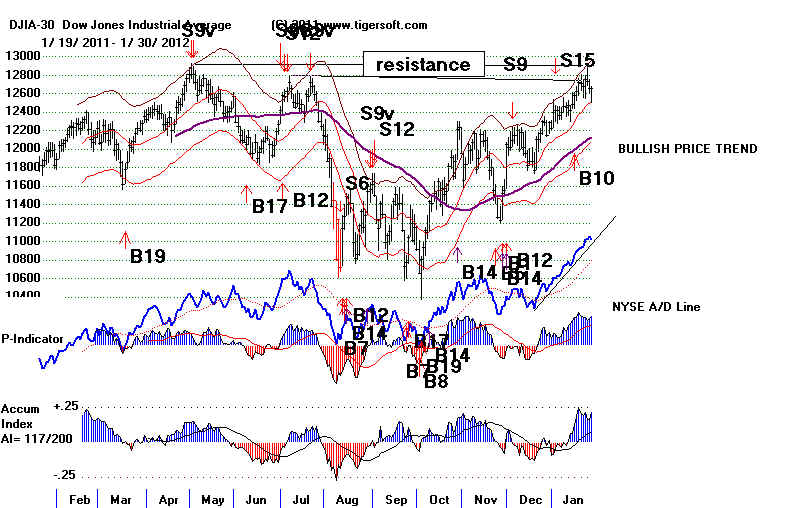
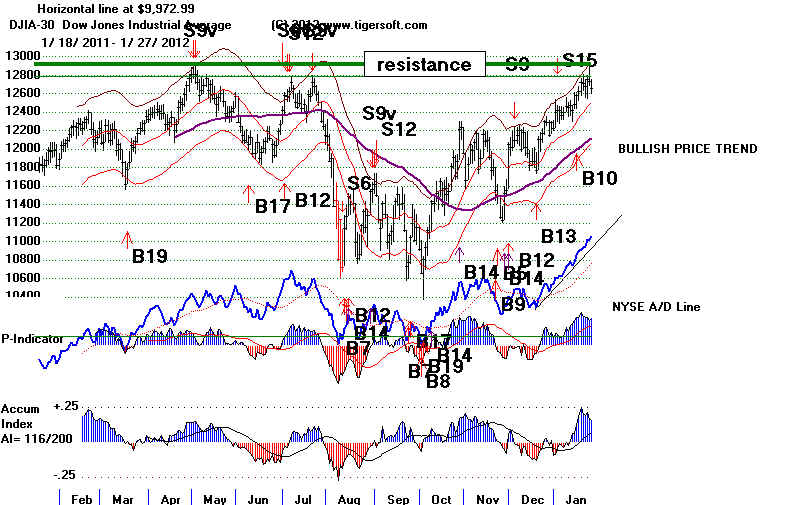
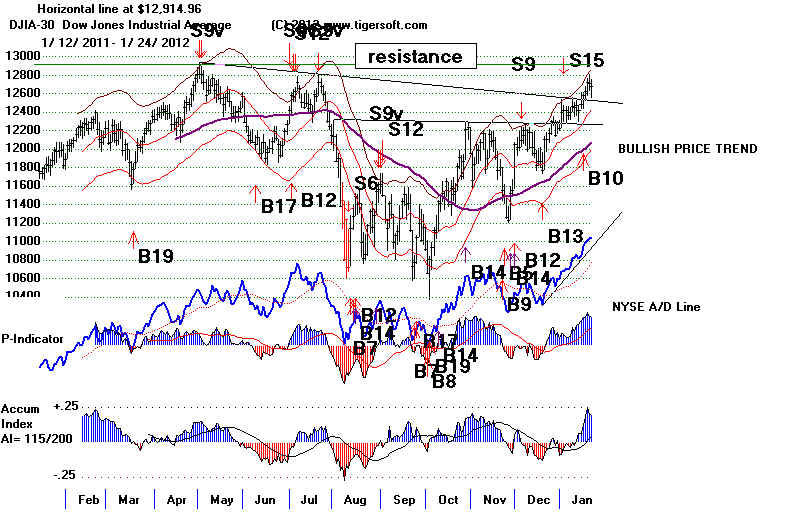
Rising A/D Line Predict Higher Prices. 12900 Remains Our Target.
The DJI found
support at its rising 21-day ma and turned up at the close so that the DJI's loss
was very minor.
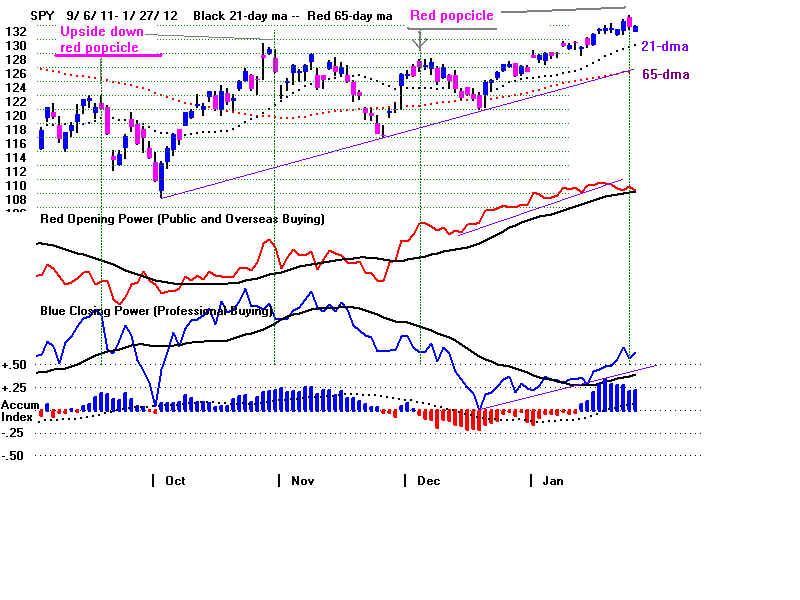
I noticed that NYSE new highs rose for the day. Dividend stocks and
speculative high
performance stocks are in favor. The breaking by the Opening Power
of its rising
21-day ma is a warning that more weakness at the openings could be ahead.
But, as long, as
the Closing Power uptrend in intact, we should expect 12900 or more.
And as long as
the NYSE A/D Line is rising, the intermediate-term trend is clearly up.
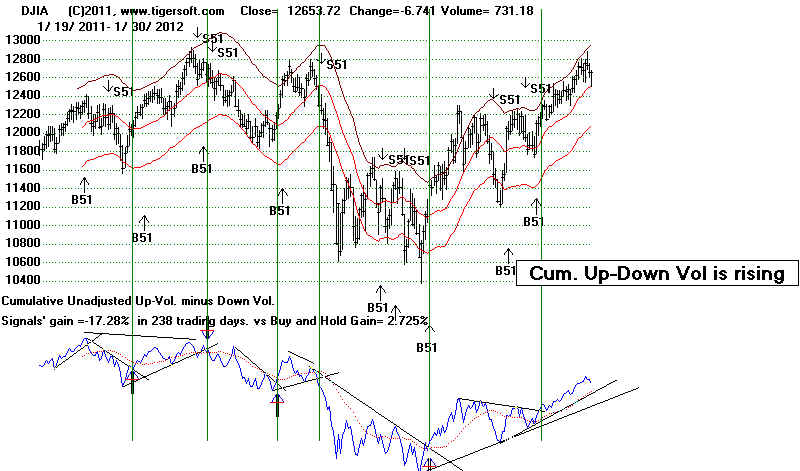
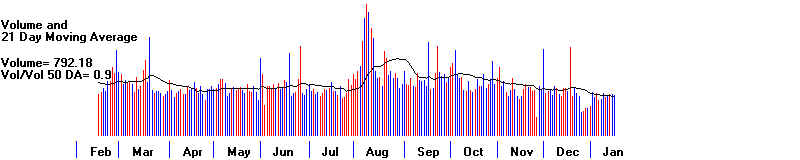
The proportion of
NYSE Up Volume to Down Volume is falling behind the ratio of NYSE
advances to
declines. See the last chart for today below. This has to be of concern, but
as long
as such a NC
(non-confirmation) does not occuur on a tagging of the upper 3.5% band and
the NYSE A/D Line
is uptrending, I think we have to trust the Peerless Buy signal. A break
in the
uptrend of what has been a very strong period of Daily and Weekly Advances-Declines
would likely stop
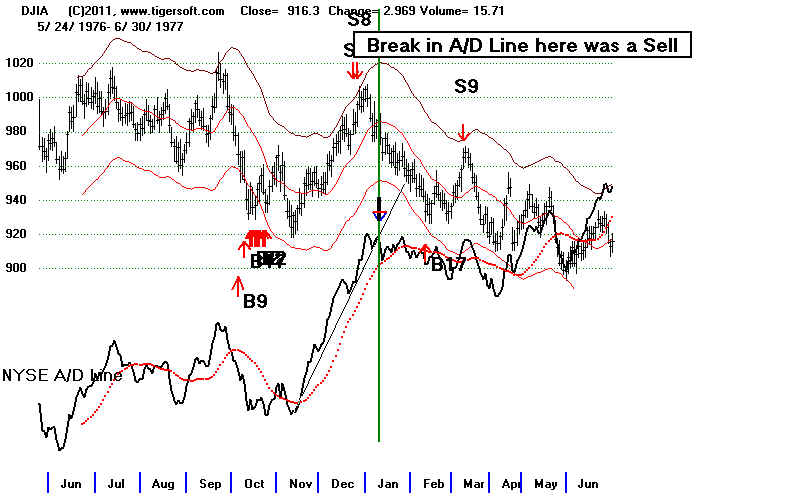
the advances as it did early 1977, 2001 and 2002. For now, let's see if the
DJI can reach the
expected keenest resistance at 12900
DJI remains on a Buy B10
NYSE A/D Line is
uptrending.
1/30/2011 BREADTH STATISTICS:
175 (+32) MAXCP stocks Bullish MAXCP Stocks Bullish.
3 (-1)
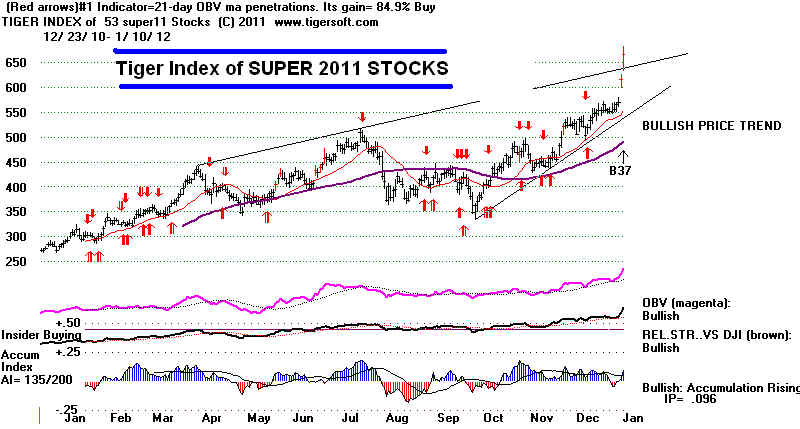
SUPER2011 Stocks making New Highs: Incl REGN 88.88 +3.34
29 (-5) MINCP stocks
Bearish MINCP Stocks
MAXCP stocks are those showing
Tiger Closing Power making new highs.
This suggests heavy Professional Buying. Applying the Tiger Power Ranker's
"bullish" to the MAXCP stocks find those with heavy insider buying and
institutional accumulation. Bearish MINCP stocks show the opposite.
31 (-17) new highs on NASDAQ. 10 (+4) new lows on NASDAQ Bullish.
102 (+1) new
highs NYSE 6 (0) new lows on NYSE Bullish.
1/29/2012 GRAPHS ===> See Key Peerless TigerSoft
Index Charts: Industry Groups and ETFs
DIA SPY
QQQ DJIA-Peerless TigerDJI TigerSPY
TigerQQQ
GLD
SLV
Crude Oil
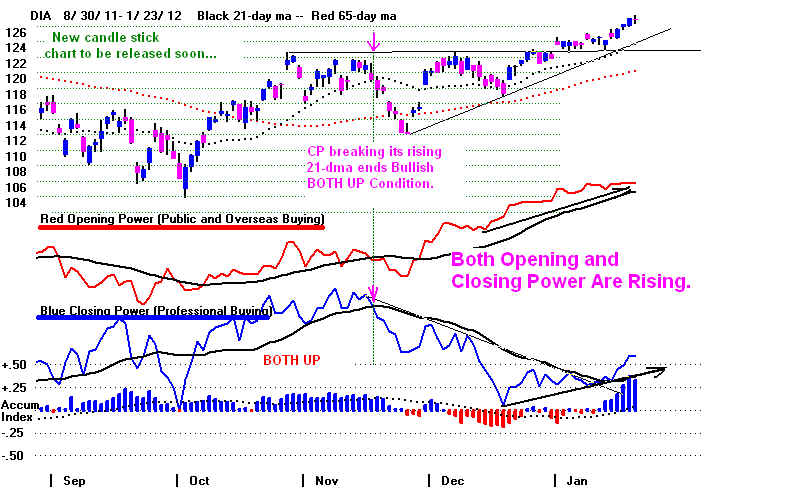
1/29/2012 ===> Closing
Power (CP) Status Report: KEY ETF CHARTS:
Opening Power are rising, as are CLosing Powers. This is
bullish
until one of them violates its 21-day ma.
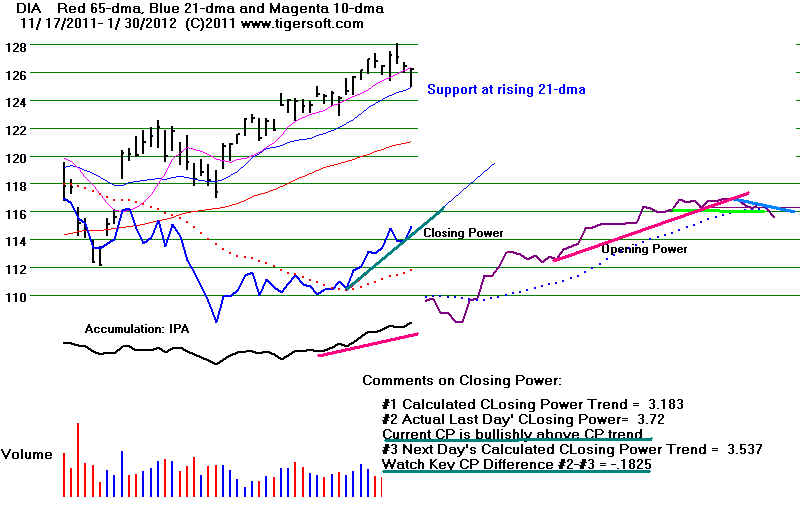
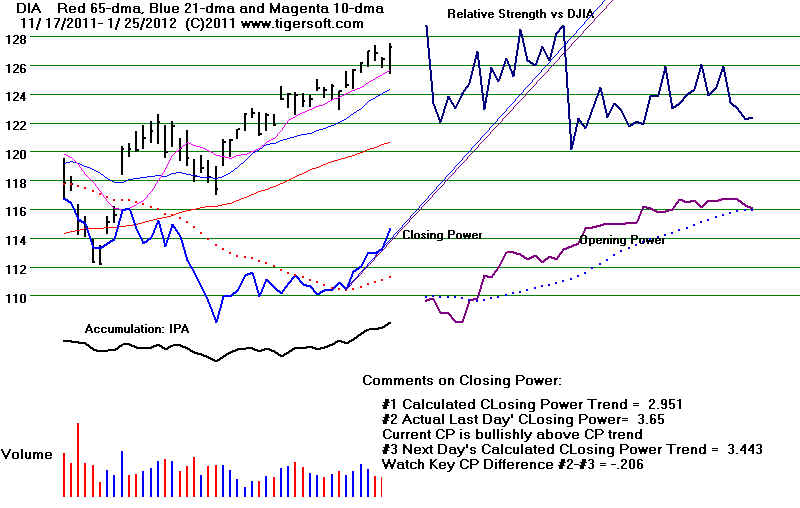
DIA' s
Slower CP is uptrending But steeper CP uptrend was violated.
A close 0.19 BELOW its opening would break the shallow CP uptrend.
Opening Power broke its 21-day ma.
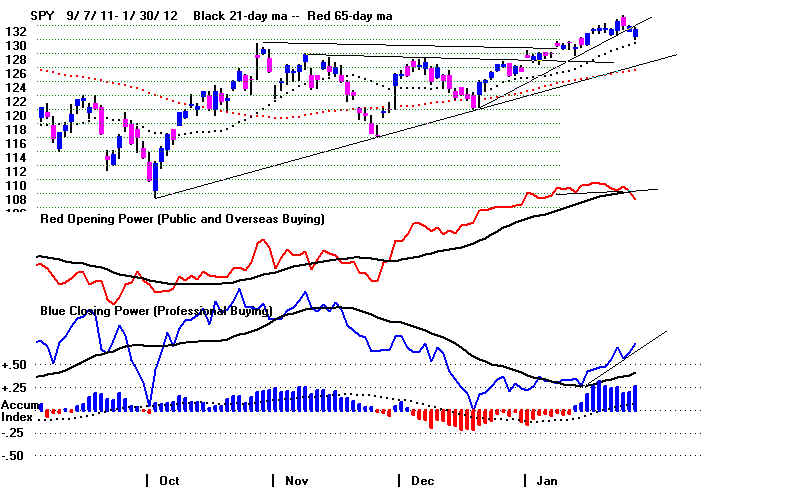
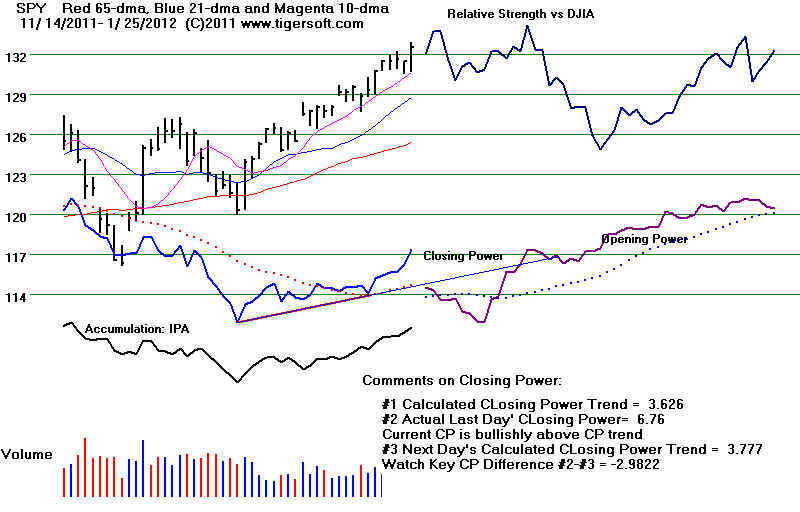
SPY's Shallow CP's
is uptrending.
A close 0.31 BELOW
its opening would break the steep CP uptrend.
Opening Power broke its 21-day ma.
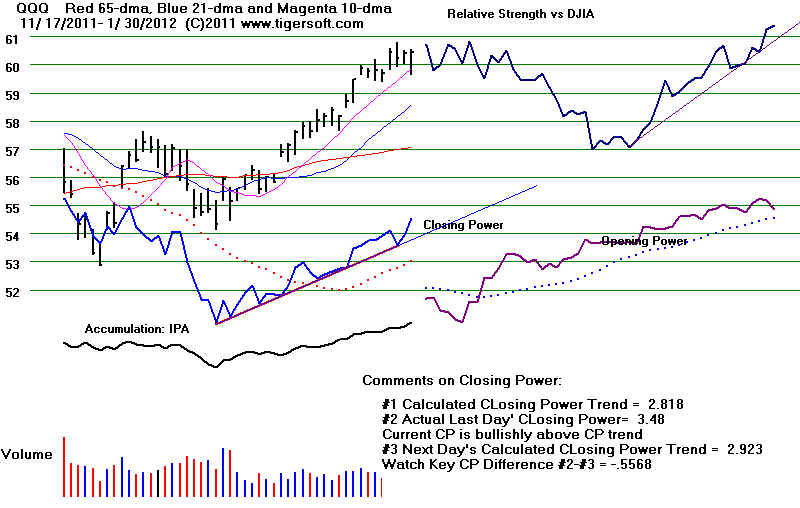
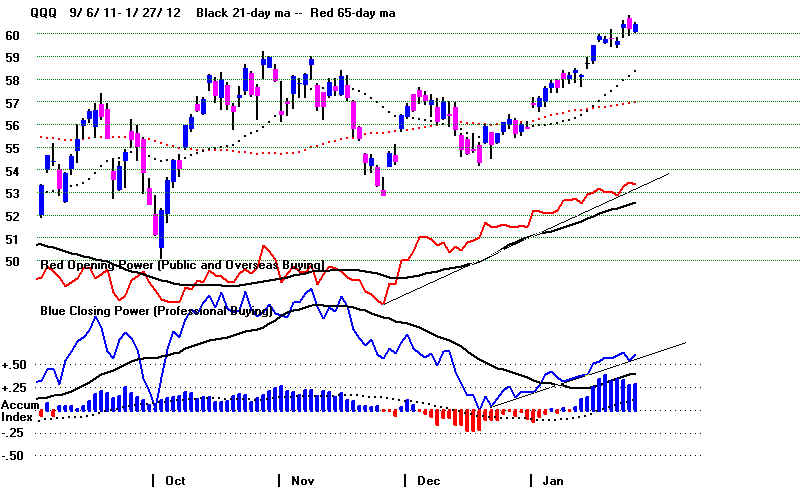
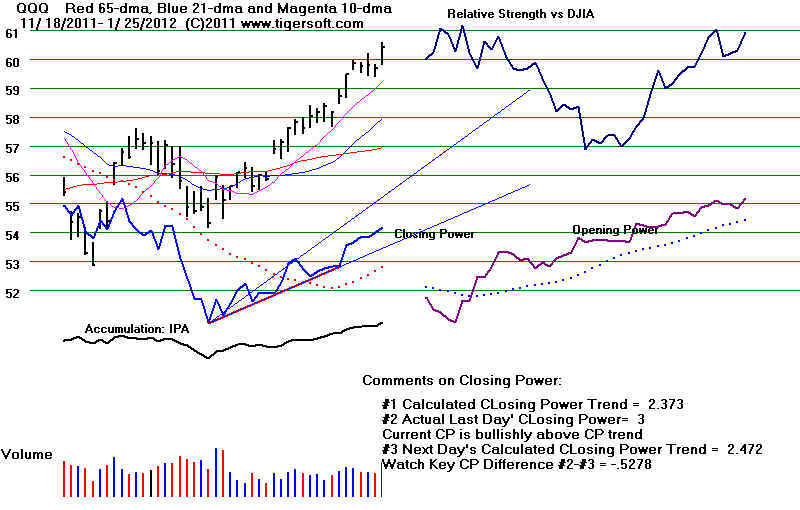
QQQ's Steeper CP is uptrending.
It will take a close of more than 0.56
BELOW the Opening to break the steeper
short-term CP UP-trendline.
Opening Power broke its 21-dma
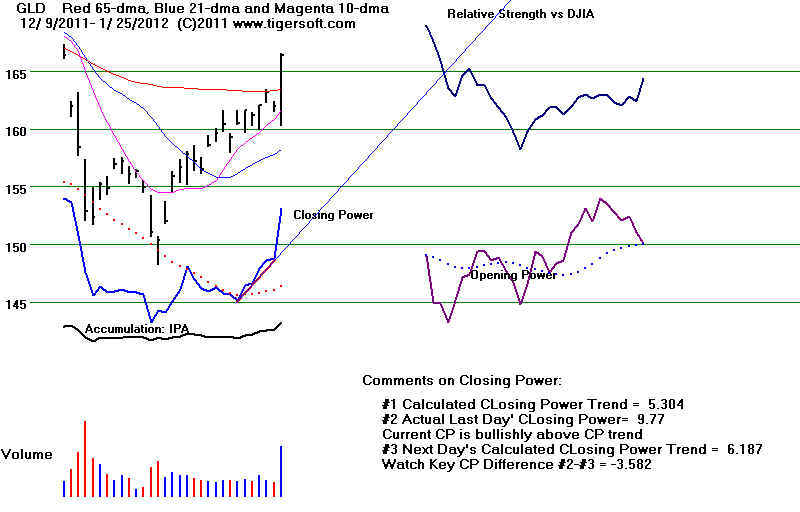
GLD's CP is
uptrending.
It would take a close of .56 BELOW the Opening
to break this CP-UP-trendline.
Its Opening Power is still rising.
WARNING: Up Volume is
Rising but No Longer in Proportion to the Ratio of NYSE Advances to Declines.
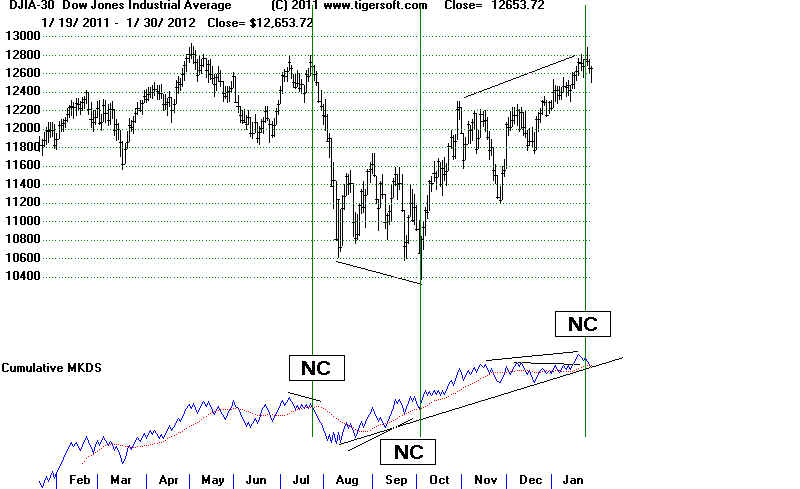
In the second chart below, see how the last DJI new high was not confirmed by the Tiger
Inverted Cumulative
(MKDS) making a new high of its own. "NC" means non-confirmation of a
price new high or low. I will post 1/30/2012 Inverted Traders' Index
NCs at upper and lower bands have good predictive value: 1990-2012
=================================================================
OLDER HOTLINES
===============================================
Hotline 1/27/2012
12661 -74
Advance= 1947 Declines= 1061
HOTLINE ADDRESS WILL BE CHANGED TUESDAY NIGHT
LOOK FOR EMAIL MONDAY.
DJI Weakness vs NASDAQ Strength.
Buy B10 and Seasonality are bullish. Breadth was excellent despite
DJI decline. Resistance up to 12900 has not yet been overcome in DJI.
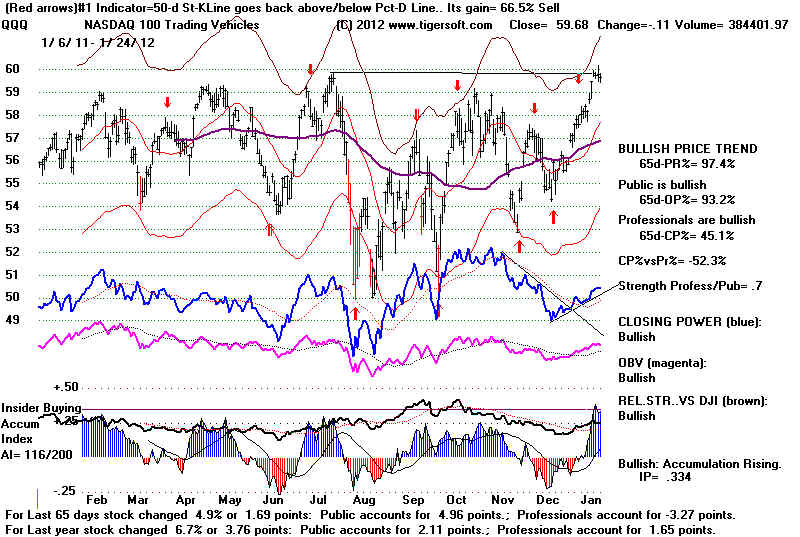
NASDAQ-100 is stronger and has made a new yearly high and shows
both Opening and Closing Power to be rising. This is bullish. The
"red popcicle" Tiger Candlestick charts do suggest a DJI and SPY
retreat. Odds
are that it will be minor. The rising 65-dma ma now at 12100 should be
very good support because there is no Peerless Sell.
All 4 of the earlier B10s in January were profitable.
Current 1/18/2012
DJI = 12579
la/ma
21-dmaROC P-I Change
IP21
V-I Opct.
1.023
.69
P= 553 (+46) .125
+95 .107 (low)
1 1/13/1967 835.13 Gain= +4.0%
la/ma 21-dmaROC
P-I Change IP21
V-I Opct.
1.039 .273
135 21
.07
5 .221
Bottom formation B10 after a Bear Market. DJI rose
immediately. No paper loss.
... Reversed at 968.49 on 3/16/67 by S12
2
1/7/1976 898.69 Gain = +12.3%
la/ma 21-dmaROC
P-I Change IP21 V-I
Opct.
1.054 1.124
286 35 .20
2 .536
DJI rose immediately .. Reversed at 1009.21 on 3/24/76 by S9 No
paper loss.
3
1/12/1989
2222.32 Gain = +24.7%
la/ma
21-dmaROC P-I Change IP21 V-I Opct.
1.023 .454
118 21 .078
11 .185
DJI rose immediately ... No paper loss...Reversed at
2771.09 on 10/4/89 by S9
4 1/31/1991 2736.39 +22.6%
la/ma
21-dmaROC P-I Change IP21 V-I Opct.
1.058 .58
143 33 .116 12 .218
DJI rose immediately ... Reversed at 3353.76 on 4/15/92 by S9
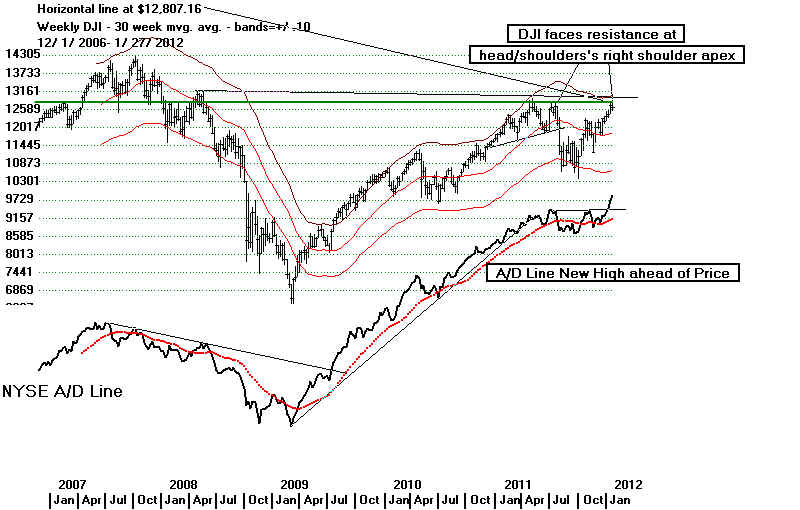
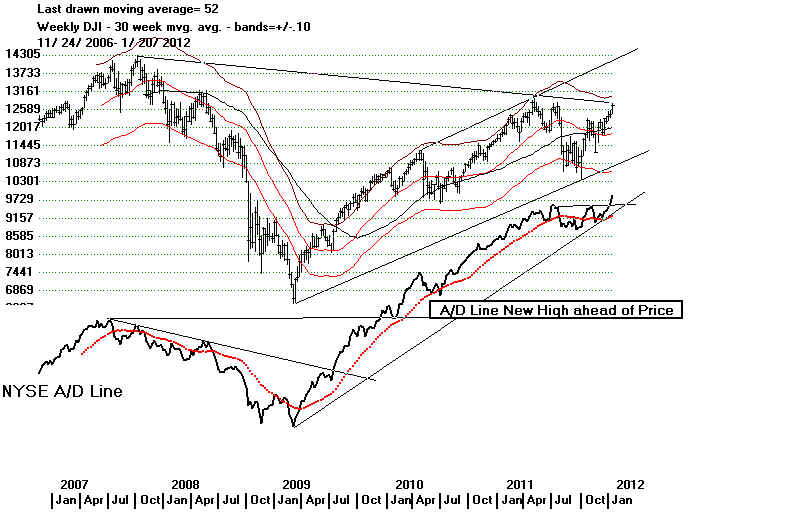
The Weekly DJI and NYSE A/D Line
chart shows how much stronger the A/D Line is
than the DJI. This is usually bullish. The
exceptions are 1977, 2001 and 2001. Breaks in
the NYSE A/D Line uptrend would be the best warning other
than a new Peerless Sell
that a big decline is developing.
Looking
at the 5-year weekly charts of the DIA, QQQ and SPY show
what I take to be
the most important resistance lines:
Weekly
DIA - Resistance from apex of right shoulder - 127.15
Weekly QQQ - Resistance from rising resistance
line - 60.71
Weekly SPY - Falling resistance line - 131.82
The review of 650
weekly charts for the biggest stocks shows none with
bearish head and shoulders patterns that I can identify. A number of these
stocks
could make significant upside breakouts. This will show the general market's
rally has
started again in earnest.
IMPENDING
BREAKOUTS
CELG - 76 and 78 are resistance
CLB - 110 resistance
CVX - 111 resistance
EBAY - 34.2 resistance
HRL - 30.57 resistance
IBM - 193 ressitance
QCOM - 60 resistance
SNPS - 29.5 resistance
ULTA - 80 resistance
VAR - 71 resistance
XOM - 88.5 resistance
1/27/2012 DJI = 12661 -74 la/ma=1.013 21-dma ROC=.352
P= 544 (-39) IP21= .158 V= +48 OP= .071
1/27/2011
BREADTH STATISTICS:
142 (-37) MAXCP stocks Bullish MAXCP Stocks Bullish.
4 (-2) SUPER2011
Stocks making New Highs
34 (+19)
MINCP stocks Bearish MINCP Stocks
MAXCP stocks are those showing
Tiger Closing Power making new highs.
This suggests heavy Professional Buying. Applying the Tiger Power Ranker's
"bullish" to the MAXCP stocks find those with heavy insider buying and
institutional accumulation. Bearish MINCP stocks show the opposite.
48 (+8) new highs on NASDAQ. 6 (+2) new lows on NASDAQ Bullish.
101 (-28) new
highs NYSE 6 (+2) new lows on NYSE Bullish.
1/27/2012
GRAPHS ===>
See Key Peerless TigerSoft Index Charts: Industry Groups and ETFs
DIA SPY
QQQ DJIA-Peerless TigerDJI TigerSPY
TigerQQQ
GLD
SLV Crude
Oil
1/27/2012 ===> Closing
Power (CP) Status Report: KEY ETF CHARTS:
Opening Power are rising, as are CLosing Powers. This is
bullish
until one of them violates its 21-day ma.
DIA' s
Slower CP is uptrending But steeper CP uptrend was violated.
A close 1.80 BELOW its opening would break the shallow CP uptrend.
Opening Power is at its 21-day ma.
SPY's Shallow CP's
is uptrending.
A close 2.09 BELOW its opening would break the shallow CP uptrend.
Opening Power is at its 21-day ma.
QQQ's Steeper CP is uptrending.
It will take a close of more than 0.20
BELOW the Opening to break the
steeper short-term CP UP-trendline.
Its Opening Power is rising.
GLD's CP is
uptrending.
It would take a close of 2.56 BELOW the Opening to break this CP-UP-trendline.
Its Opening Power is rising.
QQQ's Opening and CLosing Power are Both Rising.
====================================================================================
OLDER HOTLINES
====================================================================================
1/26/2012 DJI = 12735 -22
Important: CHANGE
Our hotline's location will change this Tuesday.
Look for an email from us Monday giving the new location.
I will also send you links to the Peerless historical research
and past Hotlines. This is needed to protect our research.
------------------------------------------------------------------------------------------------------------------------------------------------------
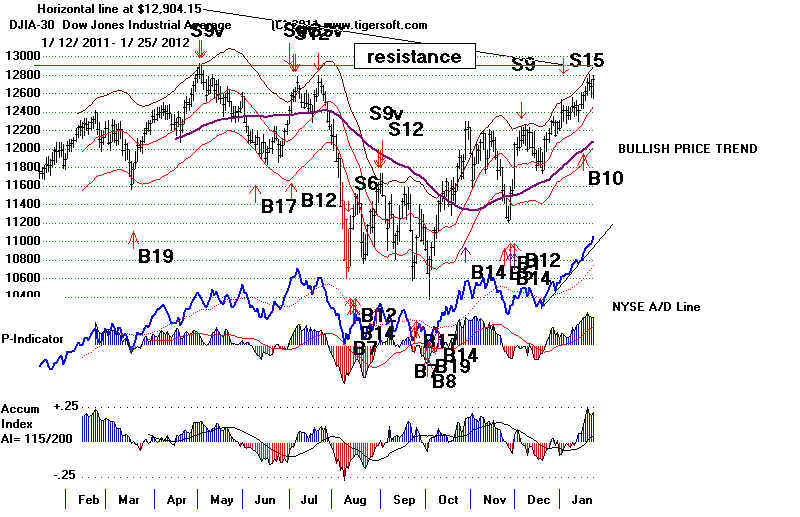
Buy B10, Rising Opening and Closing Powers
plus Low Interest Rates
Rising A/D Line Are Bringing DJI CLoser to 12900
Yearly Intra-Day
High Resistance. But now Tiger "Red
Popcicle" Candlesticks Patterns
Suggest A Shallow Retreat Soon. Just Hold Long
Posiitons for now.
"Both-Up" Tiger Condition favors higher
prices: both Opening
and Closing Power are above
their rising 21-day ma.
As long as the NYSE A/D Line
is rising, stick with your long positions.
Interest
rates are falling again short-term. The Dollar's
weakness the last few days
seems controlled, and as such
invites hedging with stocks. (It should
be clear from last August's
sell-off that a collapsing Euro is not in the
interest of US investors or
US banks.)
January B10s have
averaged gains of 15% since 1928.
The DJI is nearing
resistance. Profit-taking is natural. The
steep Closing Power uptrends
of the SPY and QQQ were broken
today. I expect a DJI
close near 12900 before much of a decline
occurs. End of the
month buying will help the DJI reach 12900.
Since 1965, the DJI has risen
69% of the time over the next 3 trading
days and 60% over the next
two weeks. Seasonal weakness does
set in for two weeks around
the middle of February.
The DJI often makes a nominal
12-month closing high or low at important reversal points.
Look back at some of the
older DJI charts to see this.
On April 29th, 2011 the DJI
closed at 12810.54. A close above that would
seem likely at a minimum if
that pattern continues. After that, if the rally
continues, resistance will be
keenest at the peak of May 2, 2009 at 13058.
Our Tiger candlestick charts
do show "red popcicles" for the QQQ and SPY.
This is a warning, despite
the Peerless Buy signal. See last night's hotline.
With seasonality and breadth
strong, this may only mean a shallow decline to
the rising 21-day ma.
DJA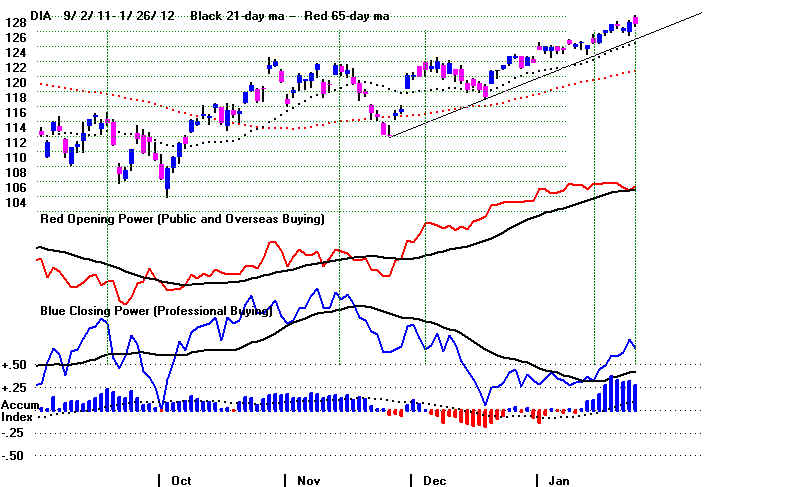 |
SPY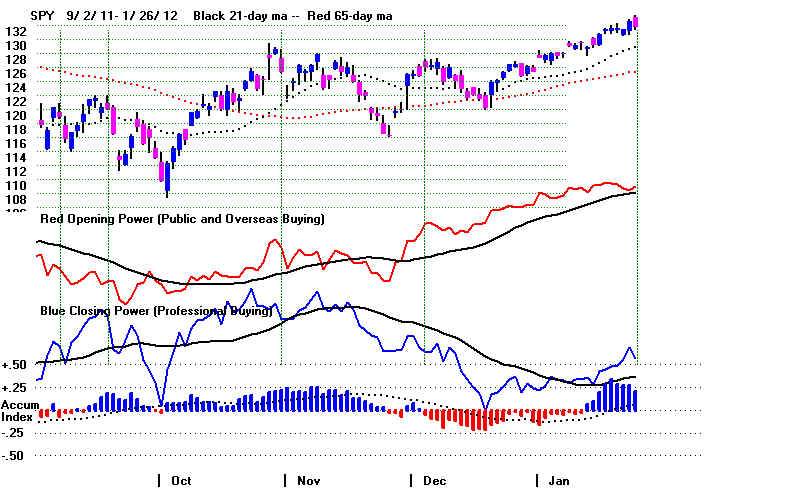 |
QQQ 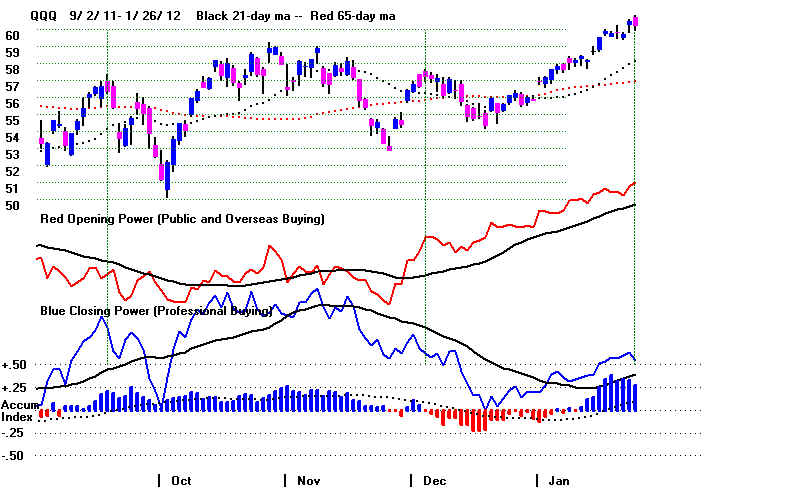 |
ETF Notes - 1/26/2012
Looking regularly through the ETFS in Tiger's SECTOR data base is a
good exercise.
Some of the data needs
correcting this weekend, for one thing. I also see biotechs
and pharmaceuticals are due
for a retreat and some profit-taking while oil and gas
could get slip. That
would be in keeping with some hesitation in prices here, perhaps
as more speculative stocks
get new attention. Low priced atocks are also at
resistance.
So, the speculation will
probably be in the super-2011 (strongest performing) stocks.
>BBH (Biotechs) and IBB (Nasdaq Biotech) Bearish reversal day
after a 6 week move from 103 to 128
>BGU (3x large caps) have
rallied up to point of breakdown (resistance) from late July 2011.
>DUG (Ultra Oil Short) has
just given a red Buy. 5-day Stochastic.
This trading signal
has gained 199% for the last
year. Its CP has just broken its downtrend-line.
>GAZ (Natural Gas) failed to rally past its falling 21-day ma again. The warm winter
has created a surplus of
natural gas.
>GLD is back above its 65-dma, after turning up from its rising 52-week ma.
>PPH (Pharmaceuticals) are
showing steady Red distribution for the last two months and
weakening Relative Strength.
PEERLESS and DJIA
1/26/2012 DJI = 12735 -22
la/ma=1.021 21-dma ROC=.421 P= 503 (-59) IP21= .164
V= +45 OP= .101
1/25/2011 BREADTH STATISTICS:
179 (+54) MAXCP stocks Bullish MAXCP Stocks Bullish.
6 (+6) SUPER2011 Stocks making New
Highs
15 (-14)
MINCP stocks Bearish
MINCP Stocks - none listed tonight.
MAXCP stocks are those showing
Tiger Closing Power making new highs.
This suggests heavy Professional Buying. Applying the Tiger Power Ranker's
"bullish" to the MAXCP stocks find those with heavy insider buying and
institutional accumulation. Bearish MINCP stocks show the opposite.
40 (-27) new highs on NASDAQ. 4 (-3) new lows on NASDAQ Bullish.
129 (+38) new
highs NYSE 4 (+2) new lows on NYSE Bullish.
1/26/2012 GRAPHS ===> See Key Peerless TigerSoft
Index Charts: Industry Groups and ETFs
DIA SPY QQQ DJIA-Peerless TigerDJI TigerSPY
TigerQQQ
GLD SLV
Crude Oil
1/26/2012 ===> Closing
Power (CP) Status Report: KEY ETF CHARTS:
Opening Power are rising, as are CLosing Powers. This is
bullish
until one of them violates its 21-day ma.
DIA' s
Slower CP is uptrending But
steeper CP uptrend was violated.
A close 1.11 ABOVE its opening would restore the CP uptrend.
SPY's Steeper CP's is
uptrending. But steeper CP uptrend was violated.
A close 1.29 ABOVE its opening would restore the CP uptrend.
QQQ's CP is uptrending.
It will take a close of more than 0.3 BELOW the Opening to break the steeper short-term CP UP-trendline.
GLD's CP broke its
down-trendline and is considered uptrending.
It would take a close of 1.93 BELOW the Opening
to break this CP-UP-trendline.
=====================================================================================
OLDER HOTLINES
=====================================================================================
1/25/2012
Buy B10, ETF's Rising CLosing
Powers and Low Interest Rates
Bring DJI CLoser to 12900 Yearly Intra-Day High Resistance.
"Both-Up" Tiger Condition
favors higher prices: both Opening
and Closing Power are above their rising 21-day ma.
Also:
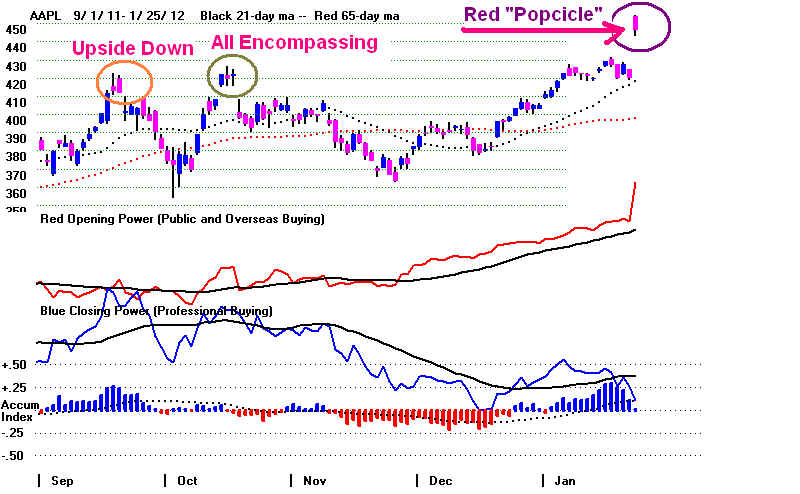
AAPL's Huge Profitability invites
competition and questions
about use of Chinese "slave labor" instead of American workers.
Bearish TigerSoft Candle Sticks
and AAPL: 1990-2012
"Red Popcicle"
"Upside-down Red Popcicle"


PEERLESS and DJIA
1/25/2012 DJI = 12757
+81 la/ma=1.024 21-dma ROC=.563 P= 561 (+1) IP21= .219
V= +70 OP= .191
1/25/2011 BREADTH STATISTICS:
179 (+54) MAXCP stocks Bullish MAXCP Stocks Bullish.
6 (+6) SUPER2011 Stocks making New
Highs
15 (-14)
MINCP stocks Bearish MINCP Stocks
MAXCP stocks are those showing
Tiger Closing Power making new highs.
This suggests heavy Professional Buying. Applying the Tiger Power Ranker's
"bullish" to the MAXCP stocks find those with heavy insider buying and
institutional accumulation. Bearish MINCP stocks show the opposite.
67 (+34) new highs on NASDAQ. 7 (+1) new lows on NASDAQ Bullish.
91 (+2) new
highs NYSE 2 (-2) new lows on NYSE Bullish.
1/25/2012 GRAPHS ===> See Key Peerless TigerSoft
Index Charts: Industry Groups and ETFs
DIA SPY QQQ DJIA-Peerless TigerDJI TigerSPY
TigerQQQ GLD SLV Crude Oil
DIA' s CP is
uptrending
A close 0.21 BELOW its opening would bearishly break the steeper CP uptrend
Opening Power is rising.
SPY's CP's is uptrending.
It would take a Close 2.99 BELOW the Opening to break the uptrend
Opening Power is rising.
QQQ's CP is uptrending.
It will take a close of more than 0.53 BELOW the Opening to break the short-term CP UP-trendline.
Opening Power is rising.
GLD's CP broke its down-trendline
and is considered uptrending.
It would take a close of 3.59
BELOW the Opening to break this
CP-UP-trendline.
Opening Power is rising.

APPLE's Stunning Profits Send It and NASDAQ Up Sharply
Todays AAPL rally could be construed to be as a
classic "buying climax"
which
could potentially end a long and steep
uptrend. TigerSoft candle stick charts show this.
The rightside-up "red popsicle" it formed today with a monster gap certainly
represents a lot short covering and public
buying. Red popcicles have been reliably
bearish in the past with AAPL. See the
sampling I did quickly tonight. Admittedly,
the sample is biased, in that it took only the
last 100 trading days of each year
since 1990. Look at these charts and draw your
own conclusions. Mine - and I
have not studied Japanese candle sticks' theory
very much - is that "red popcicles
are reliably
bearish, as are "upside
down red popcicles" and "encompassing red" candle-sticks, too.
See http://tigersoft.com/1211-HH/AAPL-CAN/index.htm
I did a similar sampling of SPY a while back
and reached similar conclusions about
red popcicles, upside-down and right-side up.
2/23/2011 SPY Candle Stock
Charts: 1993-2011
WIll this be an exception. Could all this
public buying be correctly bullish now?
The world-wide market for these AAPL smart
phones is astronomical, in theory.
Since 2009, APPL has been rising more at the
openings than at the closes.
As long as APPL's OPENING POWER trends this
steeply up, calling a top in APPL
seems crazy. And seeing a stock like this
creates speculative confidence and
draws in the long absent public to the broader
market. It would seem a bear market
is unlikely with AAPL running like this, unless
it sucks out too much speculative capital
from stocks elsewhere.
Too Much Success?
There is a Hegelian dialectic
here. Success like AAPL has always breeds carping from the
envious. But also some real future
problems and a bearish potential. Such
problems may be over-looked by the buying crowd
in all the excitement. APPL's
profitability was huge, something like 28.1% of
revenues. A breakthrough technology
with such profitability will surely attract
compeitors. How can AAPL protect itself
from copying by pirates around the world?
And critics will assail APPL, or try to
it, for hiring so many "slave
workers" in China instead of paying decent wages
in the US. Go to Yahoo's message board and read the
comments there.
http://www.bloomberg.com/news/2012-01-24/apple-posts-record-quarterly-profit-sales.html
http://www.nytimes.com/2012/01/26/business/ieconomy-apples-ipad-and-the-human-costs-for-workers-in-china.html?_r=2&pagewanted=2&hp
Apple
Passes Exxon As Most Valuable U.S. Company
| Quotes from
AAPL's Message Board on Yahoo "Slave Labor Conditions... http://market-ticker.org/akcs-www?post=2..." "
|
=====================================================================================
OLDER HOTLINES
=====================================================================================
1/24/2012 DJI = 12676 -33 la/ma=1.02 21-dma ROC=.545 P= 559 (-22) IP21= .196 V= +69 OP= .176
1/24/2011 BREADTH STATISTICS:
124 (+35) MAXCP stocks Bullish MAXCP Stocks Bullish.
0 SUPER2011 Stocks making New
Highs
29 (-9)
MINCP stocks Bearish MINCP Stocks
MAXCP stocks are those showing
Tiger Closing Power making new highs.
This suggests heavy Professional Buying. Applying the Tiger Power Ranker's
"bullish" to the MAXCP stocks find those with heavy insider buying and
institutional accumulation. Bearish MINCP stocks show the opposite.
33 (+3) new highs on NASDAQ. 6 (-1) new lows on NASDAQ Bullish.
39 (-17) new
highs NYSE 4 (-2) new lows on NYSE Bullish.
1/24/2012 GRAPHS ===> See Key Peerless TigerSoft
Index Charts: Industry Groups and ETFs
DIA SPY QQQ DJIA-Peerless TigerDJI TigerSPY
TigerQQQ GLD SLV Crude Oil
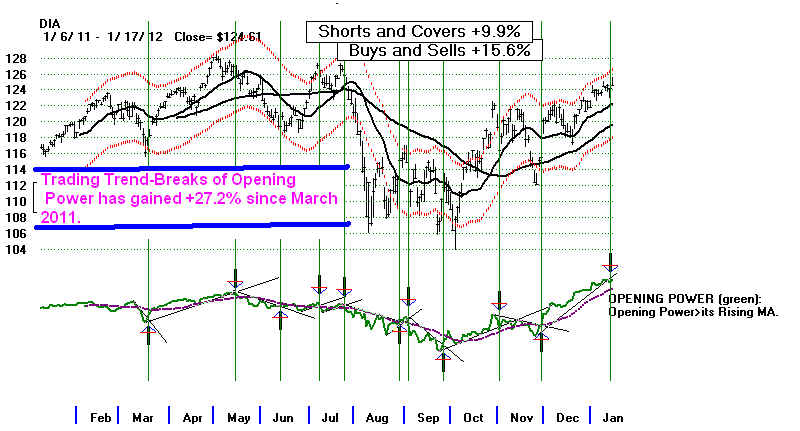
Reversing Buy B10 and The FED
Should Send
DJI up closer to 12900.
The Closing Powers Are Stil Rising
But Opening
Powers are breaking their uptrends.
Trading the Opening
trend-breaks is profitable. But I reckon it is
more than twice as profitable to trade with the Peerless signals.
I would be concerned, however, if the NYSE A/D Line broke the
uptrendline shown below. That would remind us of early 1977
and mid 2001 where unusally powerful A/D Line uptrends
were broken after moves which took it up much faster than the
DJI.
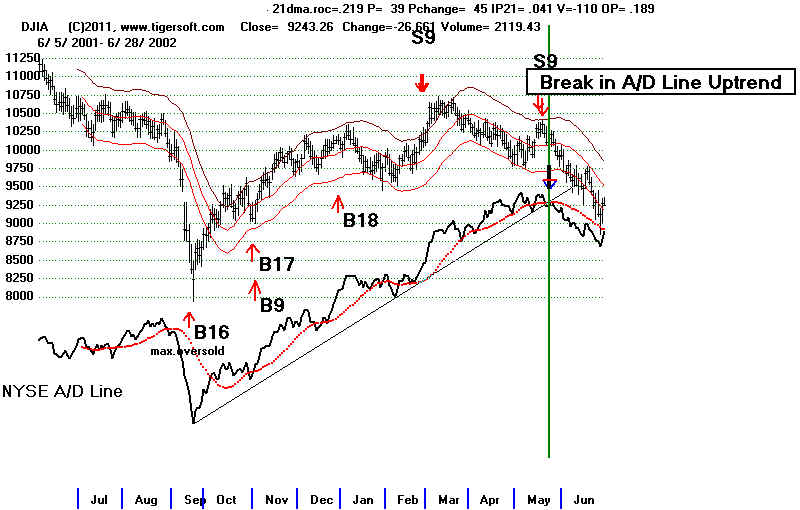
See below how the 1976-1977 and 2000-2001 A/D Line uptrend
breaks did bring serious declines. In both these cases,
it should be noted, Peerless gave timely automatic Sells.
Unless one dismisses the Buy B10, Peerless has given no Sell
here.
January B10s are very reliable.
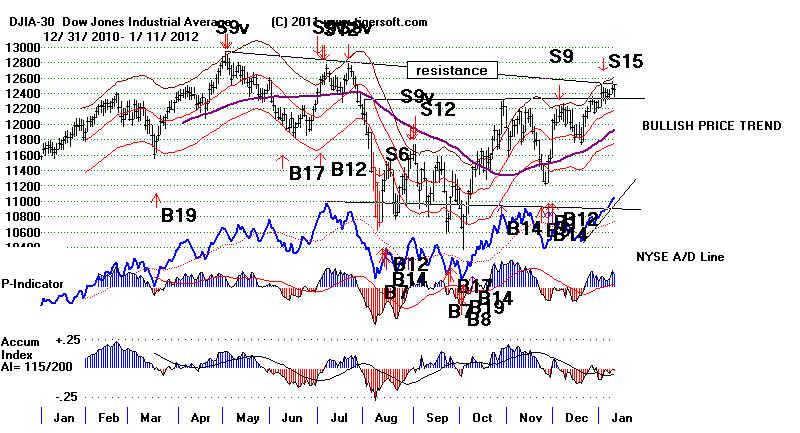
DJIA 2011-2012 - 12900 Being Challenged.
DJIA 1977-1978 Steep A/D Line Uptrend
Break was Bearish.
DJIA 2001-2002 Steep
A/D Line Uptrend Break was Bearish.
Watch QQQ
The QQQ has now reached its July peak. Watch to see if it
can breakout. Even if not
the NYSE A/D Line's strength should bolster the market.
LOW PRICED SPECULATION: US BASED GOLD STOCK
SFEG - Santa Fe Gold
http://www.santafegoldcorp.com
53 employees
http://finance.yahoo.com/q/pr?s=SFEG.OB+Profile
300,000 shares
purchase din last 6 months. None sold.
Insiders own 40%.
Institutional holders own 1%
SFEG is a very highly accumulated low priced stock which
shows lots of Professional
buying. It is thin. So buy it carefully.
Its story is that it now has significant amounts
of gold going to a refinery and has ample financing, along
with steady insider buying.
Not many stocks show such high levels of Accumulation.
The last one that looked like
this was QPSA. It went from $2 to $15. Compare
the chart of SFEG now with QPSA
back in 2010. TigerSoft's Blog SFEG Charts:
2001 to 1-15-2012
That SFEG is way below the radar screen of the big boys is
very good. And as
a gold stock based entirely in the US, it should be a lot
safer than companies that must
deal with populist discontent, threats of nationalization
and the necessity of bribing
politicians. Its production costs are half what NEM's
are per ounce of gold. So, it may
be attractive as a take-over bid after a suitable rally,
say, to $5 or $10.
SFEG is the best looking low priced stock since QPSA at
$2.00 on its way to $15.
Compare it with ANV below, too. ANV shows how fast
and far a US gold stock
can rise.
| 2011-2012 SFEG multiplied
by 100 for better scaling. The next edition of TigerSoft will multiply low priced stocks by 100. 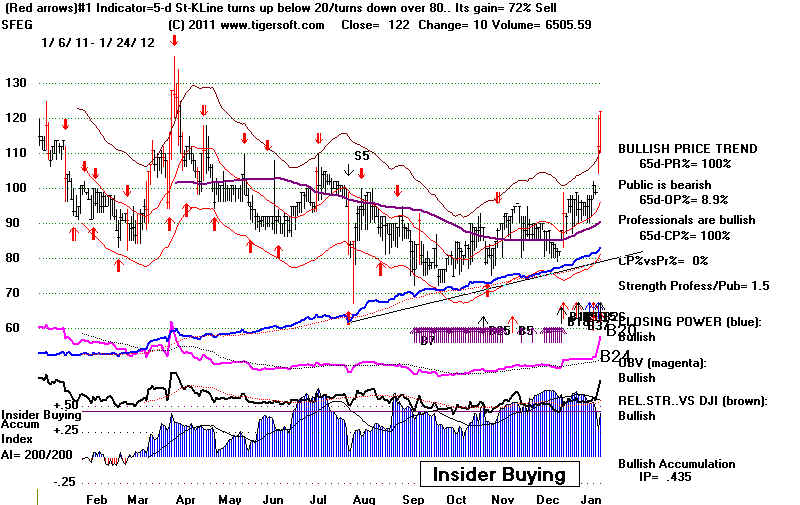 |
2010 QPSA on its
way to $15.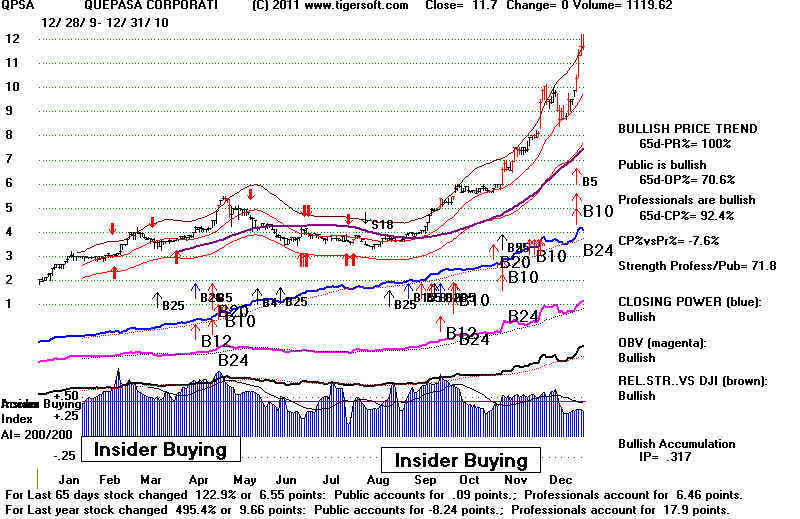 |
2019 ANV on its way
to $46 in 2011.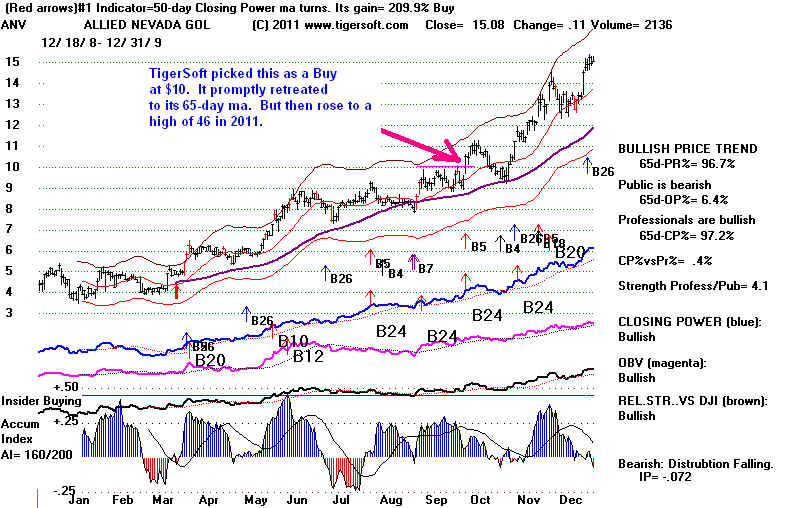 |
=====================================================================================
OLDER HOTLINES
=====================================================================================
1/23/2012 DJI = 12709 -12 la/ma=1.025 21-dma
ROC=.582 P= 580 (-89) IP21= .202 V= +82 OP= .288
1/23/2011 BREADTH STATISTICS:
89 (-5) MAXCP stocks Bullish MAXCP Stocks Bullish.
0 SUPER2011 Stocks making New
Highs
38 (-23)
MINCP stocks Bearish MINCP Stocks
MAXCP stocks are those showing
Tiger Closing Power making new highs.
This suggests heavy Professional Buying. Applying the Tiger Power Ranker's
"bullish" to the MAXCP stocks find those with heavy insider buying and
institutional accumulation. Bearish MINCP stocks show the opposite.
30 (-11) new highs on NASDAQ. 7 (+5) new lows on NASDAQ Bullish.
56 (-36) new
highs NYSE 6 (-7) new lows on NYSE Bullish.
1/20/2012 GRAPHS ===> See Key Peerless TigerSoft
Index Charts: Industry Groups and ETFs
DIA SPY QQQ DJIA-Peerless TigerDJI TigerSPY
TigerQQQ GLD SLV Crude Oil
Reversing Buy B10 and The FED
Should Send DJI up closer to
12900.
The Closing Powers Are Stil Rising
So are the ETFs' Opening Power. This is the most bullish of
configurations.
Until the Closing Power breaks its uptrend, there can be no real short-term decline.
And until it violates its 21-day ma, there can be no intermediate-term decline. I
would
let the Buy B10 have every chance to get the DJI past 12900. At the round number
13000, we may have problems. But seasonality is 60% bullish for next two weeks
and 64% for the next week.
Bullishly there are 89 stocks whose Closing Powers are making new highs.
Only
38 show Closing Power new lows. Professionals are sticking with the rally.
The Rising Market Tide Is Lifting Nearly All Industries.
21 one of the 24 Stock Groups and Industries we track have more
than 50%
of
their components above their 65-dma. It is not clear where new downside
"leadershp"
would
come from. Probably energy stocks. Lower energy costs would help the economic
recovery, as long as they do not signify world-wide Deflation.
Low Interest Rates Are Bullish
But 10-Year Rates
Did Rise Today above Their 65-Day MA
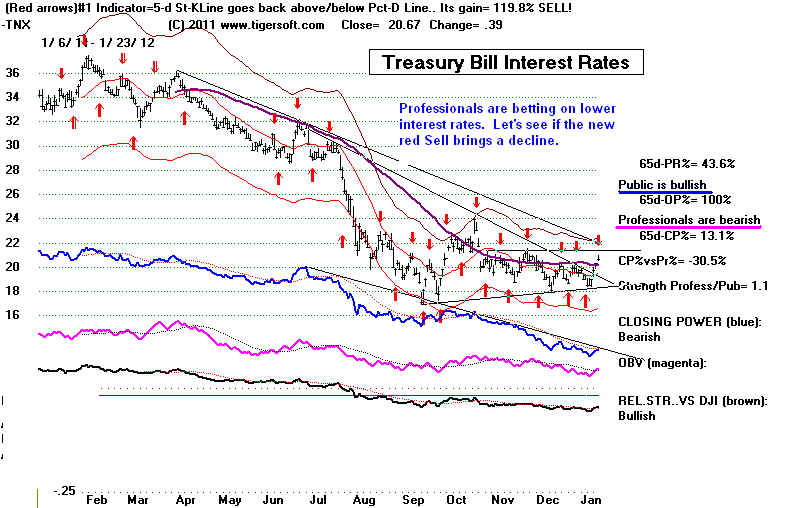
I doubt if interest rates are about to rise up much. But
watch them...
Volume remains very low. Joe
Granville has issued a major sell today because it. Two years
ago, Robert Prechter of Elliot
Wave fame did the same and has been wrong since. I think
that
Granville is making a similar mistake, though he is correct that nominal new closing highs
often
bring
reversals and that 20 of the 30 individual DJI stocks now show recent new highs that have
not
been
confirmed by OBV making a corresponding new high. He thinks the DJI will fall by
4,000
points in
2012. If there is a decline, the rising 65-day ma near 12000 should act as support.
I think the
market's gradual rise means a more sustainablble advance.
The very
high Accumulation readings on the DJI now (>.25) are two times more associated with a
continuing
rally of more than 3% or a new bull market than a decliue to the lower band and
a 3% paper
loss or less.
| High Accumulation (>.25) is Bullish 1 7/24/2009 . DJI moved much higher Big Loss 2 4/2/2003 . DJI moved much higher Big Loss 3 2/6/1996 DJI moved much higher. Big Loss 4 2/6/1991 DJI moved much higher. Big Loss 5 12/2/1987 DJI fell only to MA and then moved much higher. Big Loss 6 2/21/1986 DJI kept rallying Big Paper Loss 7 8/13/1979 DJI rallied for a month, rallying 4%. It then fell below lower band on Sell S9.. 8 9/21/1973 DJI rallied for a month, rallying 74%. It then fell below lower band on Sell S9.. 9 11/23/1963 DJI kept rallying Big Paper Loss 10 11/23/1963 DJI kept rallying Big Paper Loss 11 7/30/1958 DJI kept rallying Big Paper Loss 12 7/8/1954 DJI kept rallying Big Paper Loss 13 8/10/1951 DJI kept rallying Big Paper Loss 14 12/27/1949 DJI kept rallying Big Paper Loss 15 12/14/1949 DJI kept rallying Big Paper Loss 16 10/26/1949 DJI kept rallying Big Paper Loss 17 10/11/1949 DJI kept rallying Big Paper Loss 16 7/29/1949 DJI kept rallying Big Paper Loss |
High Accumulation (>.25) is
Bearish 1 8/2/2010 .DJI declined to lower band in next month. No paper loss if DJI shorted. 2 12/1/2010 .DJI advanced 3% and then fell to lower band in 2 months. 3 11/22/2002 .DJI advanced 3% and then fell to lower band. 4 8/20/2001 .DJI advanced 3% and then fell below the lower band. 5 10/21/1988 DJI fell to the lower band. No paper loss. 6 8/30/1987 .DJI advanced 2% and then fell below the lower band. 7 9/4/1986 .DJI fell 10%. No Paper Loss. 8 9/21/1973 .DJI fell below the lower band in 6 weeks.
|
Granville's Record
Granville's
creation, OBV, is a cumulative Volume line that goes up or down depending
on whether
prices rise or fall from the previous day. The weakness here is that OBV is
crude,
because it
adds or subtracts 100% of the volume no matter how small or large the daily change is
or whether
prices opened high or low... Granville can be very good and also very bad in his
predictions.
http://www.amazon.com/Granvilles-New-Stock-Market-Profits/dp/0133634086
http://www.amazon.com/Granvilles-Strategy-Market-Timing-Maximum/dp/0133634329/ref=pd_vtp_b_1
He was
completely wrong at the start of the 1982 bull market. He did not factor in the
"artificial" but
steep Fed
drop in interest rates. He remained bearish for years. Despite this, respect
him and
his ability
to move prices for a few days, as on Janaury 7, 1981. Granville taught people like
me that
stock
market tops could be correctly called. In this he and Larry Williams were mentors
and
inspirations. But Old Joe forgets that his famous book. Keys to Stock Market
Profits, actually
said that
the NYSE A/D Line was more important than his own On-Balance-Volume.
It is the
NYSE A/D Line strength born of very low interest rates that has boosted the
stock
market while Main Street Unemployment remains so high and Hourly Wages so low.
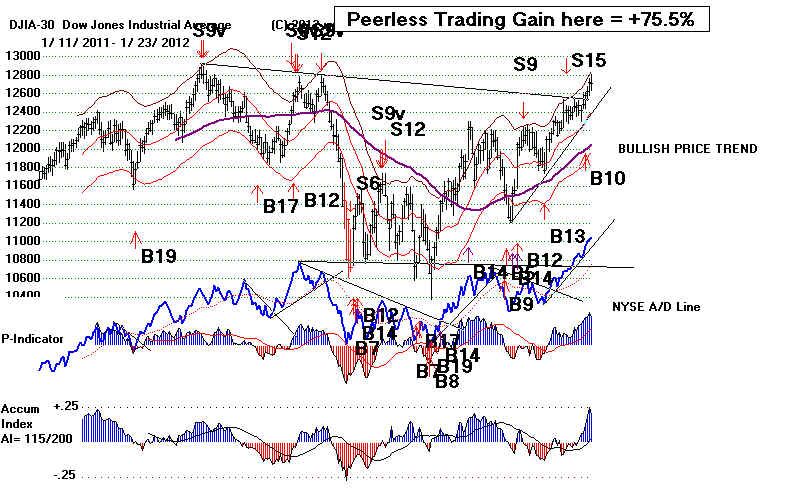
See how important
the Daily A/D Line was in the 2009-2012 advance. Look at the Daily A/D
line in the DJI
chart just below. It is making new highs far ahead of price. It shows
a bullish
divergence. This is even clearer when we view the weekly chart of the DJI
(second chart
below). The Weekly A/D Line has bolstered the bull market, despite the
many frustrated
critics, who cry out that the stock market's rally is "manipulated" and
made
"artificial" by low interest rates and deficit spending. Of course, the
stock market
is manipulated.
This is nothing new. Bull markets are launched by the Fed as much as
by inventions
like cars and the internet. See my discussion of the role of the Fed in 1970
and 1982. http://www.tigersoft.com/tiger-blogs/8-18-2003/index.htm
Bernanke and the
FED are supposed to, by their 1913
charter, bolster the banks in
hard times and
reduce business cycles with monetary policy. (My complaint is that they
do this secretly,
play favorites and impose NO lending conditions on the big banks.)
Tea-Party people,
I think, are the tools of those who want who own polluting industries, like
the Koch Brothers
do, who do not want to spend money on air scrubbers or abide by laws
to protect
waterways from their paper mill spills. The Kochs are eager to buy Wisconsin
publicly owned
utilities as cheaply as possible.
The larger fact
is that the Government is 1/3 of the entire US economy. The Bush years show
reducing
regulations and putting more money into the Swiss bank accounts of the top 0.2%
creates very few
more decent jobs in the US. Quite the contrary. Worse, it produced a
Bubble of
over-speculation in in mortgage debt, housing, energy and many stocks.
The 30,000
lobbyists in Washington DC prove that corporations need and want government
help. They
want cushy government contracts.
NOTE: The B13 has been added because of the
Santa Claus rally Buy we discussed ont he Hotline. This B13
will be part of the next release. If breadth is improving, the B13 can reverse
a Sell S9. If it is not improving,
as in December 2007, the Buy B13 is suppressed.
WEEKLY DJIA
=====================================================================================
OLDER HOTLINES
=====================================================================================
1/20/2012
DJI = 12720 +97 la/ma=1.028 21-dma ROC=.922 P= 669 (+105) IP21= .253 V= +116 OP= .392
DIA' s CP is uptrending A close
1.78 BELOW its opening would bearishly break the CP uptrend QQQ's CP is uptrending.
It will take a close of more than
I am impressed with how the DJI keeps rising despite the bearish seasonality for the last
week. Now the historical seasonality turns bullish. Since 1965, the DJI has
risen 64.4%
of the time in the week following January 22nd. Over the next ten days, it has risen
1% on average per year.
Chasing is difficult. I realize. But it is necessary, especially in January, to
stick with the
trend. The four earlier January B10s average gains of 15%. The Closing Powers
are
rising. A move to a new recovery high at 12900 seems highly likely. Fighting
the Feds-
Obama-Big Bank Financial Junta at this time is risky. Interest rates are low because
these people want a continued economic recovery to stay in power. Even Day Traders
are buying at the opening. There is more upside potential after the opening than
risk.
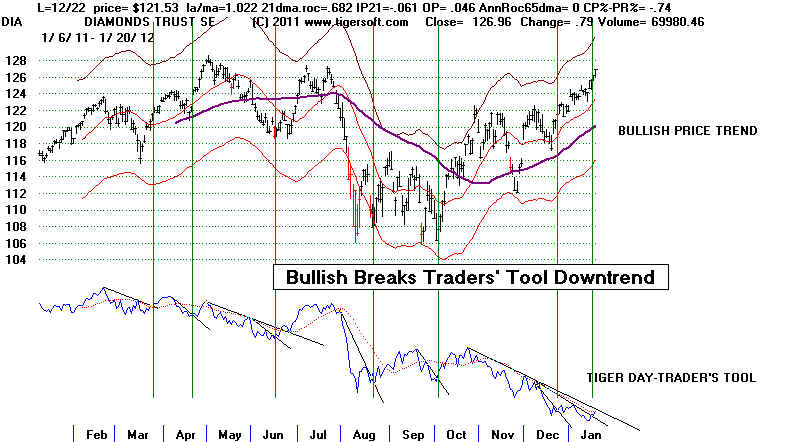
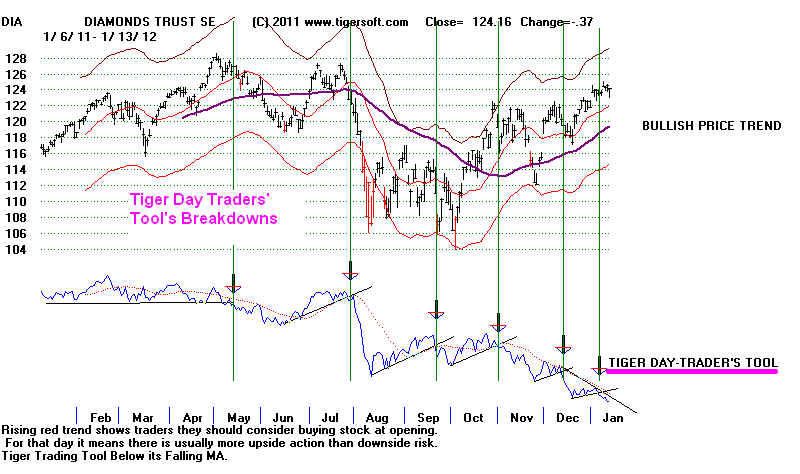
Their shift is shown in the breakout by the Tiger Day Traders' Tool.
This is reliably
bullish.
Only 3 of
the industry groups we follw still shows a plurality of stocks below their 65-day ma.
One is Food Commodities, which means inflation is not a threat to
the Fed' low interest rates'
policy.
Another are Gold Stocks. As these rise with
financial uncertainty and gathering inflation,
this is a
bullish sign. We should keep an eye on interest rates,
however. A rise in them would
drop the
many stocks and bonds on the NYSE that are rising because the Fed has promised
very low
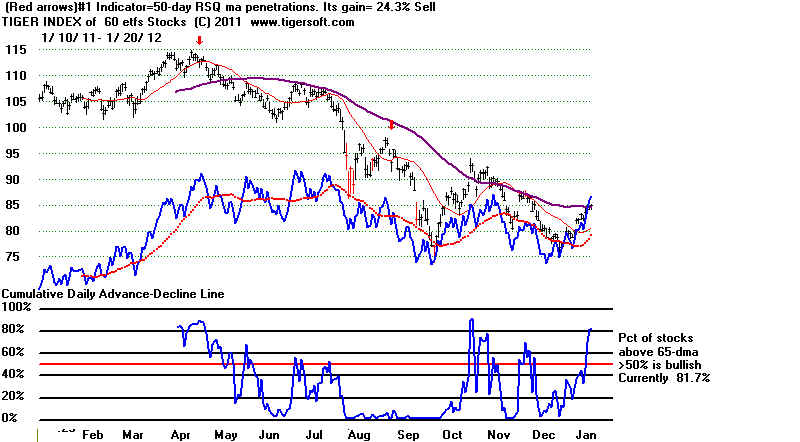
rates until 2013. Overseas markets have turned up, too. 82% of the 60 foreign ETFs
that we use
to build the Tiger ETFs' chart below are above their 65-day ma. FXI - the Xinhua
China
25 is the
most bullish, as ranked by Tiger. Even Europe's IEV has risen back to its 149-day
ma.
. The biggest gainers
among ETFs for the last 65 trading days have reached resistance levels.
The DJI-30 and the QQQ will probably
have to lead the advance now, if it is to continue. I would
expect the
DJI to reach a nominal new high near 12900. If it moves up in relative isolation,
there
will
probably be a Peerless Sell signal there.
EWZ - Brazil +15% at falling 200-day ma
Peerless and
Brazilian Stocks
FXI - Xinhua +15% (China) at falling 200-day ma
ILF - Latin America +11% at falling 200-day ma
Peerless and
Latin American Stocks
EWW - Mexico 10% at falling 200-day ma
Profitably
Trading Mexican Stocks
See Which Country ETFs
Have Worked Best with Peerless Automatic Buys and Sells since 1996?
$1,000 would have
become $100,000 in 15 years.
FXI - Xinhua
+15% (China) at falling 200-day ma 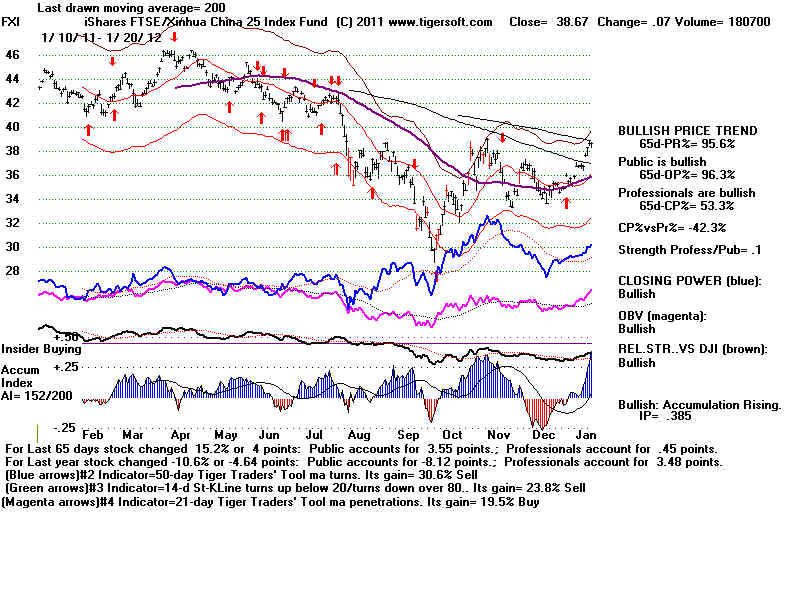 |
Europe's IEV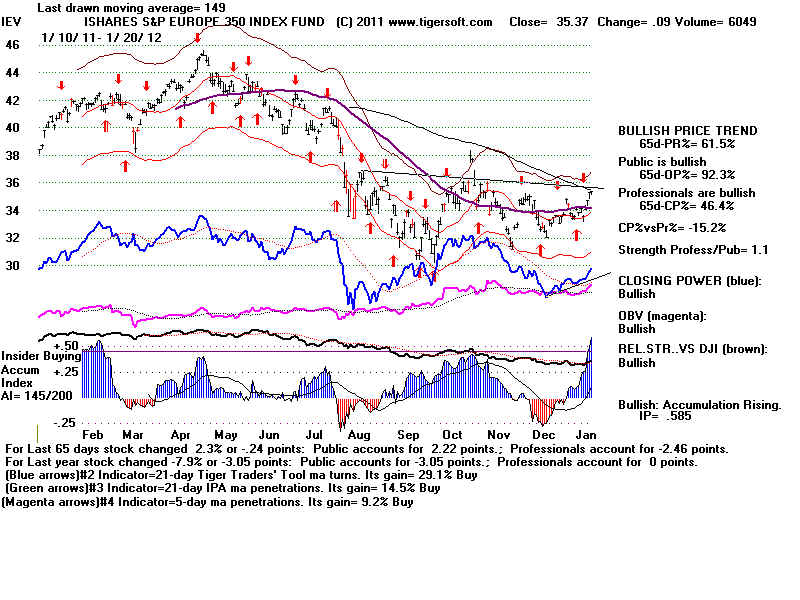 |
EWZ - Brazil
+15% at falling 200-day ma 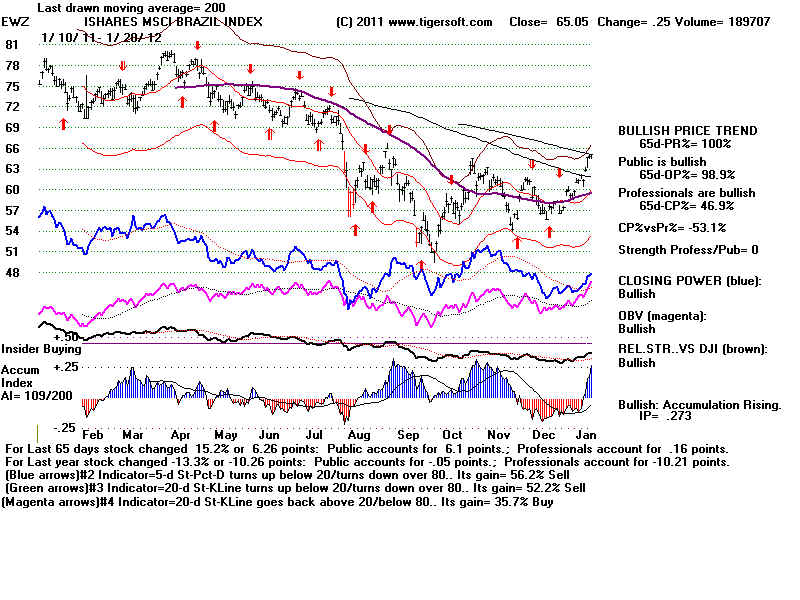 |
ILF -
Latin America +11% at falling 200-day ma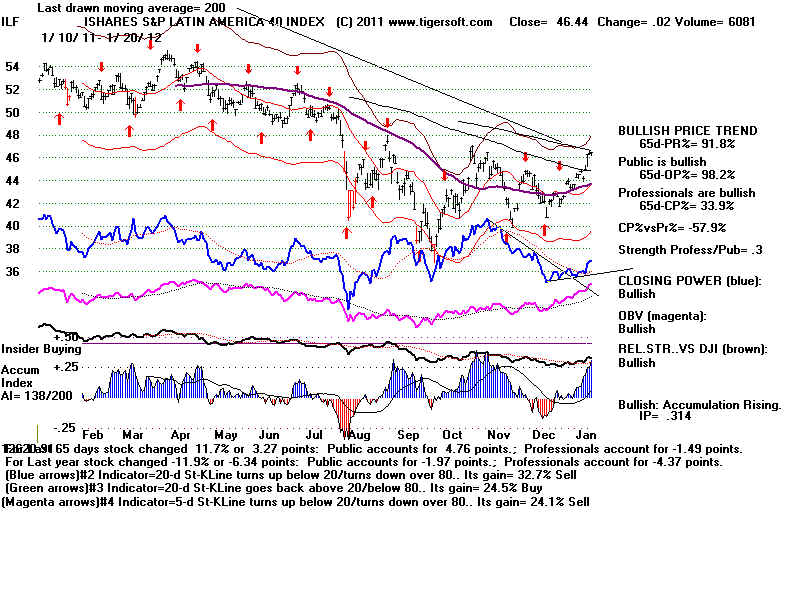 |
EWW - Mexico
10% at falling 200-day ma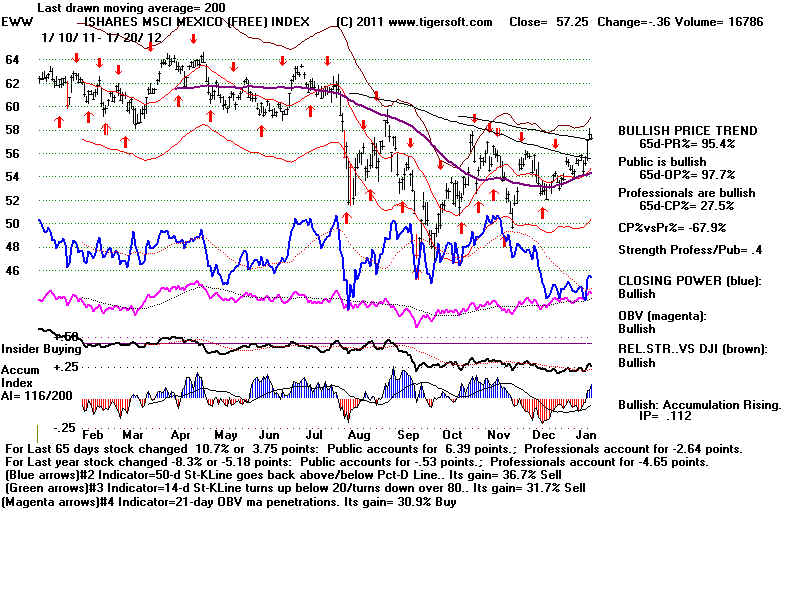 |
=====================================================================================
OLDER HOTLINES
=====================================================================================
1/19/2012 DJI = 12624
+45 la/ma=1.024 21-dma ROC=.734 P= 564 (+10) IP21= .188
V= +84 OP= .286
Reversing Buy B10 Reigns Now.
Volume could certainly
be higher, but breadth is good
and the Closing Power
trends are now rising. The DJI
does face generally
bearish seasonality for the next week.
Since 1965, the DJI has
risen only 40% of the time in the
week after January
19th. Our Stocks' Hotline is more than 2:1
bullishly hedged.

DIA' s
CP is uptrending
A close 1.02 BELOW its opening would bearishly break the CP uptrend
Opening Power is rising.
SPY's C's is uptrending.
It would take a Close 1.19 BELOW the Opening to break the uptrend
Opening Power is rising.
QQQ's CP is uptrending.
It will take a close of more than 0.46 BELOW the
Opening to break the short-term CP UP-trendline.
Opening Power is
rising.
GLD's CP broke its down-trendline
and is considered uptrending.
it would take a close of
1/19/2012 BUY B10s Do Successfully Reverse Earlier Sells Narrative of Hotline
DIA's late 1999 CP recovery and breakout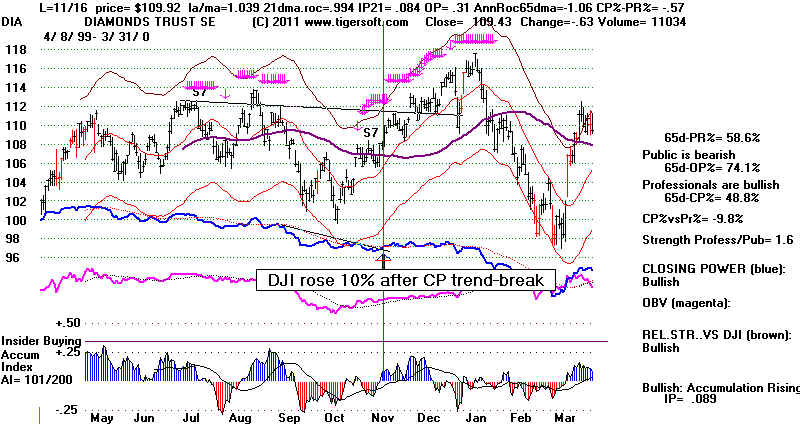
|
DIA's late 2005 and early 2006 CP recovery and breakout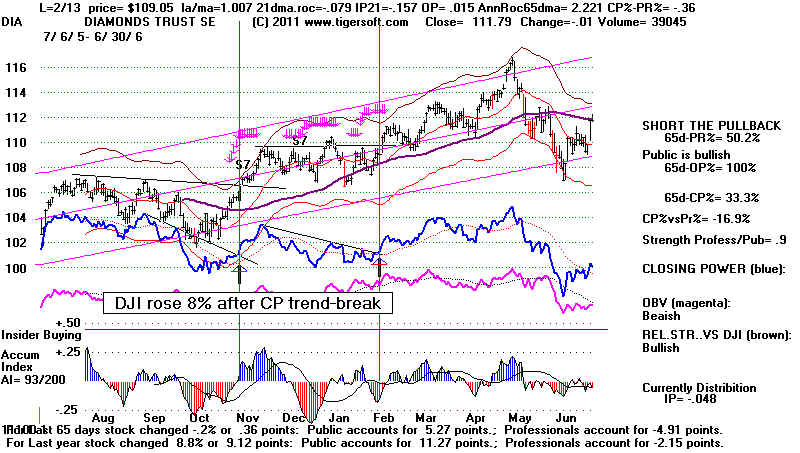 |
Tiger Index of Foreign ETFs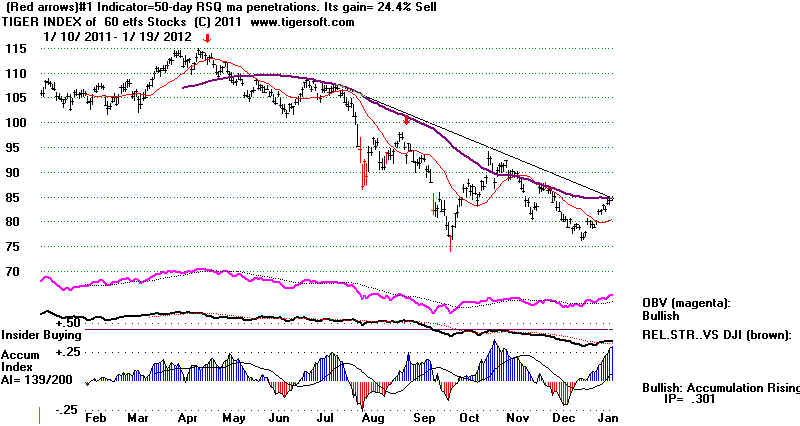 |
Tiger Index of Big Banks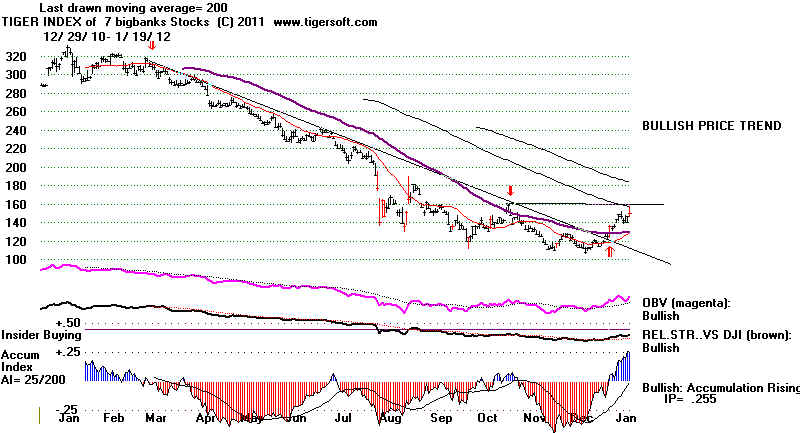 |
Tiger Index of Home Building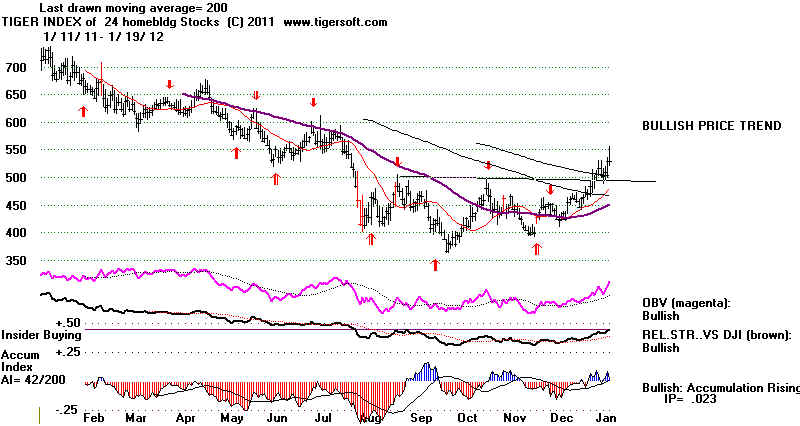 |
==============================================================
1/18/2012 DJI = 12579 +97 la/ma=1.023 21-dma
ROC=.69 P= 553 (+46) IP21= .125 V= +95 OP= .107
Reversing Buy B10
Today. Excellent A/D Line but volume was low.
12800-12900 is the next target.
1/18/2011
BREADTH
STATISTICS:
110 (+42) MAXCP stocks Bullish MAXCP Stocks Bullish.
2
(-1) Super-2011 Stocks making New Highs
65 (-57) MINCP stocks Bearish MINCP
Stocks
MAXCP stocks are those showing
Tiger Closing Power making new highs.
This suggests heavy Professional Buying. Applying the Tiger Power Ranker's
"bullish" to the MAXCP stocks find those with heavy insider buying and
institutional accumulation. Bearish MINCP stocks show the opposite.
57 (+21) new highs on NASDAQ. 7 (-12) new lows on NASDAQ Bullish.
86 (+27) new
highs NYSE 9 new lows on NYSE Bullish.
1/18/2012 GRAPHS ===> See Key Peerless TigerSoft
Index Charts: Industry Groups and ETFs
DIA SPY QQQ DJIA-Peerless TigerDJI TigerSPY TigerQQQ GLD SLV Crude
1/18/2012 ===> Closing Power (CP) Status Report: KEY ETF CHARTS:
DIA' s
CP is uptrending
A close 0.87 BELOW
its opening would bearishly break the CP uptrend
Opening Power is rising.
SPY's C's is uptrending.
It would take a Close 1.12 BELOW the Opening to break the uptrend
Opening Power is
rising.
QQQ's CP is uptrending.
It will take a close of more than 0.46 BELOW the
Opening to break the short-term CP UP-trendline.
Opening Power is
rising.
GLD's CP broke its down-trendline
and is considered uptrending.
it would take a close of 1.22 ABOVE the Opening to
break this CP-UP-trendline.
Opening Power is rising.
1/18/2012
Narrative of Hotline
Today brought a Buy B10 from Peerless. This
repepresents a breakout and close above well-tested,
flat resistance that goes back at least 40 trading days.
The P-Indicator and current Accumulation
Index must be quite positive. See http://tigersoft.com/PeerInst/-Buy-B10.htm
Automatic B10s average gains
in the DJI of about 10% when next reversed by an automatic
Sell There have been 4 January Buy B10s.
These averaged a DJI gain of +15.9%
at the time of the next Peerless Sell. See the FIRST TABLE below.
It is best to accept the small loss
now in the short of DIA and any short sales whose Closing Power has
broken out above its downtrendline or above the 65-dma.
Following our suggestion, one would have
shorted on Monday's opening at 125.04 and closed at today's
close at 125.62. Consider buying the most
bullish (as ranked by the Power Ranker) of the Home-Building, Biotechs, Pipe-Line and Super-2011
Stocks.
HOME BUILDING: HD
44.88 NVR 752.7
BIOTECHS:
PCYC 16.39 BMRN 36.03 ELGX 12.48
PIPELINES: MWE 56.39,
WES 39.28
SUPER 2011: PCYC
16.39, AKRX 11.56, HCCI 20.86
With the Buy B10, we must expect the general market to rise
further. Buy B10s have 4 times reversed a
Peerless Sell Signal, like now. Only one brought a paper
loss. All of these brought significant gains.
Three of the four brought gains of more than +17%.
See the SECOND TABLE below and the charts of
these four cases.
FIRST TABLE
JANUARY B10s were all profitable.
1/18/2012 DJI = 12579
la/ma
21-dmaROC P-I Change
IP21
V-I Opct.
1.023
.69
P= 553 (+46) .125 +95 .107 (low)
1/13/1967  835.13 +4.0%
    la/ma   21-dmaROC  P-I Change   IP21   V-I    Opct.
    1.039  .273    135  21   .07    5   .221
 Bottom formation B10 after a Bear Market.   DJI rose immediately.  No paper loss.
   ... Reversed at 968.49 on 3/16/67 by S12
|
1/7/1976   898.69 +12.3%
    la/ma     21-dmaROC  P-I Change   IP21   V-I   Opct.
    1.054    1.124   286   35  .20   2   .536
 DJI rose immediately  .. Reversed at 1009.21 on 3/24/76 by S9  No paper loss.
|
1/12/1989  2222.32  +24.7%
    la/ma     21-dmaROC  P-I Change   IP21   V-I     Opct.
    1.023   .454    118   21  .078   11   .185
 DJI rose immediately  ... No paper loss...Reversed at 2771.09 on 10/4/89 by S9
|
1/31/1991 2736.39 +22.6% la/ma 21-dmaROC P-I Change IP21 V-I Opct. 1.058 .58 143 33 .116 12 .218 DJI rose immediately ... Reversed at 3353.76 on 4/15/92 by S9 |
SECOND TABLE
Buy B10s have profitably reversed 4 Peerless
Sells.
       Sell S8     5/28/1945    164       -1.0% On-Going Bull Market
       BUY B10     8/24/1945    169.9    +17.2%

       SELL  S9     1/7/58      447.8     -2.4%  Bear Market Bottom
       BUY   B10    2/4/58      458.7    +41.7%

       SELL  S2     9/3/68      900.36    -3.9%  On-Going Bull Market
       BUY   B10    9/30/68     935.79    +4.5%
       Sell  S9V    8/12/96    5794.98    -2.3%  On-Going Bull Market
       Buy   B10    9/13/96    5838.52   +17.0%
Buy B10 8/24/1945 169.9 +17.2% 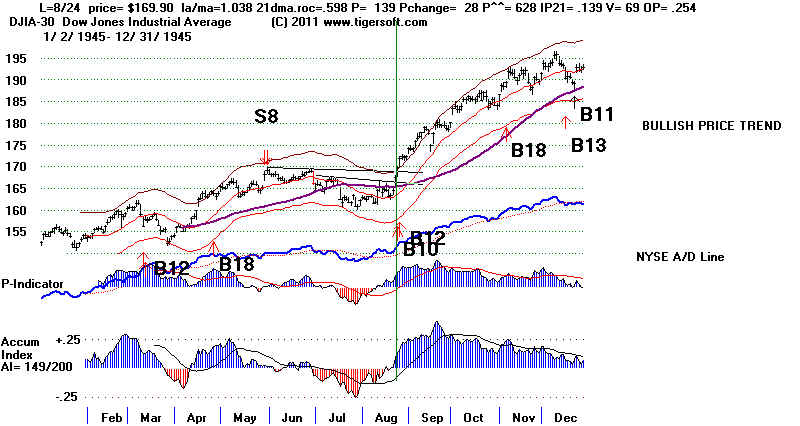 |
Buy B10 2/4/58 458.7 +41.7%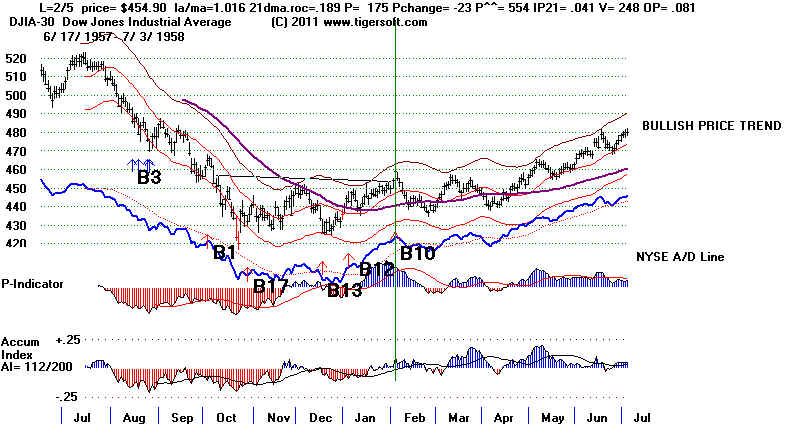 |
Buy B10 9/30/68 935.79 +4.5%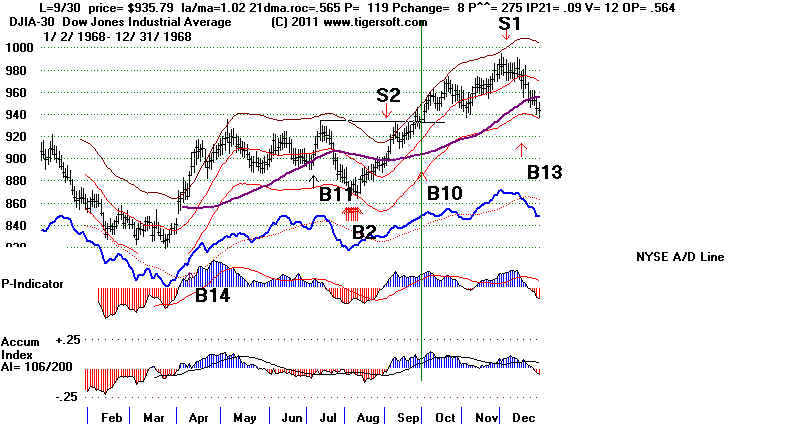 |
Buy B10 9/13/96 5838.52 +17.0% 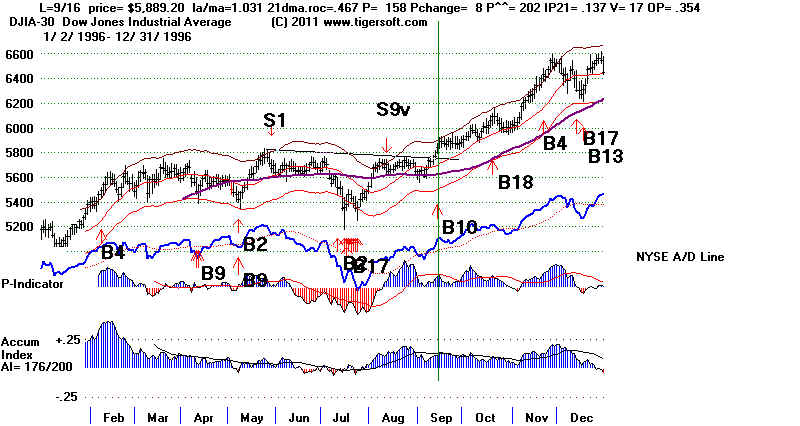 |
==============================================================
OLDER HOTLINES
==============================================================
1/17/2012 DJI = 12482 +60 la/ma=1.018 21-dma
ROC=.641 P= 507 (+96) IP21= .068 V= +80 OP= .118
1/17/2011
BREADTH
STATISTICS:
68 (-10) MAXCP stocks Bullish MAXCP Stocks
NEW 3 Super-2011
Stocks making New Highs
112 (+35) MINCP stocks Bearish MINCP
Stocks
Bearish.
MAXCP stocks are those showing
Tiger Closing Power making new highs.
This suggests heavy Professional Buying. Applying the Tiger Power Ranker's
"bullish" to the MAXCP stocks find those with heavy insider buying and
institutional accumulation. Bearish MINCP stocks show the opposite.
36 new highs on NASDAQ. 19 new lows on NASDAQ Bullish.
59 new
highs NYSE 19 new lows on NYSE Bullish.
1/17/2012 GRAPHS ===> See Key Peerless TigerSoft
Index Charts: Industry Groups and ETFs
DIA SPY QQQ DJIA-Peerless TigerDJI TigerSPY TigerQQQ GLD SLV Crude
1/17/2012 ===> Closing Power (CP) Status Report: KEY ETF CHARTS:
DIA' s
CP's is flat A close 0.53 ABOVE its opening would be a CP breakout.
Opening Power is rising.
SPY's CP broke its uptrend.
It would take a Close 1.00 ABOVE the Opening to
restore the CP uptrend. Opening Power is rising.
QQQ's CP bullishly still above its UPTrendline.
It will take a close of more than 0.17 BELOW the
Opening to break the short-term CP UP-trendline.
Opening Power is
rising.
GLD's CP longer-term trading
DOWN-trendline is being challenged.
it would take a close of only 0.19 ABOVE the Opening to
break this CP-DOWN-trendline.
Opening Power is rising.
1/17/2012
Narrative of Hotline
Operative Peerless Signal is still a Sell S15.
S15s have always been profitable. The biggest Paper loss selling short the DJI with
one
was only 3%. See http://tigersoft.com/PeerInst/-SellS15.htm
A turning down now by prices would show that the Resistance
the DJI has neen reached and the Bearish Seasonality for the next two weeks
has won out. Unless the DJI can close clearly above the resistance line,
at 12550, the risks now are greater than the upside potentia. The number
of stocks making CLosing Power 52 week lows is almost twice the number
making new highs. This remains a defensive market. Utility stocks,
Pipeline stocks, Biotechs
and Bonds are the favored groups, along with
the exceptionally high performance stocks of 2011 (SUPER2011).
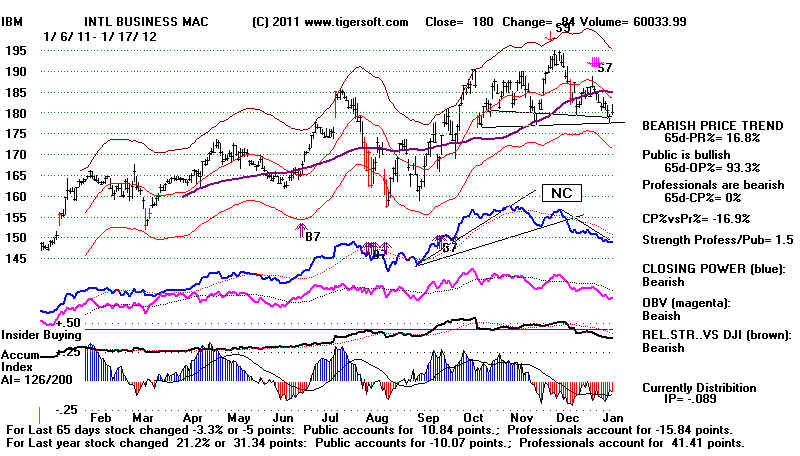
I thnk it is clearly bearish that IBM, the highest priced and most heavily weighted
DJI-30 stock shows a head/shoulders pattern with confirming red Distribution on
the right shoulder.
IBM Head/Shoulders, S9, S7s
Shorting the bearish MINCP stocks and buying some of
the Bullish MAXCP stocks
has been our strategy, rather than shorting DIA, until this Monday's opening, when
shorting was recommended of DIA. Hold the shorts
for now. The Openings have
been carrying the market higher, not the trading after the opening. This past year
has been unusual in that. Better gains this past year have generally been had
waiting
for the Opening Power to break its uptrend rather than CLosing Power uptrend-breaks.
The Opening Power uptrend is still rising, but its steep uptrend is becoming jagged and
was briefly
broken Friday.
DIA's Rising Wedge Pattern is Bearish.
Weak Closing Power and Rising Opening Power
A DIA close more than
0.53 above the Opening would be a CP upside breakout.
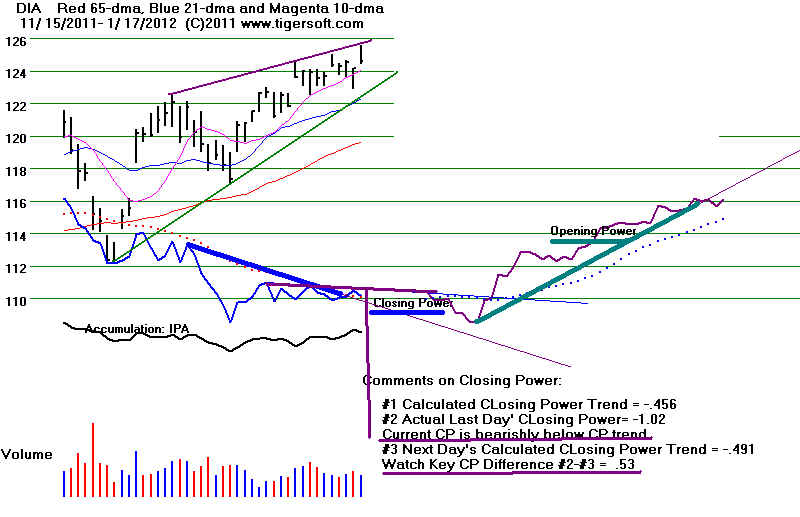
Selling when the Opening Power Broke its Trend-lines was profitable this past year.
Usually, weak closes and strong openings have meant Public Speculation or Overseas
Buying of US Stocks. Ordinarily this is bearish. But not always. I have
mentioned that
I believe that an Obama-Fed-Wall Street Financial Junta exists and may be buying Index
Futures
in overseas trading before the Opening to try to keep the rally alive. This
may be a new
version of "Don't Fight The Fed". Obama desperately needs a higher stock
market in 2012
to continue to get Wall Street backing in our Money-Is-Everything
Sytem now. And he
hopes that there will be enough trickle down jobs created thereby to get the millions who
are marginally employed to turn out and vote for him as they did in 2008.
Besides this, we do not want to be stubborn. .Professionals who do their buying
mostly
after the Opening in NY have been known to switch from bearish to bullish when
they see that the Openings are just too strong to fight. The CLosing Power now for
DIA and
SPY have broken their lengthy downtrends in this rally, but have not made upside
breakouts from their narrow trading range. If they do this, I would assume that the
Professionals have switched to buying and we should, too. For now, the odds are 2:1
that there will be a DJI decline, based on earlier cases when we saw such sizeable
divergence between a rising Opening Powe and falling Closing Power in the major market
ETFs. These divergences produce Tiger Stock Sell S7s. See the study a few
days ago.
I have emphasized the four year Presidential Cycle. I think we should again look
back at how the stock market has behaved with a Democrat in the White House
running for re-election. That means:
FDR in January 1936 --- Breakout without B10.
Truman in January 1948 --- Breakdown Sell S10s
LBJ in January 1964 --- Breakout without B10.
Carter in January 1980 - Multiple Sells and False Breakout
Clinton in January 1996. --- Breakout without B10.
Price breakouts in January and February of the Presidential
Election year
that did not bring Peerless Sell Signals went significantly higher. In early 1948 the
market broke down rather than up. In February 1980, it made a false breakout
comoplete with multiple Sells. To me this suggests that a
close above 12550 that
does not bring a new Peerless Sell should be taken as showing that the market
is too strong to stay short DIA.
FDR in January 1936 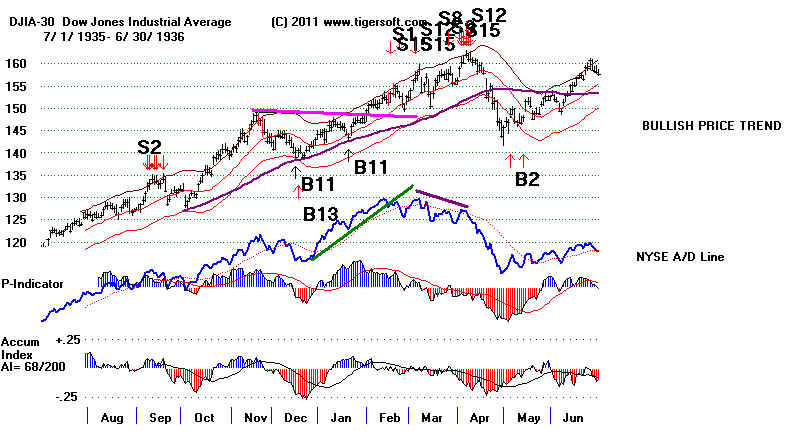 |
|
Truman in January 1948 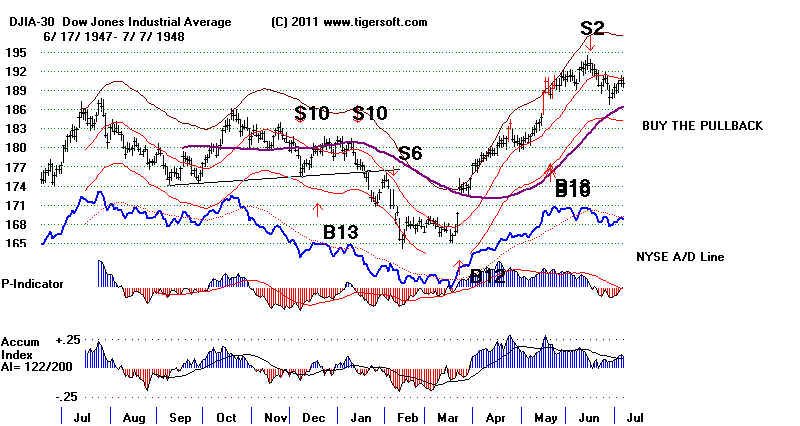 |
|
LBJ in January 1964 (although one could also look at 1968) 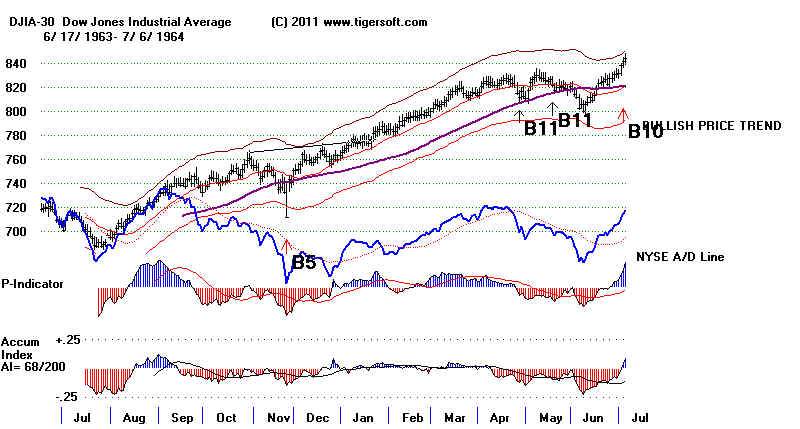 |
|
Carter in February 1980 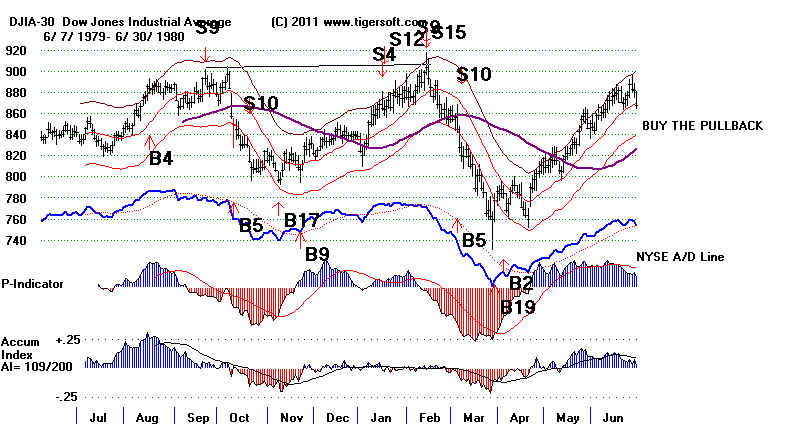 |
|
Clinton in January 1996. 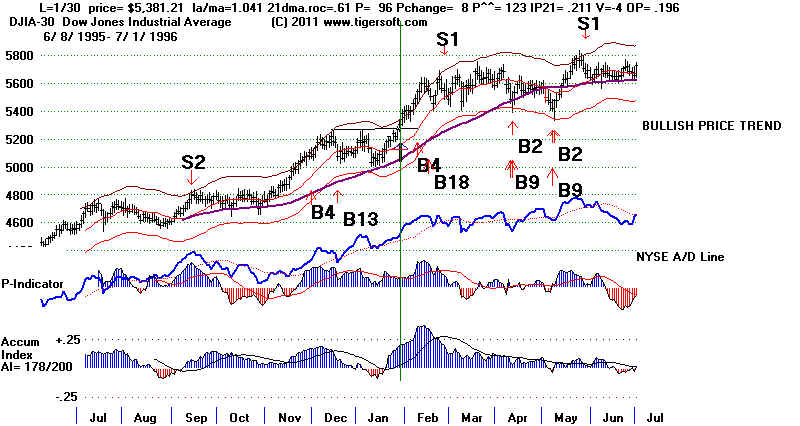 |
=====================================================
OLDER HOTLINES
=====================================================
1/13/2012
DJI = 12422 -49 la/ma=1.016 21-dma ROC=.456 P= 411 (+18) IP21= .063 V= +52 OP= .012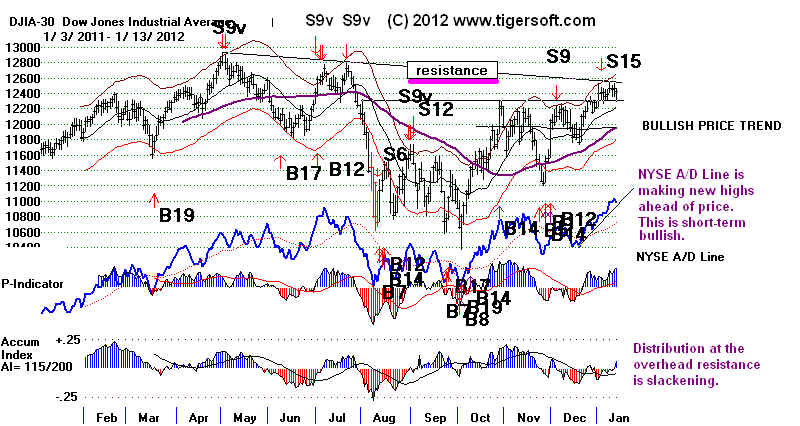
1/13/2012 ===> Closing Power (CP) Status Report: KEY ETF CHARTS:
DIA' s CP's is flat A close 0.15 ABOVE its opening would be a CP breakout.
Opening Power is
rising.
SPY's CP is flat. It would take a Close 0.20 ABOVE the Opening to achive
an upside CP breakout.
Opening Power is rising.
QQQ's CP bullishly still above its UPTrendline.
It will take a close of more than 0.10 BELOW the
Opening to break the short-term CP UP-trendline.
Opening Power is rising.
GLD's CP longer-term trading
DOWN-trendline is being challenged.
it would take a close of only 0.15 ABOVE the Opening to
break this CP-DOWN-trendline.
The Opening Power is rising
again.
1/13/2012
Narrative of Hotline
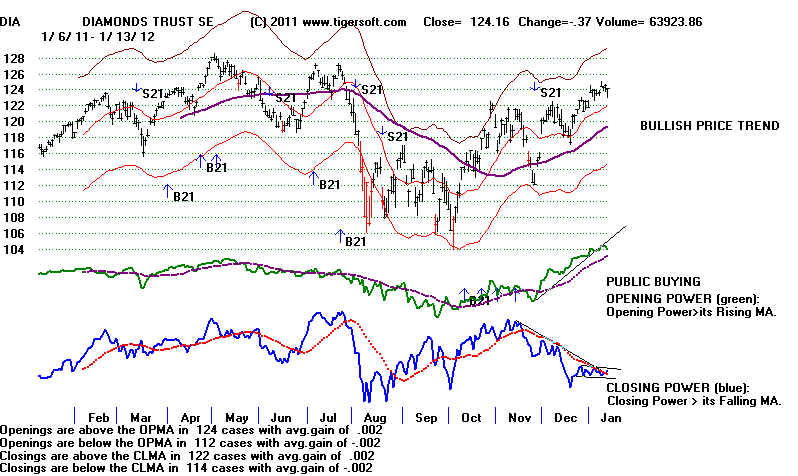
| WHAT MARKET MAKERS KNOW A cutomer sent me a Zero-Hedge Link showing the "profitability of being long Gold in the overnight session and shorting it during the day". We have these statistics available using Peercomm + Charts 2011 + GO1600 (Gold Perpetual contract) + Ind.3 + Tiger Basis of Move. Whereas, they are taling about an annualized gain of 43% a year, in theory where commisssions and slippage are not factors, we can achieve a gain twice as large using the trend of the 21-day ma of Opening and Closing Power to decide whether to go long or short. See the Tiger chart below for just the last 12 months. The results here are typical. Bigger gains are made with individual Gold and Silver Stocks. See NEM, PAAS and ANV. Compare these results with DIA and QQQ, too. The problem of slippage and commissions would have to be factored in before using this approach. Market makers are in the best possible position to use this approach. Commissions are zero and the slippage they can strictly limit. Tiger Users have to find trading vehicles with bigger gains than the ones shown by Gold or DIA below. In the attached chart GO1620, we see a breakdown that improves the results. Openings above its 21-day ma 148 X .002 = .296 or 29.6% In this case we would go LONG at the "Close" in NY and Sell at OPening in NY for Gain of +29.6% Openings below its 21-day ma 88 X -.001 = - .088 or -8.1% In this case we would go SHORT at the "Close" in NY and Cover at OPening in NY for Gain of +8.1% Closings above its 21-day ma 139 X .003 = .417 = 41.7% In this case we would go LONG at the Opening in NY and Sell the position at the "Close" for Gain of +41.7% Closings below its 21-day ma 97 X -.003 = - .291 = -29.1% In this case we would go SHORT at the Opening in NY and Cover the position at the "Close" for Gain of 29.1% ------------------------------------------ Sum = over-night gains + NY session gains Sum = (29.6 + 8.1%) + (41.7% +29.1%) Sum = 37.7 + 70.8% Sum of Gains = +108.5% .GOLD PERPETUAL CONTRACT - B21 and S21s shown when both Openings and Closings are above their ma and vice verse. See the statistics at bottom of chart that TigerSoft generates. The Summation stats will have to be programmed.  |
NEM - Gold Stock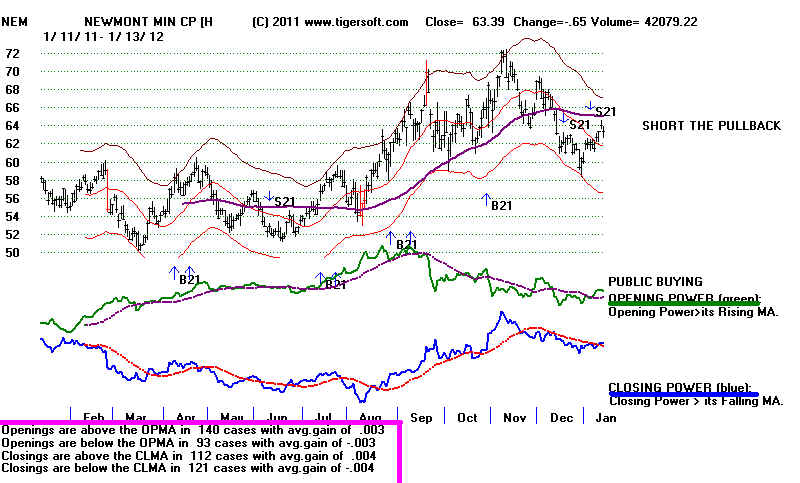 |
PAAS - Silver Stock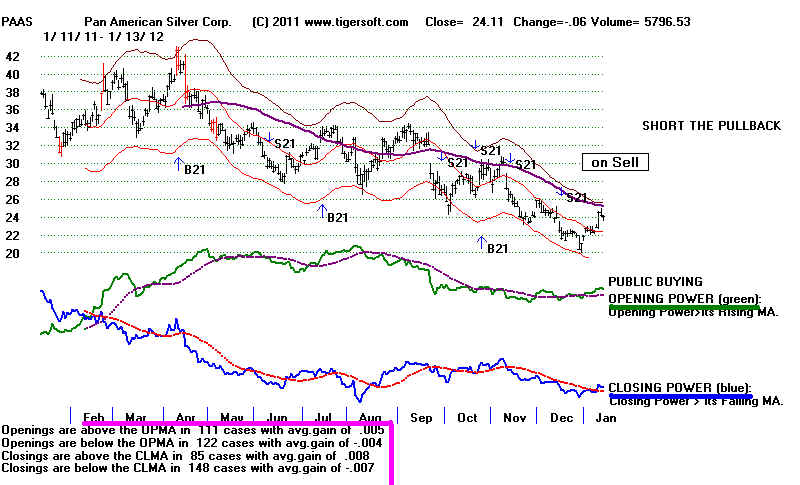 |
ANV - Gold Stock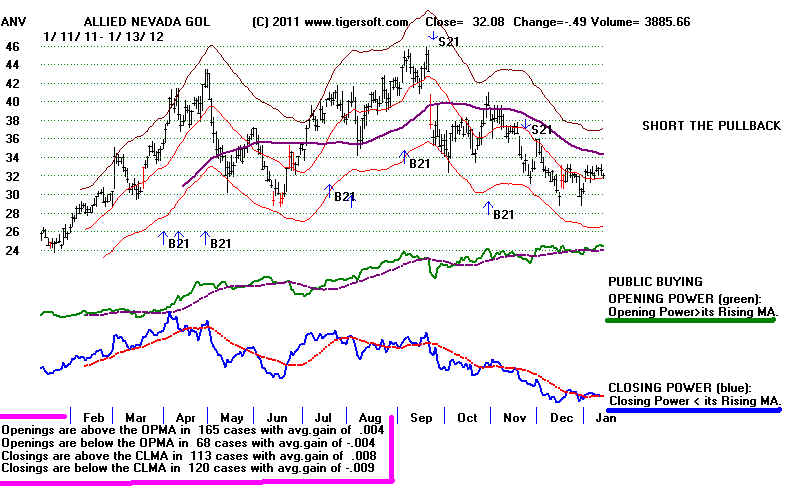 |
QQQ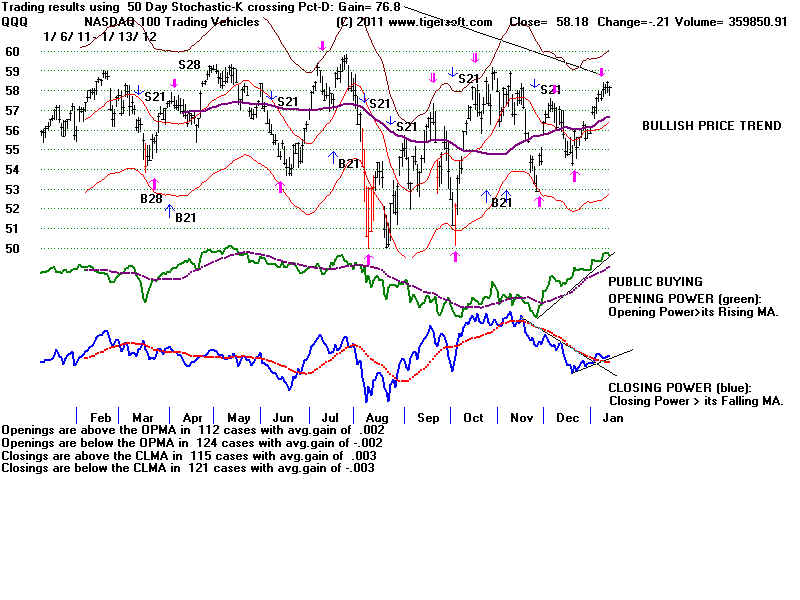 |
=====================================================================
OLDER HOTLINES
=====================================================================
1/12/2012
DJI = 12471 +22 la/ma=1.022 21-dma ROC=.439 P= 392 (116) IP21= -.007 V= +43 OP= .0041/12/2012 ===> Closing Power (CP) Status Report: KEY ETF CHARTS:
DIA' s CP's IS
now above its CO down-trend-line A close 0.10 BELOW its opening would restore the
CP DOWNtrend. Opening
Power is rising.
SPY's CP's minor
UPtrend-line is restored. It would take a Close 0.26 ABOVE the Opening to achive
an
upside CP breakout.
QQQ's CP bullishly still above its UPTrendline.
It will take a close of more than 0.08 BELOW the
Opening to break the short-term CP UP-trendline.
Opening Power is rising.
GLD's CP longer-term trading
DOWN-trendline is being challenged.
it would take a close of only 0.23 ABOVE the Opening to
break this CP-DOWN-trendline.
The Opening Power is rising
again.
1/12/2012
Narrative of Hotline
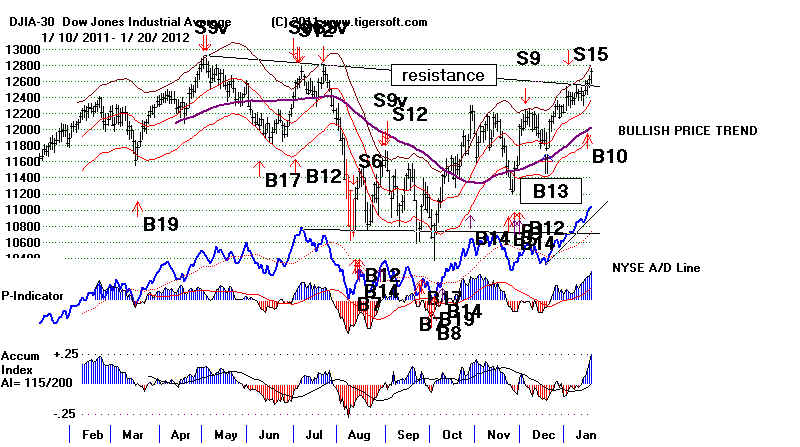
NYSE A/D Line is
streaking to new highs ahead of the DJI. This is bullish short-term.
But the DJI needs to penetrate the resistance
line it has reached. S15s are very reliable,
but can bring as much as a 3% paper
loss. A reversal down tomorrow would show the resistance
has overcome the low volume buyers. The
rising 65-dma as 12000 would be expected support.
Traders will be nervous about holding positions
over the weekend with US-Israeli tensions with Iran so high
HOW LONG CAN THE MARKET RALLY AGAINST AN S15
BASED ON RISING OPENINGS ALONE?
If the DJI can breakout
above the resistance it has now reached.
it can advance perhaps 2.5% more and for 6-7 weeks
more. Read the details below....
We remajn hedged, but we are not yet short the major
market ETFs despite the Peerless Sells.. A reversal
from resistance tomorrow would probably get me to
advise shorting DIA. But let's await market
action....
The biggest paper loss in the case of past
Sell S15s was 3%. In our case the Sell S15 occurred
with the DJI at 12418.42 on January 4th.
The DJI is now 53 points and only 1/2% higher than where
it was when the Sell S15 occurred. The
could move up another 250 points and tag the 12500 resistance
and still be within the range of past S15s.
TIGER SELL S7s SHOW EXTREME DIVERGENCE BETWEEN
RISING OPENING POWER AND CLOSING POWER
The Opening Power for the DIA (and the other
major market ETFs) has been rising since November
30th even though the Closing Power has been
falling. For the last 30 trading days we have seen this
widening divergence. The divergence
causes Sell S7s to appear. A cluster of two weeks or more
Sell S7s is usually, but not always bearish.
The ratio of significant declines to significant rallies
after a cluster of consecutive Sell S7s is
10:3. See the tables below and the charts that are linked to.
You can see that there are in 4 cases the
cluster of S7s lasted between 7 and 13 weeks.

Sell S7s can be placed on the DIA chart
using the first choice under Ind-3 to show this divergence.
Our software measures the divergence in a way
that permits comparisons with the past. Tiger calculates
how far from its 65-day low to its 65-day high
are PRice, Opening Power and Closing Power are.
That is the meaning of the terms 65day-PR%,
65day-OP% and 65-dayCP%.
The values of each are shown on
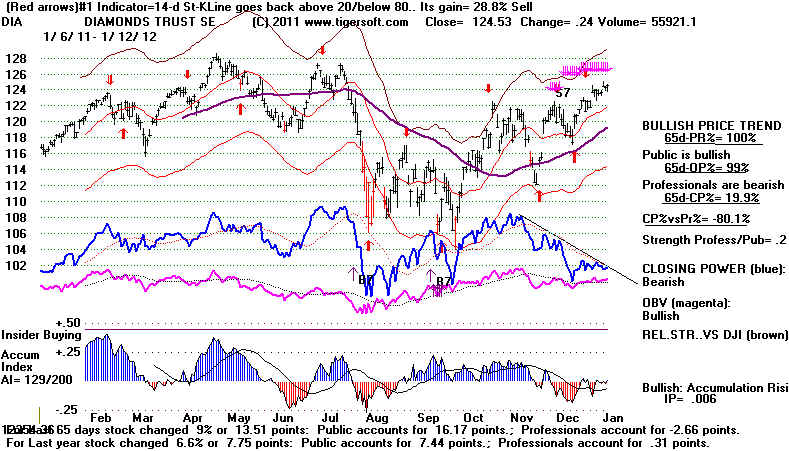
all initial TigerSoft stock charts. For the DIA those numbers are:
65day-PR% = 100% (Price is at its 100-day high)
65day-OP% = 99% (Opening Power is 99% of the way up from its 100-day low to its
high)
65-dayCP% = 19.9% (Closing Power is 19.9% of the way up from its 100-day
low to its high)
We measure the divergence between the
CLosing Power Pct and the Opening Power Pct.
CP%-Pr% = -80.1% (19.9%-99%)
Tiger B7s show
when there is a bullish CP%-Pr% divergence greater than +.37 and
Tiger S7s show
when there is a bearish CP%-Pr% divergence with a value below -.37.
| STRINGS OF
CONSECUTIVE DAY SELL S7s ON DIA: 1998-2011 In 10 of 13 cases, the DJI fell at least 5% before it rallied more than 4%. In 4 of 13 cases, the cluster of consecutive Sell S7s lasted 7 to 13 weeks. #1 5/6/98-6/10/98 (5 weeks) la/ma 21-dma-roc IP21 OPct CP%-PR% 5/14/98 1.009 -.026 .042 -.33 -.33 DIA fell 5%, from 91.81 to 86 (149-day ma) ---------------------------------------------------- #2 6/25/98-7/29/98 (5 weeks) la/ma 21-dma-roc IP21 OPct CP%-PR% 7/15/98 1.029 .864 .153 .411 -.72 DIA fell 20% ---------------------------------------------------- #3 6/9/99-9/14/99 (13 weeks) la/ma 21-dma-roc IP21 OPct CP%-PR% 8/24/99 1.037 .493 .161 .065 -.43 DIA fell 10% from peak on 8/25/99 ---------------------------------------------------- #4 11/2/99-1/27/00 (12 weeks) la/ma 21-dma-roc IP21 OPct CP%-PR% 11/17/00 1.047 +1.294 .07 .615 -.71 small decl and rise 1/14/00 1.032 .549 .022 .47 -.56 top DIA rallied from 108 to 114 and then fell 17% ---------------------------------------------------- #5 5/8/02-5/23/02 (3 weeks) la/ma 21-dma-roc IP21 OPct CP%-PR% 5/16/02 1.025 .091 -.031 -.037 -.41 BEAR MARKET FOLLOWS. ---------------------------------------------------- #6 7/31/03-9/2/03 (8 weeks) la/ma 21-dma-roc IP21 OPct CP%-PR% 8/21/03 1.02 .306 .103 .284 -.56 8/22/03 1.006 .154 -.028 .136 -.73 After shallow decline to rising 65-dma, Bull market resumes. ---------------------------------------------------- #7 1/31/05-2/17/05 (3 weeks) la/ma 21-dma-roc IP21 OPct CP%-PR% 2/15/05 1.024 .341 -.017 .099 -.45 3% DIA rally, then 7% decline ---------------------------------------------------- #8 12/9/05-3/2/06 (12 weeks) la/ma 21-dma-roc IP21 OPct CP%-PR% 1/30/06 1.007 .251 .099 .288 -.35 65-DMA Acted as SUPPORT. Bull market resumes. Better to wait for new S9. ---------------------------------------------------- #9 8/14/06-9/5/06 (3 weeks) la/ma 21-dma-roc IP21 OPct CP%-PR% 8/16/06 1.02 .546 .138 .066 -.73 9/5/06 1.017 .32 .145 .143 -.43 Bull market resumes. ---------------------------------------------------- #10 9/27/07-10/19/07 (4 weeks) la/ma 21-dma-roc IP21 OPct CP%-PR% 10/9/07 1.028 .839 .188 .218 -.37 10% DECLINE by 11/26/07 ---------------------------------------------------- #11 6/9/08-6/18/08 (2 weeks) la/ma 21-dma-roc IP21 OPct CP%-PR% 6/17/08 .981 -.61 -.192 -.068 -.48 SEVERE BEAR MARKET FOLLOWED ---------------------------------------------------- #12 12/22/09-1/6/10 (2 weeks) la/ma 21-dma-roc IP21 OPct CP%-PR% 1/6/10 1.018 -.288 .058 .322 -.36 7% Decline ---------------------------------------------------- #13 4/20/11-5/24/11 (5 weeks) la/ma 21-dma-roc IP21 OPct CP%-PR% 5/2/11 1.022 .325 .142 .24 -.26 Top and 7% DIA DECLINE ---------------------------------------------------- #14 12/5/11-1/12/12 (6 weeks, so far.) la/ma 21-dma-roc IP21 OPct CP%-PR% 1/12/12 1.031 .503 -.026 .225 -.75 ========================================================== |
=====================================================================
OLDER HOTLINES
=====================================================================
1/11/2012
DJI = 12449 la/ma=1.022 21-dma ROC=.259 P= 275 P= -87 IP21= -.019 V= +8 OP= -.0881/11/2012 ===> Closing Power (CP) Status Report: KEY ETF CHARTS:
The Openings' CP uptrend is intact. The CLosing Powers have not established a
clear trend.
DIA' s CP's IS
now above its CO down-trend-line A close 0.10 BELOW its opening would restore the
CP DOWNtrend. Opening
Power is rising.
SPY's CP RESTORED its
UPtrend-line. It would take a Close 0.85 Below the Opening to
VIOLATE the
CP UPtrendline.
QQQ's CP bullishly still above its UPTrendline.
It will take a close of more than 0.05 BELOW the
Opening to break the short-term CP UP-trendline.
Opening Power is rising.
GLD's CP steep DOWN-trendline
was broken.
it would take a close of more than 0.78 BELOW the Opening to
break the new CPUptrend-trendline.
The Opening Power is flat.
Narrative of Hotline
You can see below that the DJI has now rearched well-tested resistance. This invites
profit-taking. But so far, there are so signs of a reversal. Even though, the
DJI fell today,
there were 344 more up than down on the NYSE and the NASDAQ and SPY rose.
Look below at the Tiger of the chart of NASDAQ-100. It is on the verse of a flat
topped
breakout. It uses volume x price to weight stocks, rather than capitalization
as the QQQ does. By itself, a breakout here would be bullish, but we show a Peerless S15
and our
major market ETF charts show three factors which are usually bearish:
1) low volume recenlty on the rally.
2) red Distribution and
3) Falling Closing Powers.
See these in the Tiger chart of the QQQ below or DIA or SPY.
The stock market may continue to rally for the reasons mentioned here, but the potential
for a reversal now is also high. Accordingly, our Stocks's Hotline is about evenly
hedged,
long and short. Until we see a much clearer break-down by the CLosing Power, a break
in the Opening Power Uptrend and the NYSE A/D Line, I would respect the potential for the
DJI to breakout above the resistance line it has reached and thereafter run to 12800.
So,
I would not short DIA, SPY or QQQ.
The markets have shown great strength given the worsening Middle East situation. But
it will not be able to do this if fighting breaks out. Without the US President
acting as a
peace-maker, violence is likely to escalate into war there again. Remember that an
assassination started World War I.
"The
Strait of Hormuz is the greatest choke point in the world." NY Times.
In December, Iran warned the US and Europe that any embargo imposed on Iran's oil exports
as a way to rein in its nuclear program would get Iran to close the Sraits of Hormuz.
Today a
fourth Iranian nuclear scientist was assassinated. The US and Israel deny any hand
in the killing of the scientist. The US also denies that the sending of a second
aircraft carrier
group to the Arabian Sea is related to escalating tensions with Iran. If the CIA and
the Mossad
were involved, and they
are the logical suspects, the truth will come out and Iran will be
angrier, more vengence-minded and more determined than ever to be on an equal atomic
weapons' footing with Israel. Iran
will present its evidence against Israel in this to the United Nations.
The problem, as I see it, is that the US has put itself in the position of protecting the
Israeli right-wing Likud Party and its leader. These are the people who expand
|Jewish settlements
in formerly Arab lands and are trying to supress public protests about this. They
consider peace
with the Arabs unsafe and impossible. They are even being accuseed of turning Israel
into a dictatorship.
So much so, that the head of the Mossad resigned and called Netanyahu "reckless and irresponsible...
Netanyahu's decisions are driven by the same right-wing neocons that
drive the U.S."
Benjamin
Netanyahu 'turning Israel into a dictatorship' - Telegraph
Israel
government 'reckless and irresponsible' says ex-Mossad chief
Ex-Mossad
Chief: Radical-Right Jews More Dangerous than Iran

This situation seems likely to worsen and become still more dangerous. Whereas Pres
Carter
and Pres. Clinton could act as peace-makers and honest brokers, Obama is following Bush's
example of non-leadership in bringing about peace and choosing, as Bush did, to give
unconditional
backing to Israeli aggressions. The dynamics of this situation will probably,
therefore, spiral more and
more out of control. At some point, we will probably see a shutting off of the flow
of oil through the
Strait of Hormuz, which borders Iran. This would disrupt one third of the world's
oil tankers.
Dec/28. 2011 Iran
navy chief: Shutting off Gulf 'really easy' - At its narrowest, the strait is
34 miles wide. The oil traffic lane is 6 miles wide. 14 tankers carrying
15.5 million bar.
of crude oil pass through daily. It is the only sea passage for oil produced by Iraq
and
large parts of this region's oil. ( http://en.wikipedia.org/wiki/Strait_of_Hormuz
)

Tiger Index of NASDAQ-100
Note Flat top. We will watch this closely in the coming days.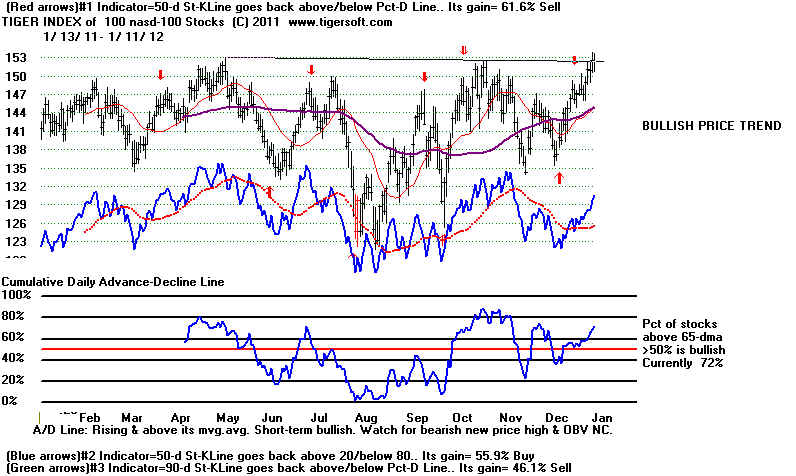 |
QQQ Tiger Chart with volume 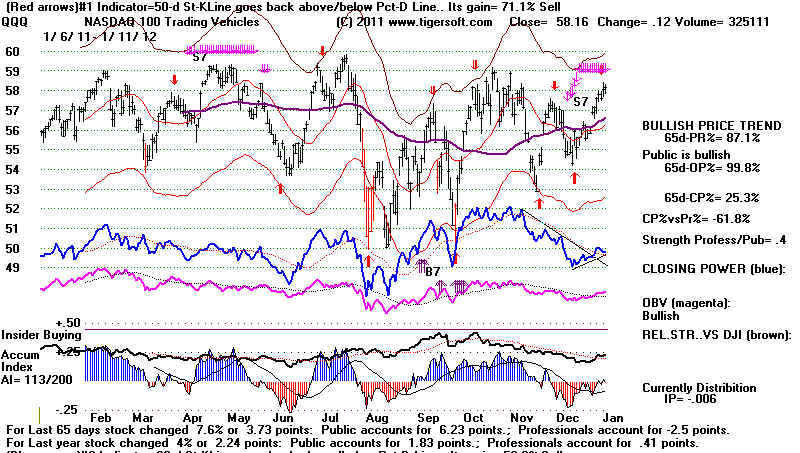 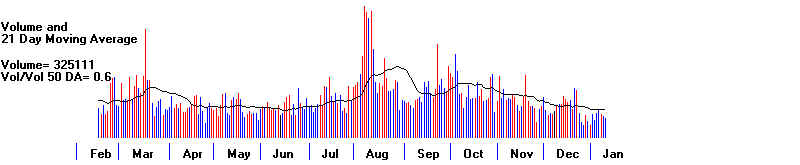 |
=====================================================================
OLDER HOTLINES
=====================================================================
1/10/2012
DJI = 12462 la/ma=1.024 21-dma ROC=.455 P= +362 +183- IP21= -.004 V= +30 OP= .0061/10/2012 ===> Closing Power (CP) Status Report: KEY ETF CHARTS:
DIA' s CP's
bearishly broke its short-term uptrend-line
A close 0.39 ABOVE its opening would restore the
short-term CP Uptrend. Opening Power is rising.
SPY's CP broke its UPtrend-line. It would take a
Close 0.63 ABOVE the Opening to restore the
CP UPtrendline.
QQQ's CP bullishly still above its UPTrendline.
It will take a close of more than 0.08 BELOW the Opening to break the short-term CP UP-trendline.
Opening Power is rising.
GLD's CP steep DOWN-trendline
was broken.
it would take a close of more than 0.78 BELOW the Opening to
break the new CPUptrend-trendline.
The Opening Power is flat.
Narrative of Hotline
DJI Threatens A New Breakout despite Sell
S9 and Sell S15. I would remain hedged: long Bullish
MAXCP stocks and short BEARISH MINCP
stocks. I would not yet go short the major market ETFs.
The SUPER STOCKS of 2011
are doing very well. Those making new highs with high AI/200 (>145)
or with an IP21>.23 are moving up
nicely, as hot money is concentrated in a smaller number of
high performance stocks. These are shown here.
A subscriber asked late today whether I
have done a study to show the returns of waiting for an A/D Line
trend-break to clinch Sells and Buys.
I have not quantified it. But it's clear that in the vast majority of
cases, taking the automatic signals is
best. But, not always. And it is when the Sells do not work out
that I am concerned about, to reduce
risk. The clearest cases are June 1987 and January 1999 (using
the pre-2007 software that did not take
into account the four year Presidential cycle.)
So why have I thought it best to delay
shorting the major market ETFs here until there was more evidence
of a true top? It is a matter of
judgement, to be sure. But here are the main reasons:
1) Technically, flat tops beckon for
breakouts. Professionals understand that if a new high is made
above a flat top, it will cause a great
deal of short covering and breakout buying. The DJI chart
above shows we have seen the first flat
resistance breakout. Now the DJI is just below the resistance
line of the second That is
why I have said the DJI might be able to achieve a nominal new high
above 12800 on this run.
2) Interest rates as low as we see now
are unprecedented. They support the market and keep the
NYSE A/D Line uptrending. When the
A/D Line is stronger than the DJI, as it is now, Sell S9s and
Sell S12s do not appear. In 1977,
2001 and 2002 we also saw better breadth than the DJI. In these cases,
the general market did not turn
down until there was a break in the A/D Line uptrend. There was
plenty of profit still to be had in short
sales by waiting for this.
3) The strength in the Dollar and the US
Stock market for the last year is attracting foreign capital.
This boosts defensive stocks and the
DJI-30 for a while.
4) The most important element in all this
is my sense that the triumverate (Obama-Big Wall Street Banks- Federal
Reserve) have been ARTIFICIALLY
boosting the market since March 2009. Low volume has been no problem
for them in all this. Why woud they
stop artifically boosting the market now that we are in a Presidential
Election Year when supporting the market
is essential in their maintenance of political power?
The rally has been artifically lifted
partly by Big Wall Street Banks' buying index futures before the opening
in NY and partly by a steady stream of
computerized buy orders and very limited short selling. Realize that
75% of all NY trades now are computer
driven from the Big Banks, especially Goldman Sachs. The Fed, for its
part, has provided a trillion
dollars in liquidity to the big banks with no strings and interest rates approaching
zero. Obama has taken Wall
Street off the hook for the Crash of 2008 and has not prosecuted Wall Street fraud,
demanded lower CEO pay or more investment
in the US and has even prevented enforecment of Administrative
Law forbidding mis-use of customer funds.
Wall Street has bought Obama. His populist rhetoric is empty and
used very cynically. In
return, the computerized traders from the big banks have avoided the short side for
most of the advance from March 2009,
despite the weak economy. All this is part of an unwriten agreement,
I contend, that holds together this
Financial Junta that runs America now. I have been posting Blogs about this
since March 2008. Now many others,
including Conservatives agree with this popuist interpretation of the
huge rise in stock prices despite Main
Street's high unemployment and growing pauperization. I
urge you to read
what
these Conservatuves
say, Some are even joining
the Occupy Wall Street movement.
 |
The Dirty Little Secrets of MF Global Bankruptcy. MF Global broke lots of regulations and rules on keeping customer money separate from its own trading accounts, and used some of its clients’ funds to invest in sovereign bonds issued by indebted European countries.When its leveraged bets lost, some customers like Koch Brothers and JP Morgan got advance word, before bankruptcy was declared. Ex-Goldman and Democrat Corzine lobbied the Democrat and ex Goldman Gary Gensler who ran the Commodities Regulation Board (CFTC) hard to weaken enforcement of rules protecting customers of MF Global customers. Source. Corzine-Gensler the Goldman Connection
|
I came across such a site today,
http://fellowshipofminds.wordpress.com/2011/11/23/why-the-collapse-of-mf-global-should-concern-you/
Now they know that they must keep lifting
the market if Obama is to be re-elected. They all have gambled
that a higher market will bring enough
extra spending by investors and boost business confidence enough to
increase the number of jobs in the
US. Only if millions of those who were unemployed in 2008-2009-2010
do get jobs or see better prospects will
Democratic voters actually turn out again and vote.
=====================================================================
OLDER HOTLINES
=====================================================================
1/9/2012
DJI = 12393 +33 la/ma=1.02 21-dma ROC=.193 P= +179 +30- IP21= -.036 V= -30 OP= -.0991/9/2012 ===>
Closing Power (CP) Status Report: KEY ETF CHARTS: SPY's CP broke its Downtrend-line. It would take a
Close 0.20 below the Opening to restore the
CP downtrendline.
QQQ's CP bullishly broke its DownTrending.yesterday.
It will take a close of more than 0.25 BELOW the Opening to break the short-term he CP UP-trendline.
Opening Power is rising.
GLD's CP steep DOWN-trendline
was broken.
it would take a close of more than 0.78 BELOW the Opening to
break the new CPUptrend-trendline.
The Opening Power is flat.
Narrative of Hotline
1/9/2012
Sell S15 and Sell S9 Versus Biotech
Breakouts.
We still have no clinching of the Sells using
the key general market CLosing Powers' Uptrend-Breaks
or a break in the rising NYSED A/D Line. But volume is
very low. A breaking of the A/D Line uptrend when
it is stronger than the DJI can bring a substantial decline:
1977, 2001 and 2002 are the best examples. So stay hedged,
but below are some biotech speculations to play on the
long side.
Today a biotech, INHX
(see chart below), that specializes in developing a drug to
fight hepatitis, jumped 140% on a buyout by BMY. In 2001, they paid top dollar
for Imclone just before the general market fell sharply Recall that VRUS, which
we recommended for long-term investors and a leader in developing new methods
to fight the world-wide scourge of hepatitis, was bought out two months ago at
a huge premium. Very often when one stock is bought out at a big premium,
others in the same industry become the objects of similar takeover bids. And
recall what I said about this being a narrow market, where hot-preformance money
is focused on a relatively small number of stocks and how, as a result, this environment
often brings stellar short-term gains to any stocks making new highs.
Today 18 biotechs rose more and 6% today. I consider only one of them, ACHN, to have
met our BUY standards for a current Accum. Index (IP21) value of greater
than .23.
BMRN is also consider a Buy because of
the flat topped breakout, AI/200>145 and
IP21>.22.
Growth Biotechs often top out last in a bull market and sometimes refuse even to decline.
Symbol
Name
Price Gain Today AI/200 IP21
Comments
--------------------------------------------------------------------------------------------------------------
INHX
Inhibitex
23.7 140%
133
-.08 Insiders knew of buyout.
IDIX
Idenix
9.66 37%
96
.06
ACHN
Achillon Pharm
9.72
22%
84
.23 High volume breakout BUY
HRT
Arryhythmia
3.84
14%
100
+ .27 very thin. Tax loss selling ended.
VVUS
Vivus
11.65 14%
58 -.10
TELK Telik
0.19 11%
17
-.11 Tax loss selling ended.
CBLI
Cleveland Bio 3.74
10%
70
.16 Tax loss selling ended.
ITMN
16.64 10%
100
-.20 Tax loss selling ended.
ZLCS
1.27 9%
72
-.05 Tax loss selling ended.
QCOR Questcor
42.14
8%
144 -.13 Rebound from 65dma
XOMA Xoma
1.39 8%
51
.02 Tax loss selling ended.
CGEN Compugen
5.49
7%
130
.13 5.75 is 12-mo high resistance.
DCTH Delcath
4.16 7%
52
.16 Tax loss selling ended.
MDVN
Medivation
52.8
7%
79
-.08 New High
DVAX Dynavax
3.52 6%
76
.25 New Closing High
ELN
Elan
13.88 6%
148
.17 Closing Power is lagging
JAZZ
Jazz Pharm
48.2 6%
129
.18
SPPI
Spectrum
15.5 6%
154
.18 Nice flat topped breakout BUY.
Also
ARIA
Ariad Pharm
13.79
1%
133
.05 New High
BMRN Biomarin
37.17 1%
172 .222
New High Breakout Buy
Highest IP21 (Current Accum) Biotechs
DJIA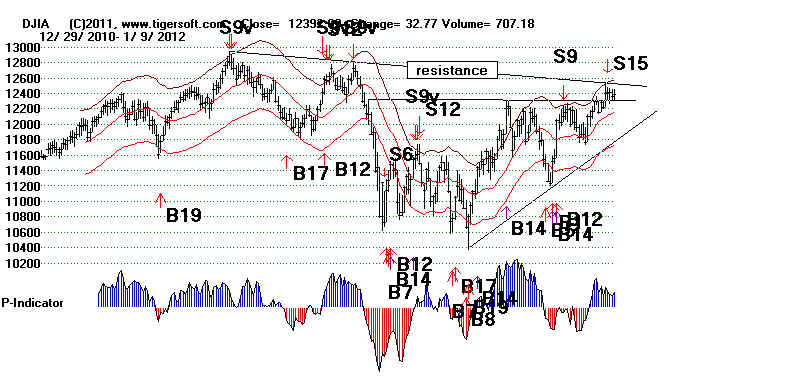 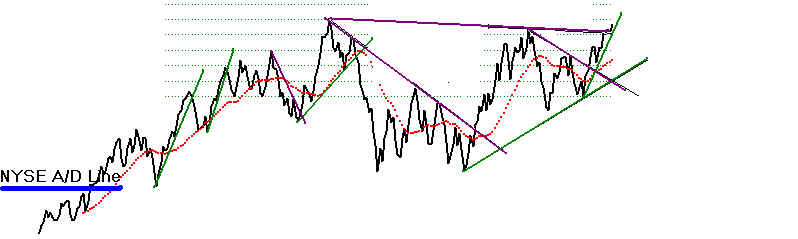  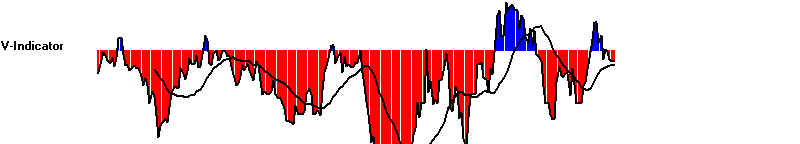  |
INHX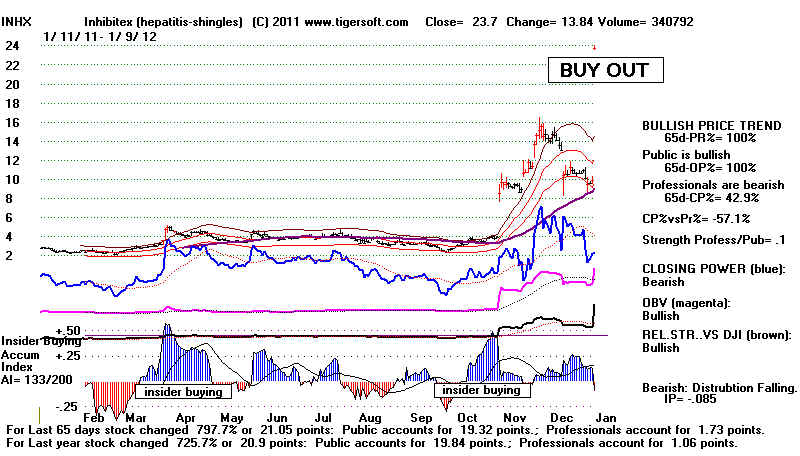 |
| Best Performing Stocks of
2011 that make new highs are objects of speculation by high-performance Growth Funds. Download SUPER11 from Tiger Data Page and run the ANALYZE/RANK from Peercomm. Then clicj Peercomm _ Charts-2011 + Tiger Selections + Tiger Groups + 22 New Highs. Tonight 7 stocks appear here: ACHN, GLNG, INHX, JAZZ, SIMO, SPPI and VRUS. If the I21 is over .22, any of these stocks usually goes much higher. Exceptional momentum nearly always attracts the high performance crowd. New Highs among Highest Performance Stocks of 2011 with an IP21 > .23 Symbol Price AI/200 IP21 200-day Performance ACHN 9.72 84 (low) .23 +167% SIMO 22.95 136 .26 +440% Because any of these stocks that makes a new high is apt to get addional buying on the new high, instead of looking for new highs, it pays to let Tiger's Power Ranker find you the stocks that are within 4% of their 12-month highs. This is the "ALMOSTNH" list produced by the Power Ranker. With this list I like to find the highest AI/200 stocks. LQDT shows an AI/200 score now of 194 and ALXN has an AI/200 score of 152 and an IP21 of +.15. Both should be bought on new highs, I think, though the Peerless Sells may limit their advances if the market weakens and falls to the lower band. 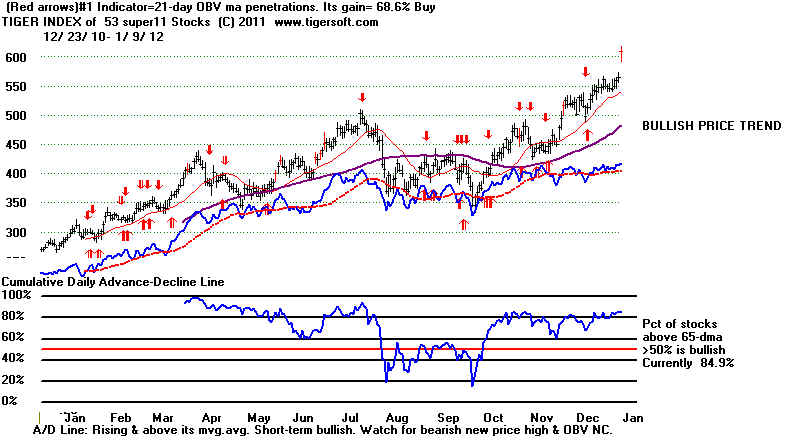 |
====================================================================================
OLDER HOTLINES
====================================================================================
Hotline
1/6/2012
DJI = 12360 -56 la/ma=1.018 21-dma ROC=.206 P= +162 (-14) IP21= -.022 V= -33 OP= -.0781/6/2012 ===>
Closing Power (CP) Status Report: KEY ETF CHARTS: SPY's CP broke its Downtrend-line. It would take a
Close 2.0 below the Opening to restore the
CP downtrendline.
QQQ's CP bullishly broke its DownTrending.yesterday.
It will take a close of more than 1.57 BELOW the Opening to break the short-term he CP UP-trendline.
Opening Power is rising.
GLD's CP steep DOWN-trendline
was broken.
it would take a close of more than 2.6 BELOW the Opening to
break the new CPUptrend-trendline.
The Opening Power is flat.
Narrative of Hotline
1/6/2012
Sell S15 Adds to Bearishness of Sell S9.
Will the DJI breakout on the low volume we now see
and overcome the
continuing (red) distribution shown by the
Tiger Accumulation Index?
The 2:1 bearish seasonality of the first ten
weeks of the 4-Year Pres. Election Year
argues against a valid breakout or an extended
advance until there is first a
first quarter pull-back. The market's ladership
is very defensive now. It's hard to find a
good long position showing bulging
Accumulation.
But a 3% additional DJI advance is still
possible. For that to happen
the Closing Powers of the general market ETFs
will need to establish new uptrends
and break decisively above their downtrends.
Right now, they seem to be deciding
which way to jump.
In additon, we would expect to see new strength
in one of more high priced
DJI-30 stocks. This is necessary because
the Dow Jones Ind. Avg is entirely
price weighted. A $100 stock has 3x the
weight of a $33 stock. The high priced
DJI stocks that might lead a rally do not look
strong enough now. But things
could change. If MSFT can rise 10%
in the last 4 days, perhaps IBM at 182
might, too. Presently, it tooks weak.
IBM - 182.54: Below its 65-dma, CP made a
10 week low and IP21= -.131
and is below is ma.
CVX - 108.31 - at 5x tested flat
resistance. This will need to breakout if
the DJI is going to make a good advance.
MCD - 100.6 - IP21= -.093 CP is in
downtrend.
XOM - 85.12 - IP21= -.025 ...88 will need
to be exceeded.
The best chance would seem to be if the
oil stocks CVX and XOM were to turn up.
It would seem that it will take a further
rise in oil prices and oil stocks, particularly
CVX and XOM, to propel the market
significantly higher. An increase in international
tensions between Israel and Iran is
certaintly a possibility. But working against
that would be a military withdrawl by the
US from Iraq and Afghanistan. The US
military currently consumes $60 billion
in oil a year.
The EURO's weakness is continuing.
It would seem that it is only a matter of
time before Greece must restore its own
national currency. If Greece reclaims its
control of Greek monetary and fiscal
policies, other countries may demand the same
powers, especially if the current
British-German-French and Brussels Deflationary
policies turn a Recession into a
Depression as they did in the 1930s. The weakness
in the EURO and foreign ETFs generally
suggest to me that the biggest threat
to the US markets is world-wide
Deflation. That need not bring a big decline in
US stocks, however, below the lower band
or immediately. The strong Dollar better
allows interest rates to be kept at very
low levels here, which in turn, props up all the dividend
plays and bond funds on the NYSE
The strong Dollar also invites foreign investing
in US stocks. Note that this also
helps explain the rising Opening Power we see.
WHAT TO DO
Increase the ratio of short sales to long
positions. But wait to go short SPY or
DIA until the minor Closing Power
uptrends are violated.
EURO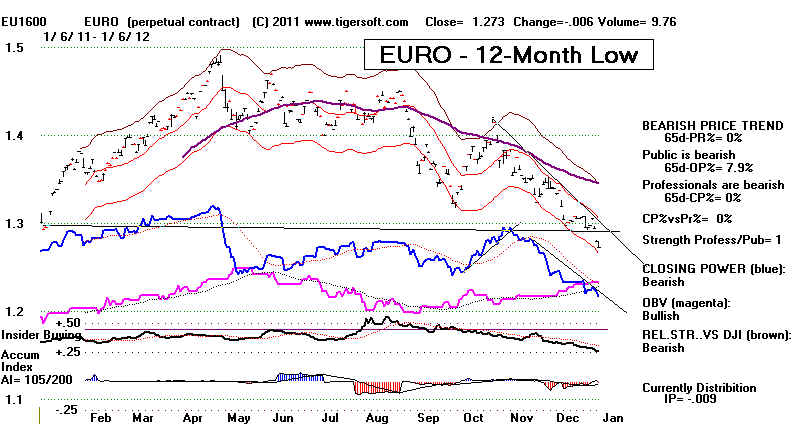 |
Foreign ETFS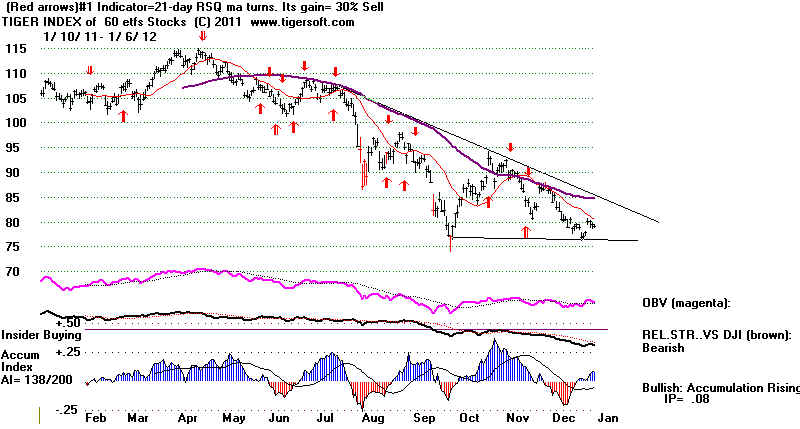 |
European SP-350 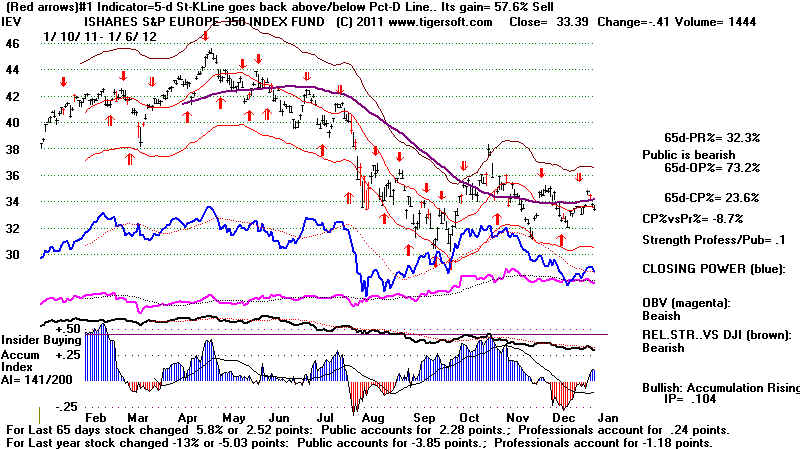 |
US DOLLAR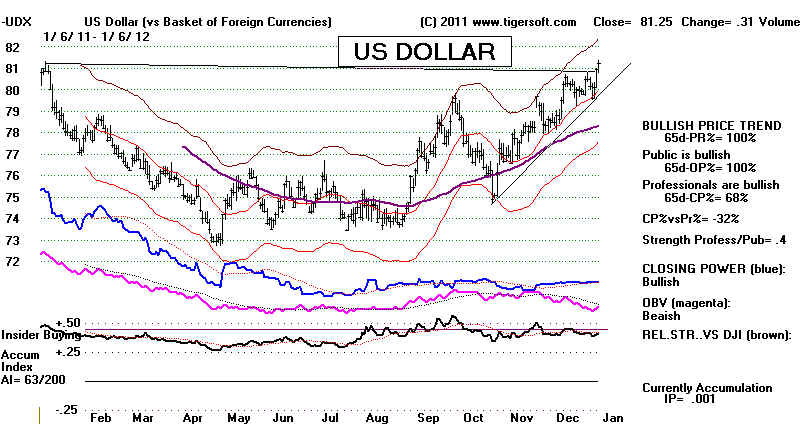 |
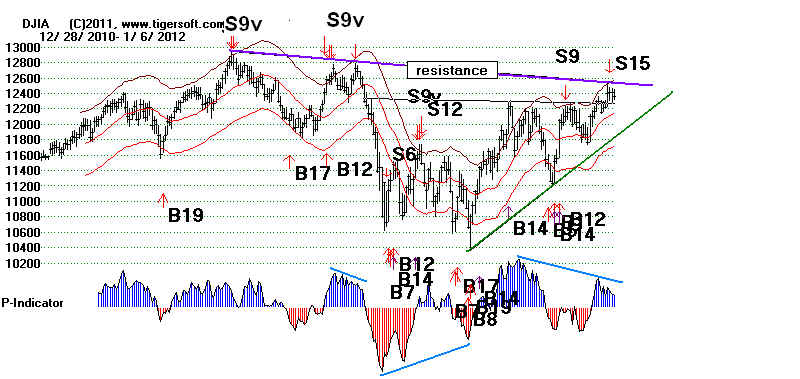
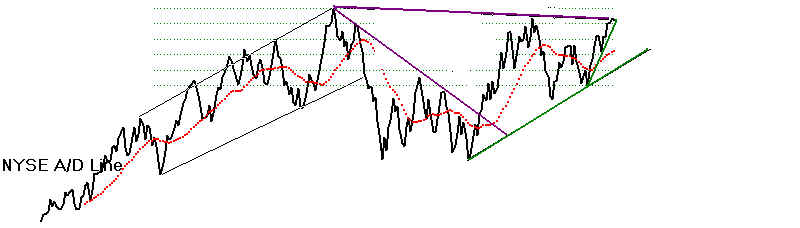


-----------------------------------------------------------------------------------
OLDER HOTLINES
-----------------------------------------------------------------------------------
1/5/2012 DJI = 12416 -3 la/ma=1.024 21-dma ROC=.312
P= +162 (-50) IP21= -.005 V= -26 OP= -.006
1/5/2011
BREADTH STATISTICS:
53 (+23) MAXCP stocks Bullish MAXCP Stocks
65 (-33) MINCP stocks Bearish MINCP Stocks Bearish.
MAXCP stocks are those showing
Tiger Closing Power making new highs.
This suggests heavy Professional Buying. Applying the Tiger Power Ranker's
"bullish" to the MAXCP stocks find those with heavy insider buying and
institutional accumulation. Bearish MINCP stocks show the opposite.
Also use the BOTHUPs condition with MAXCPs and BOTHDOWNS MINCPS.
21 new highs on NASDAQ. 10 new lows on NASDAQ Bullish.
58 new
highs NYSE 7 new lows on NYSE
Bullish.
1/5/2012 GRAPHS ===>
See Key Peerless TigerSoft Index Charts: Industry Groups and ETFs
DIA SPY QQQ
DJIA-Peerless TigerDJI TigerSPY
TigerQQQ GLD
SLV Crude
DJI and Peerless Signals/Internal Strength Indicators
A move back below 12200 would be a bearish false breakout.
1/5/2012 ===> Closing Power (CP) Status Report: KEY ETF CHARTS:
DIA' s
CP's bullishly broke its downtrend-line
A close 0.45 BELOW its opening would bearishly break the
short-term CP Uptrend. Opening Power is rising.
SPY's CP broke its Downtrend-line. It would take a Close 2.0
below the Opening to restore the
CP downtrendline.
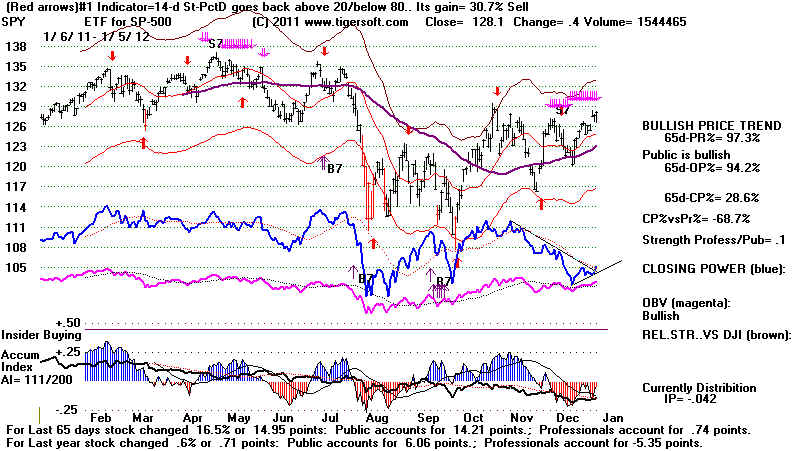
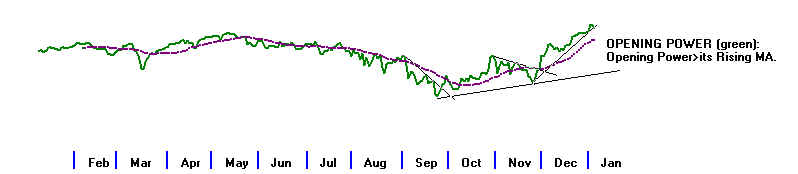
QQQ's CP bullishly broke its DownTrending.yesterday.
It will take a close of more than 1.57 BELOW the Opening to break the short-term he CP UP-trendline.
Opening Power is rising.
GLD's CP steep DOWN-trendline was broken.
it would take a close of more than 2.6 BELOW the Opening to
break the new CPUptrend-trendline.
The Opening Power is flat.
Narrative of Hotline
1/5/2012
Sell S15 Adds to Sell S9. But CP
Downtrend-Breaks
Suggest A Little More Strength. What is the OBAMA-FED
-Wall Street Triumverate up to?
Since World War II,
there were extensive rallies only 5 times in Januaries
of a Presidential Election year. That is 5 in 16 cases, or 31.3% of the time.
Two of these
ended by mid February. So, the upside would seem to be limited unless the
Obama Administration - Fed - Wall Street Junta pull out all the stops early
this year because of how dire the employment picture is for millions, They may
do that, out of panic! Obama still needs the many fast disillusioning DEM voters to
turn out and vote. Here are some links to consider. Murdoch's Fox is not the
most
trustworthy source of information. So read critically with all due cynicism:
January
Surprise: Is Obama Preparing a Trillion-Dollar Surprise.,
and White
House Denies $1 Trillion Mortgage Fix: Report
Usually, Presidents wait a few months before doing
what they can to boost
the stock market and the economy, That is the main reason, I think that there
are
a lot more cases where a Jan-Feb decline occurs in the Presidential Election years.
There were 10 cases of January declines, 2 instances where the the peak was in February
and 1 example of a December peak.
Most
Often - First Quarter Declines (red) in Presidential Election Year
1948  1/2/1948 peak 181.00 and decline to 165.70 on 2/10
1952  1/21/1952   peak 274.10 and decline to 258.50  2/20/1952
1956  1/3/1956   peak 500.5 and decline to 465.70 on 2/14/1956
1960  1/4/1960   peak 679.10 and decline to 599.10 on 3/8/1960
1964   RALLY no decline

1968  1/8/1968   peak 908.92 and decline to 826.13 on 3/21/1968
1972  1/12/1972   peak 910.82 and decline to 899.15 on 1/26/1972 (Shallow)
1976  RALLY no decline
1980  RALLY until Feb peak 2/13/1980 and then 16% sell-off
1984  1/9/1984   peak 1286.22 and decline to 1134.21 on 2/22/1984

1988  1/6/1988   peak 2037.80 and decline to 1879.14 on 1/20/1988
1992  RALLY no decline.
1996  1/4/1996 peak 5173.84 and decline to 5032.94 on 1/10/1996 (Very shallow)
2000  1/14/2000 peak 11722.98 and decline to 5856.53 on 3/8/2000
2004  no Jan peak but Feb peak. 2/11/2004 10737.70 and decline to 10063.64 on 3/23/2004

2008  no Jan peak. Decline to 11971.19 on 1/22/2008
WAIT BEFORE SHORTING
The breaking of the Closing Power downtrends should boost the
market a little longer.
I suggested a night ago waiting to see what today's close would bring before adding to
shorts or
shorting SPY. Since the close was above the opening in NY, we should still be
hedged,
rather than in a bearish position. We probably should now wait for the minor CP
uptrend to be broken before considering the Sells "clinched" and going short SPY
and more bearish
MINCP stocks.
A NEW TRILLION DOLLAR STIMULUS
New year optimism is helping lift the NASDAQ a
little now. But the upside is probably
limited, unless Obama and the Fed announce important new stimulus programs, especially
in construction and home-building. Home Building stocks have definitely turned up.
While finance stocks generally are in doubt. Big banks have heard something they
like
from the Wall Street-Fed-Obama junta that they back.
7 BIG BANKS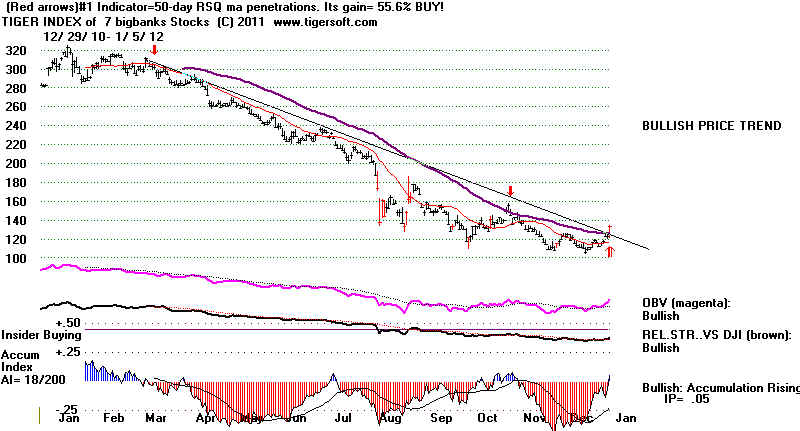 |
HOME_BUILDING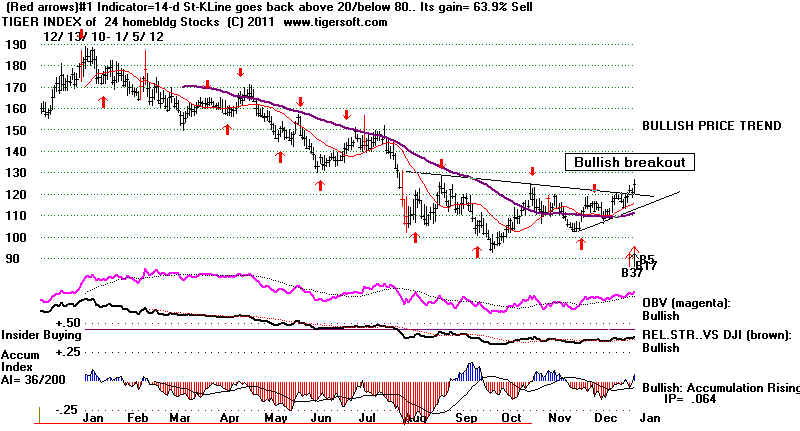 |
|
WHERE REAL POWER NOW LIES IN THE US New readers of our Hotline may wish to see the many Tiger Blogs I have written on the subject of the Wall Street - Obama - Fed Reserve Triumvirate. "AXIS", "CABAL" or "FINANCIAL JUNTA" also describe this secret power elite. Secrecy is needed to avoid public accountability.  3/18/2009 TigerSoft Blog: Obama Coddles Wall Street Crooks 9/17/2009 TigerSoft Blog The Secret Deal Obama, The Fed and Wall Street Have Reached 4/4/2010 TigerSoft Blog Wall Street's Dirty Little Secret - Why The Market Keeps Rising http://www.tigersoftware.com/TigerBlogs/April-9-2010/Index.html |
   S15, P-NC of NH, rising A/D Line, AI NC, VI-NNC, low volume
   DIA - Day Traders still prefer Selling the opening.
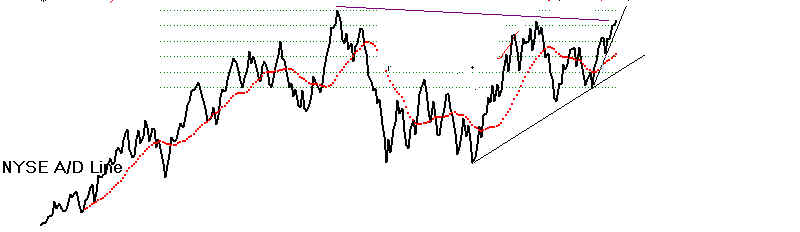
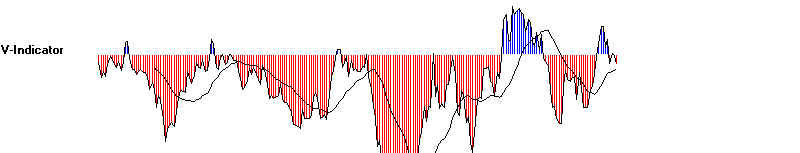
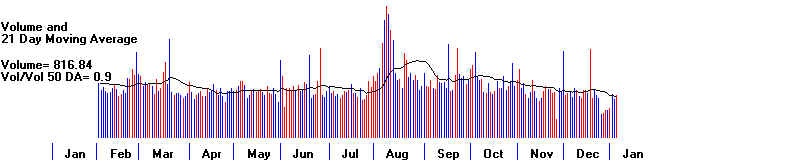
Day Traders Are Still Selling
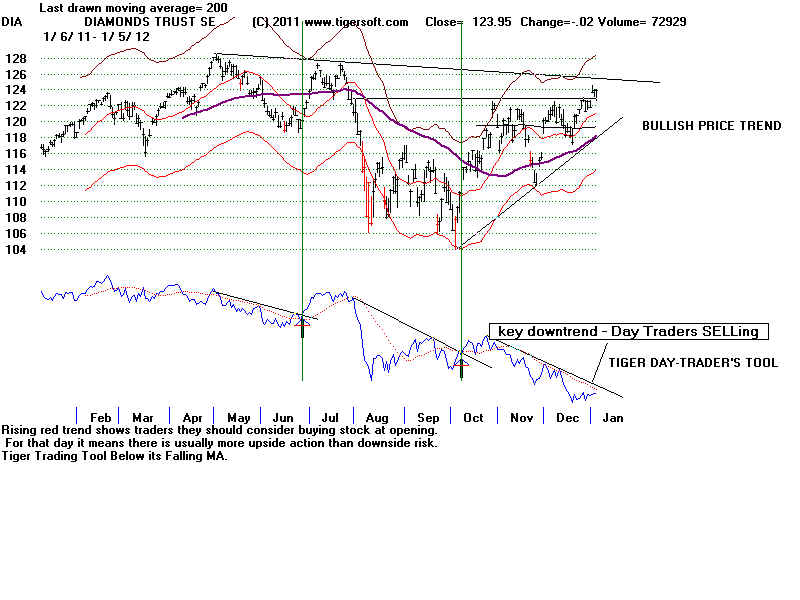
-----------------------------------------------------------------------------------
OLDER HOTLINES
-----------------------------------------------------------------------------------
1/4/2012 DJI = 12418.42 la/ma=1.025 21-dma ROC=.393
P= +211 (-35) IP21=
-.045 V= -4 OP=
.10
1/4/2011 BREADTH STATISTICS:
30 (+5) MAXCP stocks Bullish MAXCP Stocks
98 (+13) MINCP stocks Bearish MINCP Stocks Bearish.
MAXCP stocks are those showing
Tiger Closing Power making new highs.
This suggests heavy Professional Buying. Applying the Tiger Power Ranker's
"bullish" to the MAXCP stocks find those with heavy insider buying and
institutional accumulation. Bearish MINCP stocks show the opposite.
Also use the BOTHUPs condition with MAXCPs and BOTHDOWNS MINCPS.
10 new highs on NASDAQ. 16 new lows on NASDAQ Bearish.
45 new
highs NYSE 7 new lows on NYSE
Bullish.
1/4/2012 GRAPHS ===>
See Key Peerless TigerSoft Index Charts: Industry Groups and ETFs
DIA SPY QQQ
DJIA-Peerless TigerDJI TigerSPY
TigerQQQ GLD
SLV Crude
DJI and Peerless Signals/Internal Strength Indicators
A move back below 12200 would be a bearish false breakout.
1/4/2012 ===> Closing
Power (CP) Status Report: KEY ETF
CHARTS:
DIA' s CP's is at
its downtrend-line A close ABOVE
its opening would bullishly break the
longer-term CP downtrend. Opening Power is rising.
SPY's CP is at its DOWNtrend-line. A close ABOVE the
Opening will break the CP longer-term DOWN-trendline.
Its Opening Power is uptrending.
QQQ's CP bullishly broke its DownTrending.yesterday.
It will take a close of more than 0.81 BELOW the Opening to restore the CP DOWN-trendline.
Opening Power is rising.
GLD's
CP steep DOWN-trendline was broken.
it would take a close of more than 0.75 BELOW the Opening
to break the new CPUptrend-trendline.
The Opening Power is flat.
Narrative of Hotline
1/4/2012
New Sell S15 Adds to Sell S9.
The DJI's Partial Breakout Today Saw Only A Narrow Advance.
The Peerless S15 occurs when the DJI
reaches the upper band
with good momentum but with Down Stock Volume so high that
the V-Indicator is is negative territory and the Accumulation
Index also shows weakness. It is an unusually reliable
signal. In 11 previous occurrences, there were only two
small paper losses.
There were 46 more down than up on the NYSE
as the DJI made another marginal recovery high.
WHAT TO DO
The Sell S15 should get us to add to our short positions
from among the bearish MINCP stocks and reduce long positions
provided the Closing Powers turn down tomorrow. If SPY's CP
does turn down, I would go short SPY because of the reliability
of the Sell S12. But wait until the close tomorrow. SPY's Closing Power
could on a strong close break above its downtrend. That would
be short-term bullish. A breaking of the NY A/D Line uptrend
would also serve to clinch the Sell S15 if you wish to wait for
more evidence of a reversal..
| S15s in Year of The Presidential Election Years
Next Reversing Sell Signal date dji la/ma ann roc. P-I P ch AI V-I OPct Date DJ Gain Signal 2/18/36 153.4 1.029 .608 57 17 .016 -28 .18 5/5/36 148.6 +3.1.% B2 3% Paper Loss 4/1/36 158.9 1.018 .206 -40 4 -.097 -265 .207 5/5/36 148.6 +6.5.% B2 No Paper loss 1/15/60 685.5 1.018 .40 4 6 -.038 -186 .089 2/11/60 618.60 +9.8% B17 No Paper loss 4/6/72 959.44 1.02 .159 -70 15 .036 -1 .086 7/18/72 911.72 +5.0% B2 No Paper loss 5/25/72 969.07 1.025 .279 -10 14 .004 -1 .225 7/18/72 911.72 +5.9% B2 No Paper loss 3/24/76 1009.21 1.024 .192 -64 10 -.033 -1 .293 10/5/76 966.76 +4.2% B2 No Paper loss. 4/21/76 1011.02 1.019 .345 -1 15 .038 -1 .07 10/5/76 966.76 +4.4% B2 No Paper loss. 2/13/80 903.84 1.028 .478 -26 1 -.01 -1 .206 3/28/80 966.76 +14.% B19 No paper loss 4/14/92 3306.13 1.017 .256 -59 40 .033 -10 .231 8/21/92 3254.10 +1.6% B2 1% paper loss 1/7/2000 11522.56 1.021 .48 -23 103 -.028 -59 .341 2/4/2000 3254.10 +4.8% B17 No paper loss 2/11/2004 10737.70 1.017 .285 246 22 .093 -6 .136 5/18/04 9968.51 +7.2% B2 No paper loss 5/1/2008 13040 1.029 .405 174 34 .047 -28 .076 7/8/08 11384.21 +12.7% B2 No paper loss N=11 AVG. = +7.0% |
-----------------------------------------------------------------------------------
OLDER HOTLINES
-----------------------------------------------------------------------------------
1/3/2012 DJI = 12397.38 la/ma=1.025 21-dma ROC=.372
P= +246 (+109) IP21= -.09
V= +1 OP= .01
1/3/2011 BREADTH STATISTICS:
25 (-7) MAXCP stocks Bullish MAXCP Stocks
85 (+23) MINCP stocks Bearish MINCP Stocks Bearish.
MAXCP stocks are those showing
Tiger Closing Power making new highs.
This suggests heavy Professional Buying. Applying the Tiger Power Ranker's
"bullish" to the MAXCP stocks find those with heavy insider buying and
institutional accumulation. Bearish MINCP stocks show the opposite.
Also use the BOTHUPs condition with MAXCPs and BOTHDOWNS MINCPS.
8 new highs on NASDAQ. 18 new lows on NASDAQ Bearish.
56 new
highs NYSE 6 new lows on NYSE
Bullish.
1/3/2012 GRAPHS ===>
See Key Peerless TigerSoft Index Charts: Industry Groups and ETFs
Most groups still have a plurality of stocks below their 65-dma. Defensive groups are still favored. BEARISH
DIA SPY QQQ
DJIA-Peerless TigerDJI TigerSPY
TigerQQQ GLD
SLV Crude
DJI and Peerless Signals/Internal Strength Indicators
A move back below 12200 would be a bearish false breakout.
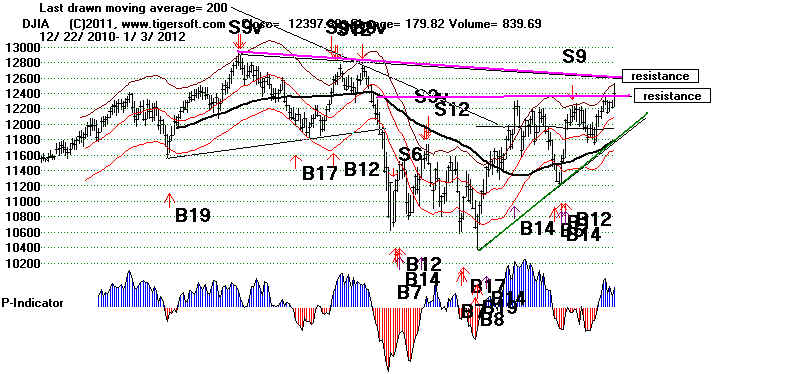
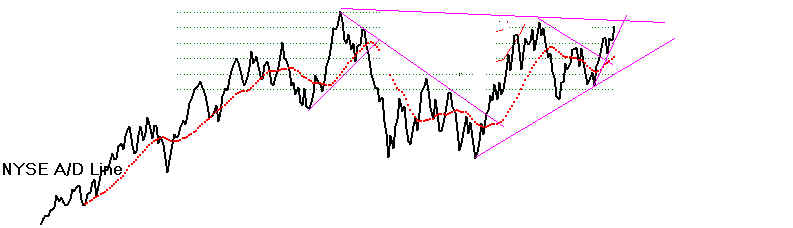
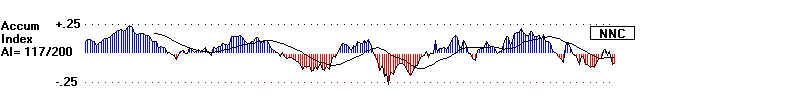
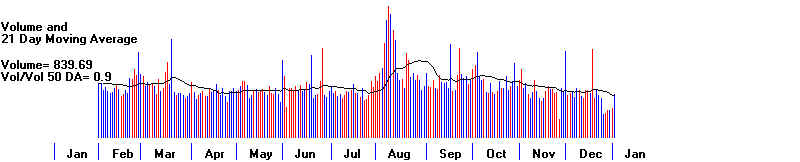
1/3/2012 ===>
Closing Power (CP) Status Report: KEY ETF CHARTS:
DIA' s
CP's is downtrending. A close 0.83ABOVE its
opening would bullishly break the
longer-term CP downtrend. Opening Power is rising.
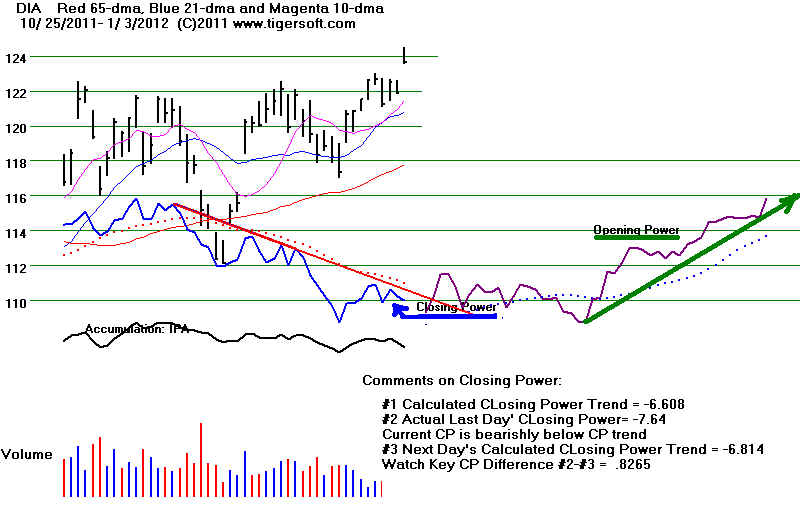
SPY's CP is
DOWNtrending. It will
take a close of more than 0.12
ABOVE the
Opening to break the CP longer-term DOWN-trendline. QQQ's CP bullishly broke its DownTrending. It will take a close of more than 0.32 BELOW the
Opening to restore the CP DOWN-trendline.
GLD's
CP steep DOWN-trendline was broken.
it would take a close of more than 4.10 BELOW the Opening
to restore the CP DOWN-trendline.
The Opening Power is short-term
rising.
Narrative of Hotline
1/3/2012
Sell S9. The
Partial Breakout Today
Does Not Over-Ride the Sell. We should
stay hedged. A DJI decline now back below
12200 would be bearish.
A further breakout could still
bring the DJI up to 12800.
When the P-Indicator turns clearly positive and the
NYSE A/D Line confirms the new highs, aa now, an additional
2%-3% rally typically occurs. A Closing Power break
in the CP downtrends will be needed for that.
Today's rally did bring the DJI's close
slightly above its
lower flat resistance line. Breakouts above well-tested and
flat resistance going back more than 40 days still must be respected
even without a Peerless Buy. The NYSE A/D Line moved up
an impressive +1655 today. It has risen to its flat resistance
line running through its June and November 2011 peaks.
See the DJI chart below.
Closes above the openings for DIA, SPY and QQQ tomorrow will probably break
these key ETFs' CP downtrends. This would be a victory for Opening
Power. Usually Closing Powers win. But when Professionals are wrong,
they are not stubborn. They adapt and play the momentum and the path
of least resistance
The biggest technical problem the DJI has now is
the negative Accumulation Index readings. This shows that the
institutional selling on strength has not yet been overcome.
Negative readings from the Accum. Index are common as a stock
or an index rallies back into overhead supply on low volume, as now.
That overhead supply may still be overcome.
I think we have to give the market still more chance to
rally despite the operative Sell S9. Stay hedged, but
watch the short sales. If the CLosing Power for a short
sale breaks its downtrend or the stock closes clearly
over the 21-dma, I would cover it, because of how Januaries
frequently lift the most defeated stocks of the previous years.
The documentation on the Sell S9 is being re-written. I will
work on it some more tomorrow. See Sell S9 and Buy
B10
Tiger Day Traders' Tool
Day traders have been heavily and
successfullly shorting the SPY after the Opening.
We see this in the Tiger Day Traders' Tool. It measures whether there is greater
intra-day risk (downside) or reward (upside) after the Opening.
When it is declining, as now, it means that the market
has shown much more risk, i.e. that the distance from the opening to the low for the day
is much greater than from the opening to the high for the day (i).
(Opening(i)-Low(i)) > (High(i)-Opening(i)
It is not necessarily bearish when the Tiger
Day Tragers' Tool lags the
stock or ETF, as now. Look at the second chart below, the SPY in 1996.
Breaks in long downtrend-lines are big boosters to prices. We should
start watching the Day Traders' Tool's downtrend more and more and
know that a break in it will be bullish for the market. I will provide a link
here soon to SPY and Tiger Closing Power charts since 1994.
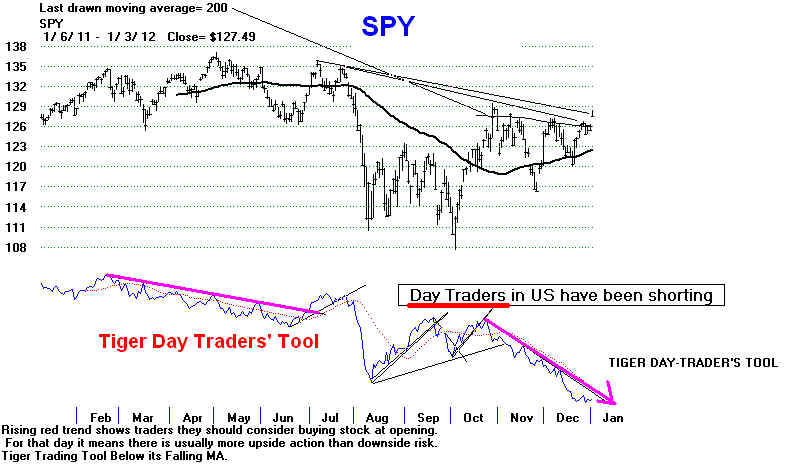
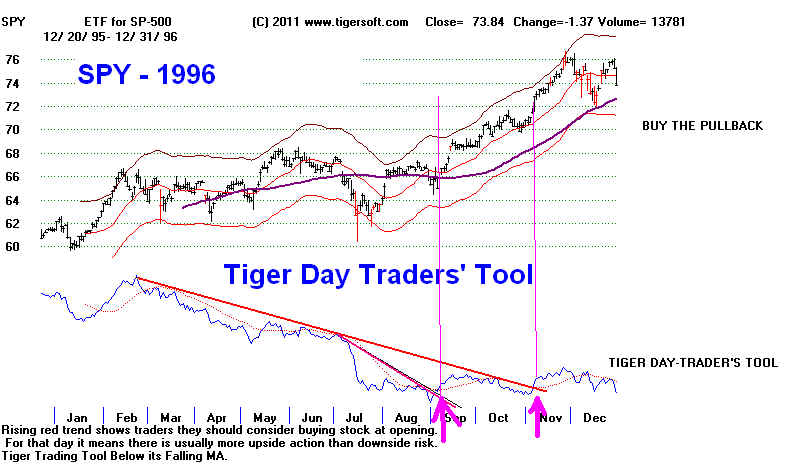
-----------------------------------------------------------------------------------
OLDER HOTLINES
-----------------------------------------------------------------------------------
12/30/11 DJI = 12218 -69 la/ma=1.012 21-dma ROC=.17
P= +136 (-118) IP21= -.096
V=-28 OP=.086
12/30/2011 BREADTH STATISTICS:
32 (-10) MAXCP stocks Bullish MAXCP Stocks
62 (-48) MINCP stocks Bearish MINCP Stocks Bearish.
MAXCP stocks are those showing
Tiger Closing Power making new highs.
This suggests heavy Professional Buying. Applying the Tiger Power Ranker's
"bullish" to the MAXCP stocks find those with heavy insider buying and
institutional accumulation. Bearish MINCP stocks show the opposite.
Also use the BOTHUPs condition with MAXCPs and BOTHDOWNS MINCPS.
8 new highs on NASDAQ. 18 new lows on NASDAQ Bearish.
56 new
highs NYSE 6 new lows on NYSE
Bullish.
12/30//2011 GRAPHS ===>
See Key Peerless TigerSoft Index Charts: Industry Groups and ETFs
Most groups still have a plurality of stocks below their 65-dma. Defensive groups are still favored. BEARISH
DIA SPY QQQ
DJIA-Peerless TigerDJI TigerSPY
TigerQQQ GLD
SLV Crude
DJI and Peerless Signals/Internal Strength Indicators
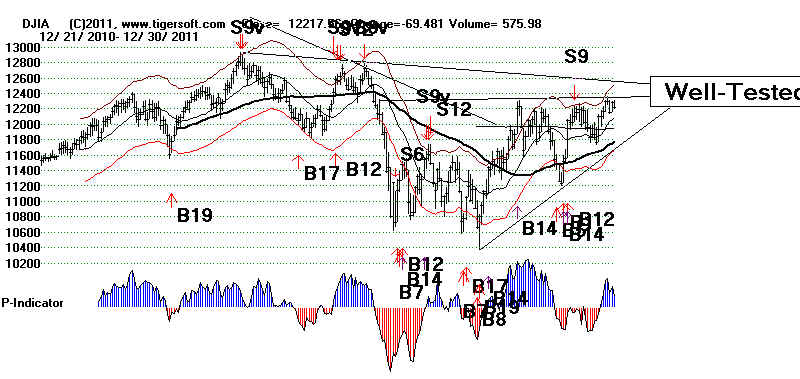
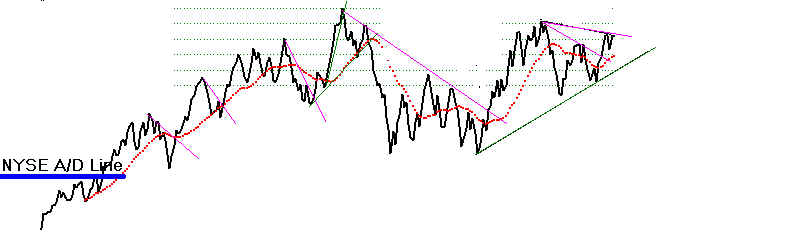
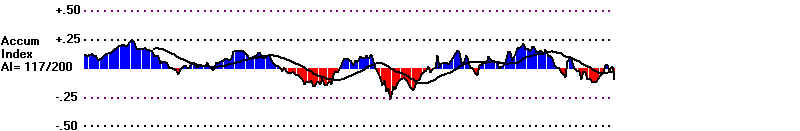
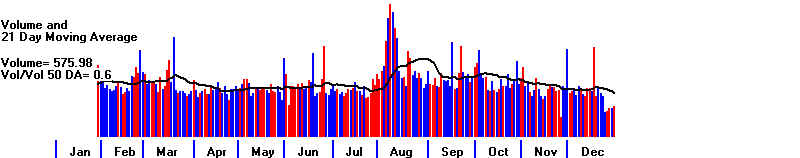
12/29/2001 ===>
Closing Power (CP) Status Report: KEY ETF CHARTS:
DIA' s
CP's is downtrending. A close 0.70 ABOVE its opening would bullishly break the
longer-term CP downtrend. Opening Power is rising.
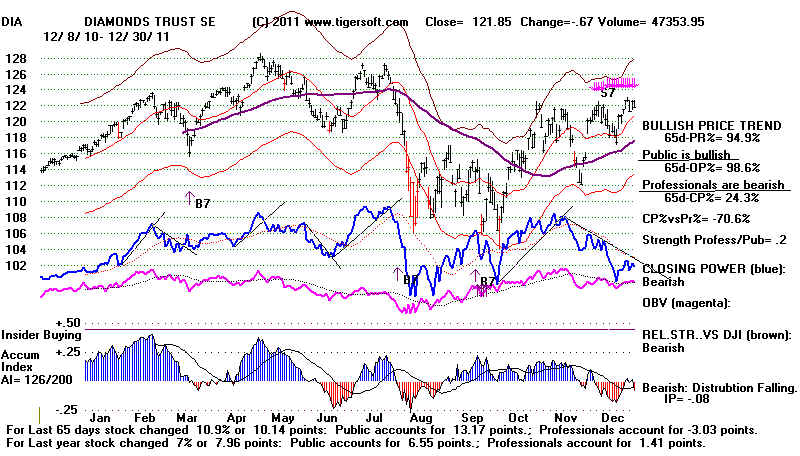
(Commands: Tiger + Peerless + DIA + Indic-3 +
Tiger Basis of Moves )
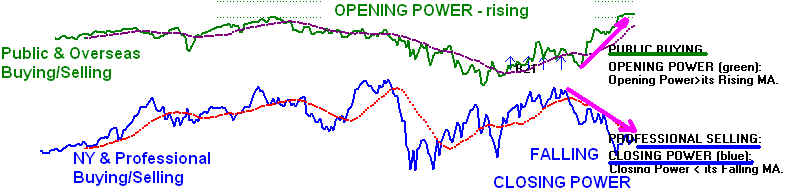
SPY's CP is DOWNtrending. It will take a close of more than 0.27 ABOVE the
Opening to break the CP longer-term DOWN-trendline.
QQQ's CP is DownTrending. It will take a close of more than 0.17 ABOVE the
Opening to break the CP longer-term DOWN-trendline.
GLD's
CP is far below its DOWN-trendline
it would take a close of more than 6.37 ABOVE the
Opening to break the CP DOWN-trendline.
The Opening Power is short-term
fallng.
Narrative of Hotline
12/29/11
Sell S9. Will
there be a Buy B10 Breakout?
Our Stocks'
Hotline has about the same number of long as short
positions. We are waiting to see which
the DJI moves from its high inflection point.
It could either breakout and advance to 12800
or fall back to the lower band
at 11700. While the NYSED A/D Line has
been strong enough to support higher
prices, the negative Accumulation reflects
heavy institutional selling on strength.
Volume usually expands sharply in the new year.
We must watch now whether
a breakout rally is attempted by Professionals
bolstered by the Fed and
Obama Administration, as they seek to prevent a
big drop in the election year,
as happened in 2008.
This is a very defensive market. This is apt to
continue. It often happens in the
late stages of a bull market. To a large extent
the rally has been
driven by high cap dividend stocks being bought by
money from
overseas. We see the overseas' influence by the
rising Opening
Powers and the falling Closing Powers looking at DIA, SPY and QQQ.
Usually Closing Power wins out. The strongest industry groups are now
high priced REITs, Bond Funds, Utilites and the blue chip DJI-30
stocks.
VZ, a virtual utility stock, is the highest AI/200
stock in the DJI. Speculative
stocks, by contrast, are relatively weak. There
are more NASDAQ new lows
than new highs despite the fact that the DJI is less
than 5% from its 12-month high.
Big capitalization stocks are sought by fund managers
now, mainly because
they are easier to unload, if they decide to sell.
If you were a Professional trader trying to make money, what
would you do? If it were
me, I would try to run-in some shorts
and force some some short-sale profit-taking. With the new year
comes public optimism. I have mentioned that
many of the most
depressed stocks were until Jan. 1 under serious
pressure from tax-loss selling.
That pressure comes off in the new year.
So, If I were a Professional now, I would try to get
the public to buy stocks
on a rally where prices look very cheap. What
better way to do this than to rig a
short-lived DJI breakout above 12350 and a nominal
new high
near 12800. Buying the highest priced DJI-30 stocks, ike IBM (185.07),
CVX (106.40), MCD (100.33), CAT (84.76) and XOM
(84.76) would have
the most effect in driving up prices, because the DJI is weighted by
price only. The highest AI/200 stocks among
these are CVX and IBM.
MCD shows red distribution because of the selling at
the round number 100,
as much as anything. War-mongering about Iran
is in political season now,
as politicians talk "tough". Oil
supplies are made to seem vulnerable.
Yahoo headlines like Iran warns U.S. aircraft carrier not to return are bound to
boost CVX and XOM.
A January Breakout Would Serve To Run-in Many
Shorts. So, we
should be ready to close out any MINCP stocks if
they break their CP
downtrends. Even closing any shorts if they
close much above
the 21-day ma is suggested if the market starts to
rally next
week on increased volume. I do not expect to
see a Peerless
Buy immediately ahead.
A Peerless Buy B10 breakout needs a well-tested, flat
resistance
level like we see at 12350. In addition, the
P-Indicator and the
Accumulation Index must be more than minimally positive.
The
AI (also known as IP21) is very negative now, - .096.
A
short-term breakout rally like the one which occurred in January
2010 with a Sell S9 still operating shows how agile we may have to be.
DJI - False
Breakout in January 2010. This seems a likely scenario now.
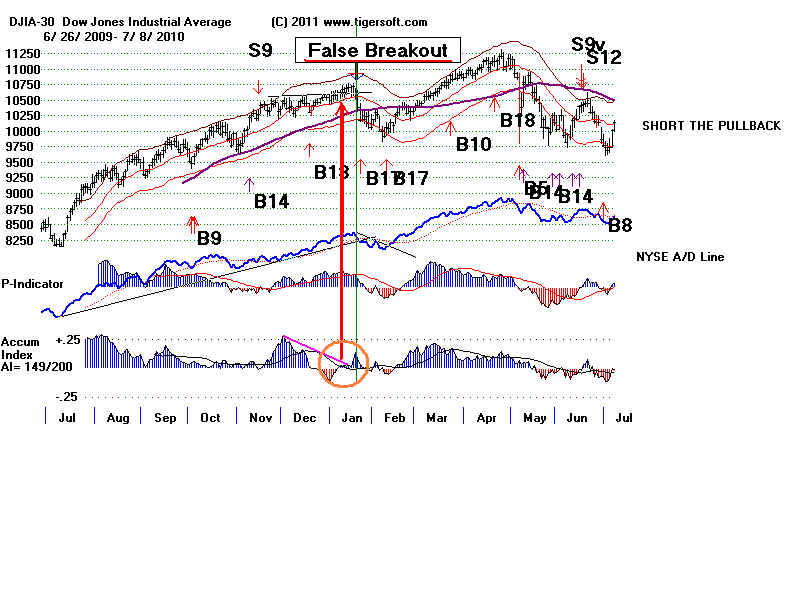
CVX 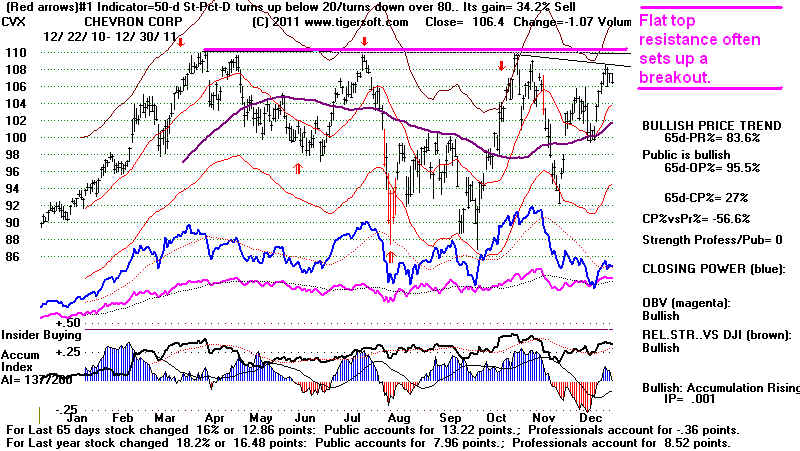 |
| IBM AT SUPPORT OF RISING 65-DMA
|
MCD.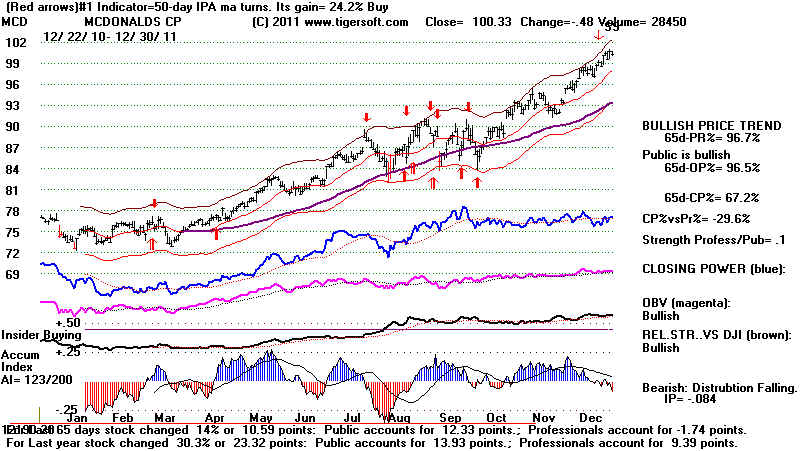 |
.
-----------------------------------------------------------------------------------
OLDER HOTLINES
-----------------------------------------------------------------------------------
12/29/11 DJI = 12287 +136 la/ma=1.018 21-dma
ROC=.724 P= +253 (+86) IP21= .011 V=+41 OP=.042
12/29/2011 BREADTH STATISTICS:
42 +9 MAXCP stocks Bullish MAXCP Stocks
110
-75 MINCP stocks Bearish MINCP Stocks Bearish.
MAXCP stocks are those showing
Tiger Closing Power making new highs.
This suggests heavy Professional Buying. Applying the Tiger Power Ranker's
"bullish" to the MAXCP stocks find those with heavy insider buying and
institutional accumulation. Bearish MINCP stocks show the opposite.
Also use the BOTHUPs condition with MAXCPs and BOTHDOWNS MINCPS.
24 new highs on NASDAQ. 35 new lows on NASDAQ Bearish.
61 new
highs NYSE 11 new lows on NYSE
Bullish.
12/29//2011 GRAPHS ===>
See Key Peerless TigerSoft Index Charts: Industry Groups and ETFs
Most groups still have a plurality of stocks below their 65-dma. Defensive groups are still favored. BEARISH
DIA SPY QQQ
DJIA-Peerless TigerDJI TigerSPY
TigerQQQ GLD
SLV Crude
12/29/2001 ===> Closing Power (CP) Status Report: KEY ETF CHARTS:
DIA' s
CP's is downtrending. A close 0.42 ABOVE its opening would bullishly break the
longer-term CP downtrend.
SPY's CP is DOWNtrending. It will take a close of more than 0.07 ABOVE the
Opening to break the CP longer-term DOWN-trendline.
QQQ's CP is DownTrending. It will take a close of more than 0.04 ABOVE the
Opening to break the CP longer-term DOWN-trendline.
GLD's
CP is far below its DOWN-trendline
it would take a close of more than 6.61 ABOVE the
Opening to break the CP DOWN-trendline.
The Opening Power is short-term
fallng.
12/29/11 Sell S9. Will there be a Buy B10
Breakout?
The DJI needs to close
about 100 points higher to
break above its flat well-tested resistance for a breakout.
Even with that, it would not be confirmed by the NASDAQ or
SPY making corresponding new highs; volume is low and so
casts
doubts on any breakout, In addition, the current AI (IP21)
value
is not very positive. There is still a lot of selling
into this rally.
So, a move up could be a false breakout. Accordingly,
I would short
more of bearish MINCP stocks until we can see which way it
will move
from this high inflection point.
This is still a very defensive rally.
The earlier P-Indicator readings on B10 when adjusted are
higher than now,
for the most part. See the tables I am working on for
previous B10s
below
The other element here is tax-loss selling. The
weakest stocks
will probably be weak another day. Next year when the
tax selling pressure
come soff, they could rally. That will put a premium
on watching the
Closing Power downtrend-lines. When they are broken
it will probably
be best t cover shorts in that stock.
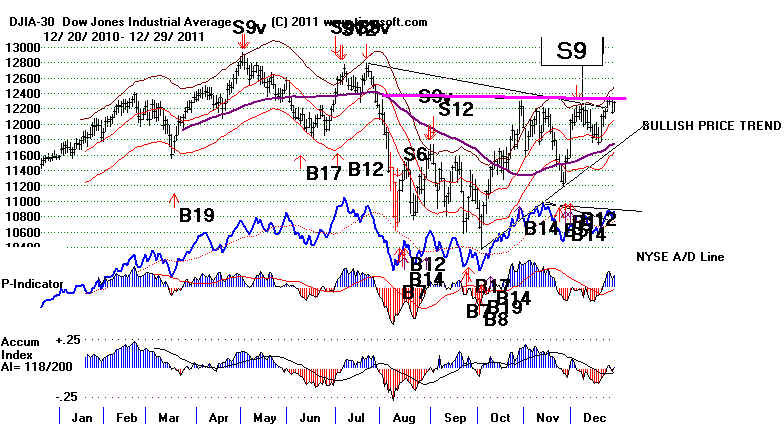
Until January 15th, with a Peerless Sell signal operating,
the odds are 7:1, based on past cases, that the DJI will
not rise significantly and instead turn down. The current
Accumulation (IP21) is only slightly above 0. This is too
negative for a Buy B10.
When we consider the B10s
since 1942, we can compare
the valid B10s' P-I, IP21 OPct levels with their levels
currently: P-I = +253, IP21 = +.011 OPct
= +.04. Automatic B10s
require an IP21 of at least +.06.
I have
programmed an Adjusted P-I (P^^). This allows for
much greater number of stocks traded on the NYSE now.
Older P-I values are multiplied by a factor that adjusted the P-I
score
for the changing advances and declines from year to year.
Thus, a P-I reading of 100 in 1929 would be adjusted to 431.
The Peerless Software does not yet make use of this methodology,
but it should allow us to make comparisons over time more
accurately.
Here are is the P-Factor by year:
1929 4.31 1930
5.01 1931 5.66
1932 7.08 1933 7.28
1934 5.53
1935 5.59 1936
4.43 1937 4.45
1938 5.28 1939 4.61
1940 5.01
1941 5.34 1942
5.07 1943 5.06
1944 5.34 1945 4.52
1946 3.90
1947 4.17 1948
4.26 1949 3.91
1950 3.62 1951 3.04
1952 3.70
1953 3.45 1954
3.36 1955 2.87
1956 3.18 1957 3.19
1958 3.16
1959 2.96
1960 2.83 1961
2.91 1962 2.78 1963
2.69 1964 2.77
1965 2.75
1966 2.60 1967
2.51 1968 2.30 1969
2.25 1970 2.12
1971 2.12
1972 2.14 1973
1.93 1974 1.78 1975
1.90 1976 1.85
1977 2.03
1978 2.07 1979
1.90 1980 1.93 1981
1.74 1982 1.93
1983 1.97
1984 1.75 1985
1.98 1986 1.91 1986
1.97 1987 1.72
1988 1.72
1989 1.96 1990
1.84 1991 1.94 1992
1.71 1993 1.58
1994 1.38
1995 1.28 1996
1.22 1997 1.53 1998
.996 1999 .961
2000 .974
2001 1.00
2002 .967 2003 .936
2004 1.35 2005 .921
2006 .901
2007 .901
2008 .932 2009 .971
2010 .997 2011 1.0
.
There is one automatic B10s at the end of the year, December
1991.
There are 3 instances in early January: 1967, 1976 and 1989.
One would think a breakout must wait a while.
Earlier B10s
Date      DJIA    Gain    LA/MA   ROC  P-I P-cha. P^^Adj IP21 V-I OPCT
----------------------------------------------------------------------
Judged 6/28/29 331.7  +2.9%  1.054   1.327  23  -1   +100   .048-102 .483
Judged 4/19/33  68.3  +50.4%  1.159   1.709  24  29   +177   .119 155  .066
Judged 11/7/34  97.6   +7.1%  1.034   .594   12 -20    +71   .092 -11  .165
     A judged B10 here reversed multiple Sell S9s.
Compare: Sell S12 well tested breakout  10/5/1937  172.60 produces rally to 184 on 11/10/1937
and B12 well-tested breakout on 6/22/1938.
10/8/1942  113.6 +24.8%   1.044   .691  114  20   +579         .325  91   .546
3/8/1944   139.5  +6.0%   1.023   .463  110  22   +587   .179  86   .328
12/8/1944  150.5  +9.0%   1.022   .243  106  18   +568   .134  91       .532
8/24/1945  169.9 +17.2%   1.038   .598  139  28   +628   .139  69   .254
10/15/1947 183.3  +0.6%   1.027   .535   98  21   +408   .181  77   .342
5/19/1948  188.3  +2.1%   1.027   .494  108  13   +461   .211 138   .40
8/2/1949   177.6 +21.2%   1.021   .652  153 -11   +599    .33  137   .471
10/4/1950  231.2  +0.1%   1.03    .595  143  15   +518   .133  169   .45
   DJI rally fizzled out after breakout.  Unexplected news hit Wall Street.
       Chinese Red Army crossed Yalu and attacked UN forces in October..
    The strength in the NYSE A/D continued
11/28/1952 283.70 +2.9%   1.034   .774  186  13   +688    .19  217   .47
9/8/1955   475.1  +3.4%   1.03    .68   100  37   +288    .131  65   .328
3/9/1956   497.8  +2.5%   1.035   .66   165  49   +524    .085 266  .207
2/4/1958   458.7  +36.1%  1.026   .429  197  18    +625    .101 296  .23
11/16/1962 630.9  +11.2%  1.056   .864  115  32   +322    .111  70  .142
7/2/1964   841.5  +11.6%  1.026   .432   94  20   +261    .042  51    .518
Judged  8/16/1965   +10.6%  1.017   .145   80   8   +222     -.009 20  .176
1/13/1967  835.13 +4.0%   1.039   .273  135  21   +339    .07    5  .221
9/30/1968  935.79 +4.5%   1.02    .565  119   8   +275    .09   12    .564
12/3/1970  808.53 +15.9%  1.044   .623  143  -3   +305    .06    0  .626
11/3/1972  984.12  +6.4%  1.039   .539  120  55   +257    .083   1  .259
10/5/1973  971.25  +1.6%  1.052   .908  251   1   +484    .248   2  .388
1/7/1976   898.69  +12.3% 1.054  1.124  286  35   +530    .20    2  .536
8/9/1984   1224.0  +0.2%  1.079  1.218  139  77   +244    .135  15 .414
Judged 1/14/85              1.028   .59   205  51   +406    .110   8 .121
Judged 1/21/85              1.041   .525  237  38   +469    .097   8 -.113
6/5/1985   1320.56 +2.6%  1.023   .673  234  11   +464    .125  15 .456
1/12/1989  2222.32 +24.7% 1.023   .454  118  21   +204    .078  11 .185
1/31/1991  2736.39 +22.6% 1.058   .58   143  33   +263    .116  12 .218
12/27/1991 3101.52  +6.8% 1.057   .755  117  18   +216    .077   7 .289
5/26/1993  3540.16 +12.1% 1.022   .428  105  28   +180    .138  15 .204
9/14/1995  4801.8  +13.7% 1.032   .413  237  24   +328    .08   14 .151
9/13/1996  5838.52 +17.0% 1.024   .359  150  20   +192    .116  13 .26
11/21/2005 10820.28 +7.0% 1.026   .685  227 -10   +307     .108 108 .316
8/18/2006  11381.47 +8.9% 1.019   .484  411  81   +379    .08   22 .05
3/23/2010  10888.83 -4.4% 1.031   .571  590  67   +573    .166  90 .425
           DJI rallied to 11205 (+3%) and then head/shoulders top.
Key Values
Valid B10 Current
1/14/1985 12/29/2011
DJI
1234.54 12287.04
LA/MA
1.028 1.018
21-dma ROC
0.59 0.724
P-I
205 253
Adjusted P-I
406
253 low
P-I Change
51 86
IP21
.11 .011 very low
V-I
8 40
OPct
.121
.04
-------------------------------------------------------------------------------------------------------------------------------
OLDER HOTLINES
-------------------------------------------------------------------------------------------------------------------------------
12/28/11 DJI = 12151 -140 la/ma=1.001 21-dma
ROC=.623 P= +167 (-186) IP21= -.02 V=+ 20
OP=.062
12/28/2011 BREADTH STATISTICS:
33 -36 MAXCP stocks Bullish MAXCP Stocks
185
MINCP stocks Bearish MINCP Stocks Bearish.
MAXCP stocks are those showing
Tiger Closing Power making new highs.
This suggests heavy Professional Buying. Applying the Tiger Power Ranker's
"bullish" to the MAXCP stocks find those with heavy insider buying and
institutional accumulation. Bearish MINCP stocks show the opposite.
Also use the BOTHUPs condition with MAXCPs and BOTHDOWNS MINCPS.
5 new highs on NASDAQ. 47 new lows on NASDAQ Bearish.
27 new
highs NYSE 29 new lows on NYSE
Bearish.
12/28//2011 GRAPHS ===>
See Key Peerless TigerSoft Index Charts: Industry Groups and ETFs
Most groups still have a plurality of stocks below their 65-dma. Defensive groups are still favored. BEARISH
DIA SPY QQQ
DJIA-Peerless TigerDJI TigerSPY
TigerQQQ GLD
SLV Crude
12/28/2001 ===> Closing Power (CP) Status Report: KEY ETF CHARTS:
DIA' s
CP's is downtrending. A close 0.88 ABOVE its opening would bullishly break the
longer-term CP downtrend.
SPY's CP is DOWNtrending. It will take a close of more than 1.14 ABOVE the
Opening to break the CP longer-term DOWN-trendline.
QQQ's CP is DownTrending. It will take a close of more than 0.44 ABOVE the
Opening to break the CP longer-term DOWN-trendline.
GLD's
CP is far below its DOWN-trendline
it would take a close of more than 8.15 ABOVE the
Opening to break the CP DOWN-trendline.
The Opening Power is short-term
fallng.
12/28/11 Sell S9. DEFLATIONARY FEARS ARE REAL.
Euro's Weakness means a Stronger
Dollar,
But Collapsing Overseas Markets,
Gold and Silver.
OPEC Holds up Oil, but for how
long?
The Sell S9 should be respected now. The odds
are much better that there will be a decline
than a breakout. See the Hotline I did yesterday.
With a Sell operating, late Decembers and the
first two weeks of January are much more likely to
bring a decline than a rally. In 8 cases the DJI fell
when Peerless was on a sell from 12/26 to 1/19.
In 4 of these cases the peak occurred before the
new year.
.
Peak
Subsequent Action
1947-8
12/31/48 Earlier S4...10 week decline.
1956-7 1/2/1957
Decline from 486.00 to 454.80 on 2/12/57 following
December S9/S12
1959-60 1/5/60
Sell S15 on 1/5/60
following December S12
3 month decline from
685.50 to 599.10 on 3/8/60
1961-62 12/28/61 Sell S10 on 1/4/62 following December S12
6 month decline from
731.50 to 535.70 on 6/26/1961
1983-1984 1/9/84
Sell S12 following earlier S4 ... Bear market followed.
2000-2001 12/29/2000 Earlier S12. DJI fell
back from 10876.85 to 9389.48 on 3/22/2001
2006-2007 2/20/2007 DJI zig-zagged higher despite 1/5/07 S9 until peak on 2/20/2007.
Then fell 6%.
2007-2008 12/26/2007 Earlier Dec. S9. Bear
market started
2009-2010
1/19/2010 Earlier S9. DJI fell from
10725.43 to 10012.23 on 2/5/2010
My understanding remains that Depressions are created by
austere Budget Balancing in the middle of a recession. Europeon
political leaders are following the advise their big banks are giving,
just as Hoover did in England and both Labour and Conservative
Governments did in the UK in the 1930s. The entrenched Austrian
School of Economics will not
admit their folly and the hardships
they are causing again.
Dec. 29,2011 - Financial Times on
European Austerity
http://tigersoftware.com/TigerBlogs/83---2011/index.html
Wall Street understands this better than the right-wing pundits
in the US. The decline today reflects renewed fears of a second dip
Recession here. As I see it, the pronounced weakness in overseas
stocks suggests DEFLATION IS EXPECTED. That also explains the
profound weakness now see in Gold, Silver and mining stocks. Sure
tax loss selling is at work now. But there is a bigger dynamic at work here.
Right-wing (Glen Beck)
and left-wing (Max
Keiser) scare mongers have
pushed the Public into buying Gold and Silver in a way that resembles
how the Public over-speculated in Internet Stocks in 1999-2000.
EURO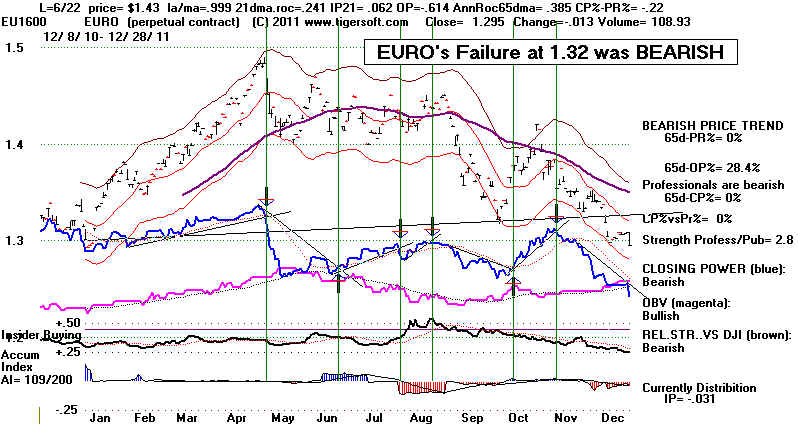 FOREIGN ETFS 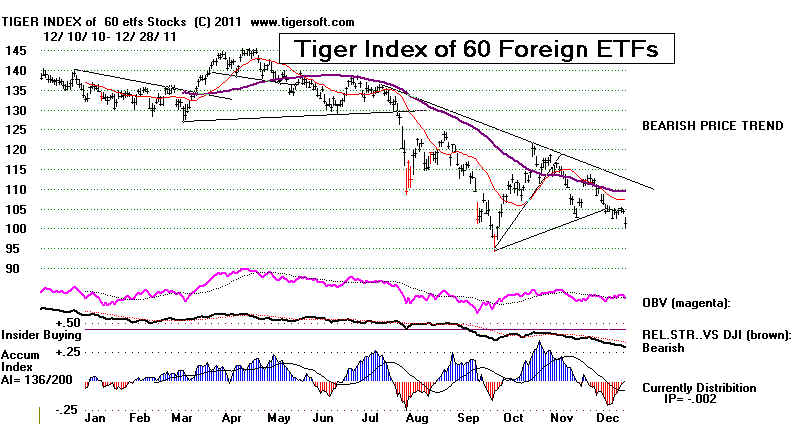 |
| DOLLAR - A breakout by the Dollar above 81.5 would be quite bearish for the EURO and signify an intensification" of its crisis. 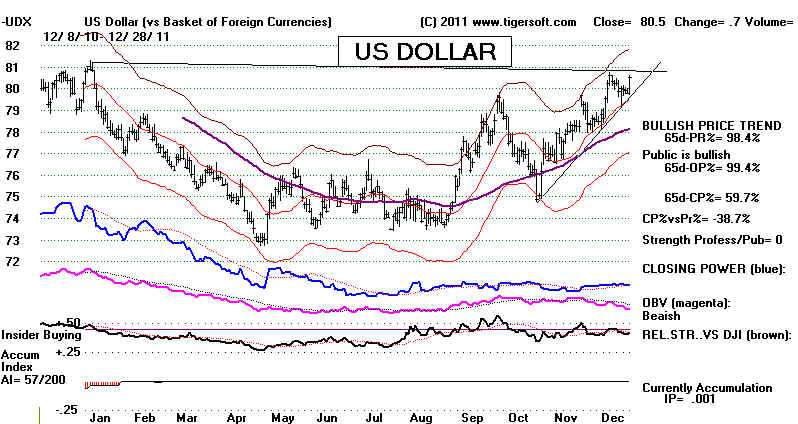 |
GOLD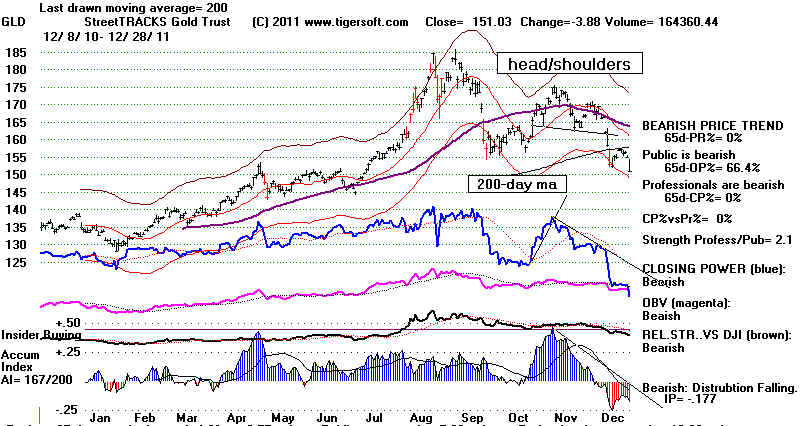 |
SILVER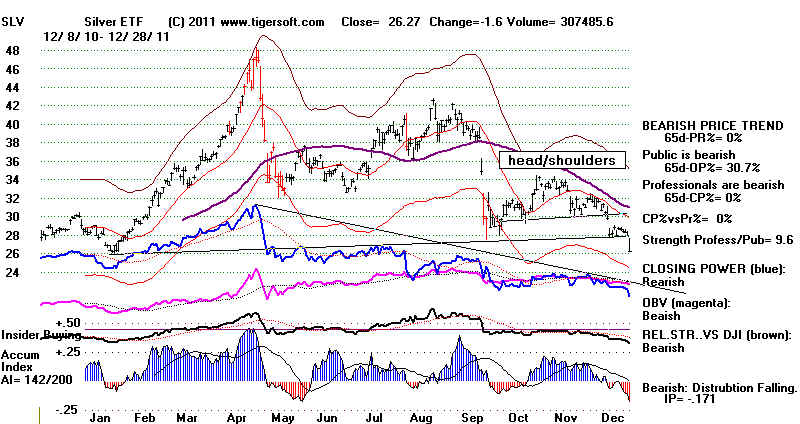 SSRI 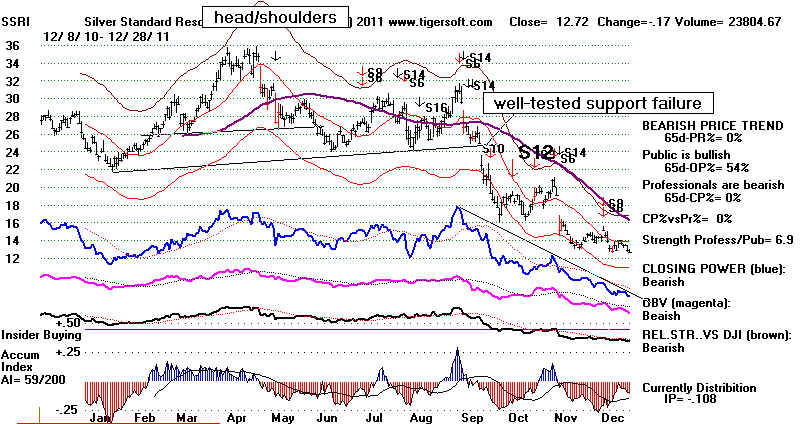 |
December Sell S9.
Santa Claus has left the building..... We are left
with a Peerless Sell S9 as the year ends. Tax-
selling and institutional window-dressing may exaggerate the
moves of the weakest and strongest
right up through the last day of the year, Friday. Apart
from that, the DJI's nominal new high
was not confirmed by the SP-500, NASDAQ or IWM (Russell-2000).
The weakness we are seeThere could still be a breakout above the
moderately flat resistance lines
shown in the DJI just chart below. Flat top breakouts
should have positive internals on the breakout.
A comparison of the key internals now with the important and
bullish January 14, 1985 breakout
may be instructive. The P-I Indicator, IP21 and OPct are
each far below that they were on the
very authentic breakout of 1/14/1985. In 1984-1985 there
were only about half as many stocks
trading on the NYSE. If we adjust for this, the P-Indicator
would have been 410 in today's terms.
(This should probably be done for all the Peerless historical studies!?)
That adjustment makes the P-Indicator reading now of 167 appear much
lower or more modest.
The next two charts below show the DJI and SP-500 charts for 1984-1985.
Two further differences
are seen. First, the flatness of the DJI's resistance lines of
1984-1985 was very striking. This
is important and made the situation then more bullish, because there
was then much wider agreement
about what price level would achieve a bullish breakout. When that
level was achieved, more
buy orders came in, all at once. Lazy selling at the old
highs was greater then, too. These
insttutions would later have to come back in the market.
Another difference between now and then was that the broader-based SP-500 was
actually
somehat stronger than the DJI then. Its resistance lines, that corresponded
to the DJI's, were
rising.
1/14/1985 12/28/2011
DJI
1234.54 12154.41
LA/MA
1.028 1.010
21-dma ROC
0.59 0.623
P-I
205 167
(Sum of Adv+ Dec
1696 2993
P-I Change
51 -186
IP21
.11 -.02
V-I
8 20
OPct
.121 .062
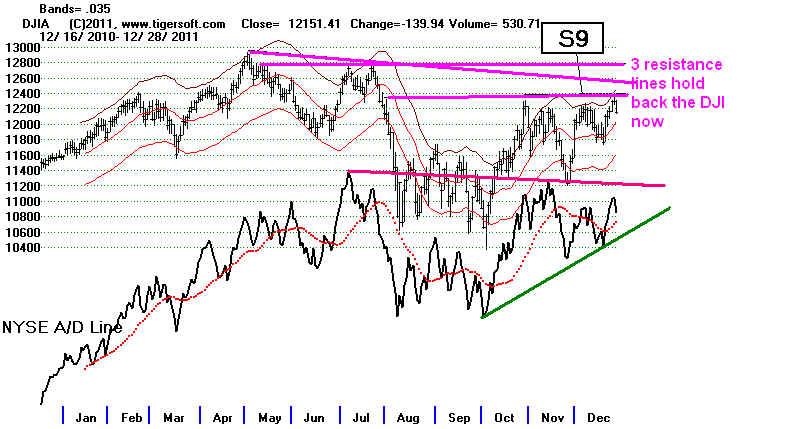
At the end of 1984, the DJI looked somewhat similar in that
there were two flat resistance
line above the DJI as the year ended. The first
breakout (and judged B10 confirmed by a corresponding
A/D Line brreakout ) led to the second breakout and
eventually much higher prices.
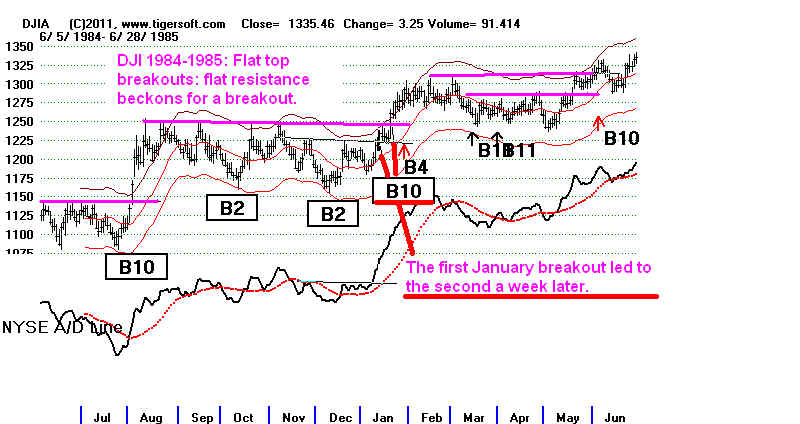
The SP-500's resistance lines were actually rising in 1984,
showing greater relative strength than now.
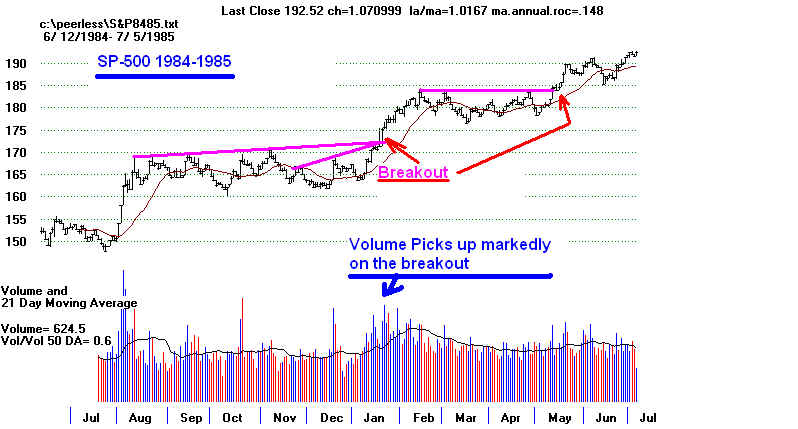
====================================================================================
OLDER
HOTLINES
====================================================================================
12/27/11 DJI = 12291 la/ma=1.024 21-dma ROC= 1.055 P=
+352 (+18) IP21= +.03 V=+ 80
OP=.139
12/27/2011 BREADTH STATISTICS:
69 +21 MAXCP stocks Bullish MAXCP Stocks Bullish.
58
+18 MINCP stocks Bearish MINCP Stocks
MAXCP stocks are those showing
Tiger Closing Power making new highs.
This suggests heavy Professional Buying. Applying the Tiger Power Ranker's
"bullish" to the MAXCP stocks find those with heavy insider buying and
institutional accumulation. Bearish MINCP stocks show the opposite.
Also use the BOTHUPs condition with MAXCPs and BOTHDOWNS MINCPS.
38 new highs on NASDAQ. 33 new lows on NASDAQ Bullish.
127 new
highs NYSE 14 new lows on NYSE
Bullish.
12/27//2011 GRAPHS ===>
See Key Peerless TigerSoft Index Charts: Industry Groups and ETFs
Most groups still have a plurality of stocks below their 65-dma. Defensive groups are still favored. BEARISH
DIA SPY QQQ
DJIA-Peerless TigerDJI TigerSPY
TigerQQQ GLD
SLV Crude
12/27/2001 ===> Closing Power (CP) Status Report: KEY ETF CHARTS:
DIA' s
CP's 4-day trend is still up but slowing down. It broke its steep CP uptrend
slightly.
It is still below its 3
week downtrend. A close 0.87 above its opening would bullishly break the
longer-term CP downtrend.
SPY's CP is slightly above its 3-week DOWNtrendline. It will take a close of more than 0.31 BELOW the
Opening to restore the CP DOWN-trendline.
QQQ's CP is slightly below its 3-week DownTrendline. Any close of more than 0.02 ABOVE the Opening
will break the CP DOWNTREND-line.
GLD's
CP is far below its 3-week DOWN-trendline, very oversold but
is apt to keep rallying..
it would take a close of more than 6.04 ABOVE the
Opening to break the CP DOWN-trendline.
The Opening Power is short-term
risng.
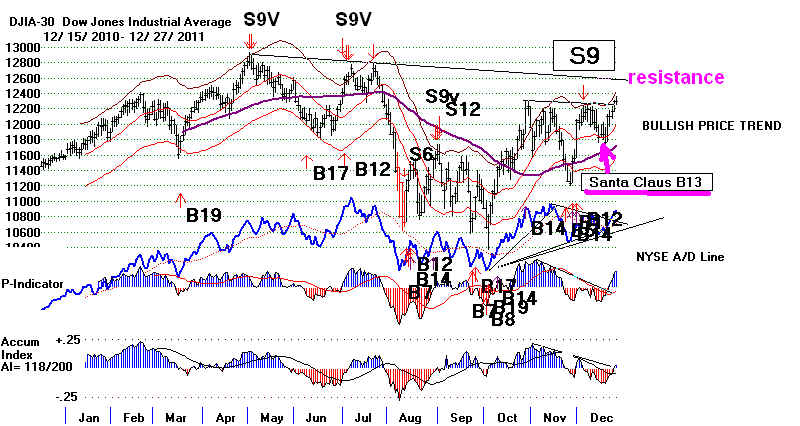
12/27/11 Santa Claus Rally versus December Sell S9.
Take profits in DIA. Without a Buy signal, much
higher volume or a decisive price breakout,
we are thrown back to the bearish Sell S9 signal as the reigning
Peerless signal now. Breadth
was again positive. The NYSE A/D Line did make a recovery new
high. But although though there were
61 more up than down, NYSE Down Volume was 35% more than UP
VOLUME. Bearishly SPY,
QQQ, NASDAQ and IWM have all failed to make a recovery high above
the ones made at the
end of November.
Tonight our Stocks' Hotline has added some new short sales from
among the Bearish MINCP
stocks.
What is of concern is how often the DJI and market pivot and turn
downward sharply
not long after December 25th: A breakout upwards is still a
possibility, too. But with
the Sell Signal S9 operating, let the bulls prove their case.
Take some trading profits.
The DJI seems more likely to pivot down than breakout in the next
two weeks. Below is
a study of the DJI since after WWII.
I have looked at the 52 Bull Market end of year action since
1946. In 9 cases the
DJI peaked before the new year and sold off. In 14
cases it sold off from a peak early in the
new year,before the 15th of January. Significant breakouts
upwards occurred only 4 times before
the start of the new year and 6 times before the 15th of January.
Without a major Buy signal
other than a Santa Claus Buy, significant advances seldom occur
as long as a Sell reigns. Only in two
cases of 9 where a Sell was operative did the DJI delay
declining until after January 9th.
Peak Subsequent Action
1947-8
12/31/48 Earlier S4...10 week decline.
1956-7 1/2/1957
Decline from 486.00 to 454.80 on 2/12/57 following
December S9/S12
1959-60 1/5/60
Sell S15 on 1/5/60
following December S12
3 month decline from
685.50 to 599.10 on 3/8/60
1961-62 12/28/61 Sell S10 on 1/4/62 following December S12
6 month decline from
731.50 to 535.70 on 6/26/1961
1983-1984 1/9/84
Sell S12 following earlier S4 ... Bear market followed.
2000-2001 12/29/2000 Earlier S12. DJI fell
back from 10876.85 to 9389.48 on 3/22/2001
2006-2007 2/20/2007 DJI zig-zagged higher despite 1/5/07 S9 until peak on 2/20/2007.
Then fell 6%.
2007-2008 12/26/2007 Earlier Dec. S9. Bear
market started
2009-2010
1/19/2010 Earlier S9. DJI fell from
10725.43 to 10012.23 on 2/5/2010
.
A major Buy is needed to continue the advance very much.
That will take much better volume.
Usually volume does not come back into the market until after the
new year.
Bull Markets: 1946-2011 and Pivots Down At
The End of The Year
Breakouts and
Pivots Down Peaks
Reaction of DJI: UP and DOWN
1-10
1947-8
12/31/48 Earlier S4...10 week decline.
1951-2 12/29/51
Breakout following B12
1952-3
1/6/53 Sell
S8 on 12/30 3 month decline
1953-4 1/15/54
Breakout following B12
1954-5 1/3/55
Decline from
408.90 to 388.20 on 1/17/56 following earlier B11
1955-6 12/30/55
Decline from 488.40 to 462.40 on
1/23/56 following earlier B17/B10/B11
1956-7 1/2/1957
Decline from 486.00 to 454.80 on 2/12/57 following
December S9/S12
1958-9 12/30/59
Breakout following earlier B18/B11
1959-60 1/5/60
Sell S15 on 1/5/60
following December S12
3 month decline from 685.50 to 599.10 on 3/8/60
1961-62 12/28/61
Sell S10 on 1/4/62 following December
S12
6 month decline from 731.50 to 535.70 on 6/26/1961
11-20
1963-1964 1/22/64 Breakout
following earlier B5
1964-1965 1/7/65
Breakout following earlier B11
1965-1966 1/5/66
Breakout following earlier B11; then peak at 1/18/66 on S12.
Bear market followed.
1967-1968 1/8/68
1/9/69 Sell S12 following earlier B17. DJI fell from 908.20 to
825.13 on 3/21/1968.
1970-71 12/29/70
Breakout following earlier B4/B11
1971-72
February breakout following earlier B12
1972-73 1/11/73
Sell S9/S12/S15 following earlier B4... Bear market started
1975-1976 1/5/76
Breakout B10 following earlier B9
21-30
1976-1977 12/31/76
Sell S4/S8 following earlier B17 ... Bear market started
1980-1981 1/6/81
Sell S4/S8 following earlier B17 ... Bear market started
1982-1983 1/12/83
Sell S12 following earlier B6 ... DJI fell fro two
eeeks from 1083.61 to 1030.17 on 1/24/83
1983-1984 1/9/84
Sell S12 following earlier S4
... Bear market followed.
1984-1985 1/21/85
Breakout B10 following earlier B2/B11
1985-1986 1/7/86
No Sell but DJI fell back from nominal new
high at 1565.71 to 1511.24 on 1/23/86
1986-1987 1/6/87
Breakout B14 following earlier B9/B17/B6
1988-1989 1/17/89
Breakout B10 following earlier B7
1989-1990 1/3/86
Sell S14 following earlier B17. DJI fell back
from nominal new high at 2809.73.
Declined to to 2553.38 on 1/29/86
31-40
1991-1992
12/27/91 B10 Breakout following earlier B17
and renewal of bull market.
1992-1993 12/29/93
No Sell but DJI fell back from nominal new high at 3310.84 to
3241.95 on 1/20/93
1993-1994 1/10/94
Breakout advance following earlier Buy. Peak on 2/3/1995 S4.
Bear mkt followed.
1994-1995 1/16/95 Peak without Sell. Pullback from 3932.34 to 3832.08 on 1/30
2/10/94 Breakout advance following earlier Buy B6.
1995-1996 1/3/1996
No Sell but DJI fell back from 5194.07 to 3032.94 on 1/10/1996.
1/29/1996 Breakout advance following
earlier Buy B4
41-50
1996-1997 1/13/1997 Breakout advance following
earlier Buy B4/B17
1997-1998 1/9/1998
No Sell but DJI fell back from 7978.99 to 7580.42 on 1/9/1998.
2/10/1998 Breakout B4 advance following earlier Buy B9
1998-1999 1/8/1999
No Sell but DJI fell back from 9643.32 to 9133.03 on 2/9/1999.
Then Bull market resumed.
1999-2000 12/31/1999 S9 and DJI
fell back from 11497.12 to10997.93 on 1/4/2000
1/14/2000 S4/S14 and
DJI fell back from 11722.98 to 9796.03 on 3/7/2000
2000-2001 12/29/2000 Earlier
S12. DJI fell back from 10876.85 to 9389.48 on 3/22/2001
2003-2004 1/27/2004 No Sell until 2/11/2004
S15. DJI fell back from 10609.92 to10063.64 on 3/23/2004
2004-2005 12/28/2004 S8 reversed
B9. DJI fell back from 10854.54 to 10368.61 on 1/24/2005
2005-2006 1/11/2006 No Sell but
DJI fell back from 11043.44 to 10667.39 on 1/20/2006
2006-2007 2/20/2007 DJI zig-zagged higher
despite 1/5/07 S9 until peak on 2/20/2007. Then fell 6%.
2007-2008 12/26/2007 Earlier Dec.
S9. Bear market started
51-52
2009-2010 1/19/2010
Earlier S9. DJI fell from 10725.43 to 10012.23 on 2/5/2010
2010-2011 1/3/2011 Breakout
after earlier B18. Bull market resumed.
====================================================================================
OLDER HOTLINES
====================================================================================
12/23/11 DJI = 12294 +124 la/ma=1.029 21-dma ROC= 1.037 P=
+334 IP21= +.023 V=+ 80
OP=.146
12/23/2011 BREADTH STATISTICS:
48 +4 MAXCP stocks Bullish MAXCP Stocks Bullish.
40 MINCP stocks Bearish MINCP
Stocks
MAXCP stocks are those showing
Tiger Closing Power making new highs.
This suggests heavy Professional Buying. Applying the Tiger Power Ranker's
"bullish" to the MAXCP stocks find those with heavy insider buying and
institutional accumulation. Bearish MINCP stocks show the opposite.
Also use the BOTHUPs condition with MAXCPs and BOTHDOWNS MINCPS.
16 new highs on NASDAQ. 15 new lows on NASDAQ Bullish.
92 new
highs NYSE 3 new lows on NYSE
Bullish.
12/23//2011 GRAPHS ===>
See Key Peerless TigerSoft Index Charts: Industry Groups and ETFs
Most groups still have a plurality of stocks below their 65-dma. Defensive groups are still favored. BEARISH
DIA SPY QQQ
DJIA-Peerless TigerDJI TigerSPY
TigerQQQ GLD
SLV Crude
12/22/2001 ===> Closing Power (CP) Status Report: KEY ETF CHARTS:
The ETFs CPs are all in
intermediate-term Down-trends and short-term Up-trends.
DIA' s
CP iS above its 3-dayt UPtrendline Any close of more than 0.40 BELOW the Opening will break the CP
DOWN-trendline.
SPY's CP is below its DOWNtrend It will only take a close of more
than 0.33 ABOVE the
Opening to break the CP DOWN-trendline.
QQQ's CP is above 3-day UPtrendd Any close of more than 0.45 BELOW the Opening will break the CP
UP-trendline.
GLD's
CP is far below its DOWN-trendline,
very oversold but is apt to keep
rallying..
it would take a close of more than 6.3 ABOVE the
Opening to break the CP DOWN-trendline.
The Opening Power is short-term
risng.
12/23/11 Santa Claus Rally versus December Sell S9.
Will There Be A
Breakout? Breadth Says "Yes"
And the seasonality is
still bullish. But we need
to see a major Peerless
Buy. Without much higher
Volume, the Accum.
Index will remain near zero and
that wil probably
prevent a Buy B10.
Work in Progress
After December 26th since 1965, the DJI does rise 2/3 of the time over the next week.
But the gains are small and the Santa Claus Buy is a short-term Buy and does not
alter the fact that the last intermeidate-term Peerless signal was a Sell S9. Bulls
will need to see a new red Peerless major Buy.
The buying has been here has been on low volume and is still concentrated
in defensive and dividend-paying stocks. This has caused the SP-500 and NASDAQ
to lag the DJI by enough to make any DJI new high unconfirmed by thes eother
averages. Such divergences are often quite bearish. But they do not call
every top.
They offered no warning, for example, at the important tops of January 1973, October 1978,
September 1979, March 1980, October 1987, July 2007 or December 2007, when S9s did
take place.
The SP-500 failed to match a DJI new high at these important tops:
March-April 1981
Jan. 1984
Jan. 1990 - NASDAQ also failed to confirm
July 1990 - The margin of the SP andNASDAQ new highs in July 1990
was smaller than DJI's
Jan 2000
May 2001 - NASDAQ also lagged very badly.
March 2002 - NASDAQ also lagged very badly.
Jan 2000.
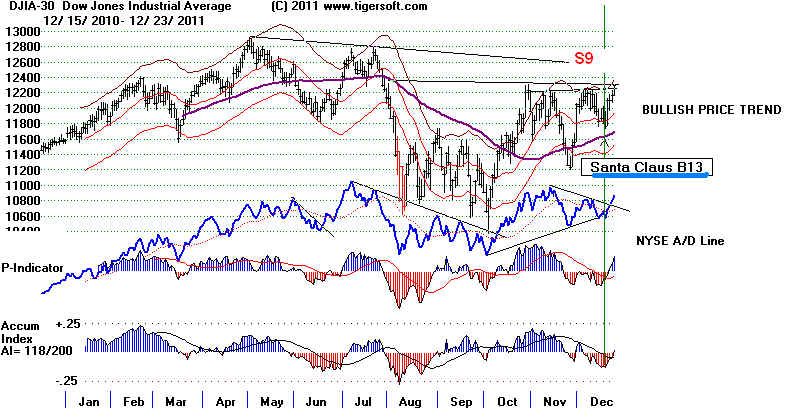
=================================================================================
OLDER HOTLINES
=================================================================================
12/22/11 DJI = 12170 +62 la/ma=1.022 21-dma ROC= .678 P=
+59 IP21= -.056 V= -6
OP= -.011
12/22/2011 BREADTH STATISTICS:
44 +2 MAXCP stocks Bullish MAXCP Stocks
61 MINCP stocks Bearish MINCP
Stocks
Bearish.
MAXCP stocks are those showing
Tiger Closing Power making new highs.
This suggests heavy Professional Buying. Applying the Tiger Power Ranker's
"bullish" to the MAXCP stocks find those with heavy insider buying and
institutional accumulation. Bearish MINCP stocks show the opposite.
Also use the BOTHUPs condition with MAXCPs and BOTHDOWNS MINCPS.
27 new highs on NASDAQ. 17 new lows on NASDAQ Bullish.
79 new
highs NYSE 11 new lows on NYSE
Bullish.
12/21//2011 GRAPHS ===>
See Key Peerless TigerSoft Index Charts: Industry Groups and ETFs
Most groups still have a plurality of stocks below their 65-dma. Defensive groups are still favored. BEARISH
DIA SPY QQQ
DJIA-Peerless TigerDJI TigerSPY
TigerQQQ GLD
SLV Crude
12/22/2001 ===> Closing Power (CP) Status Report: KEY ETF CHARTS:
The ETFs CPs are all in
Down-trends. But very oversold and rising.
DIA' s
CP iS far below its DOWNtrend It is considered oversold and apt to keep
rallying.
Any close of more than 1.90 ABOVE the
Opening will break the CP DOWN-trendline.
The Opening Power is short-term declining.
SPY's CP is far below its DOWNtrend It is considered oversold and
likely to turn up soon.
Any close of more than
1.30 ABOVE the Opening will break
the CP DOWN-trendline.
The Opening Power is short-term declining.
QQQ's CP is far
below its longer-term DOWN-trend
It is considered oversold and apt to keep rallying.
Any close of more than
1.00 ABOVE the Opening will break
the CP DOWN-trendline.
The Opening Power is short-term declining.
GLD's
CP is far below its DOWN-trendline,
very oversold and apt to keep rallying..
it would take a close of more than 6.1 ABOVE the
Opening will break the CP DOWN-trendline.
The Opening Power is short-term
risng.
12/22/11 Santa Claus Rally versus December Sell S9.
12300 Should Be Tested This Year. A
Breakout
Past That Next Year Is Likely if Breadth Stays
Strong.
Warning: Right Now The Advance Seems Way
Too
Narrowly Defensive To Bring a New Bull Market.
Without a new Peerless Buy, January Could Be
Dangerous To Bulls.
Bullishly, the NYSE A/D Line broke its downtrend, becase there were 3x more
advancers than declines. The P-Indicator has turned positive, too. However,
the
Accumulation Index is still negative and Cumulative NYSE Up-Down Volume continues
to lag prices. If the first resistance at 12250 resistance is overcome, the higher
one at
12600 will probably be breached, too. What the DJI does, is not necessarily what the
SP-500 or NASDAQ will do. This has become a very defensive market. Scared
money
is being put into "Blue Chip" DJI stocks, bonds, dividend paying REITs, food,
tobacco and
pharmaceuticals much more than speculative stocks. With interest rates low and a
concerted effort by the Administration, the Fed and big brokerage program traders,
a narrowing non-speculative market can last some time. Stick with DIA. Avoid
SPY
and QQQ.
Without a new Peerless Buy, even with a breakout above 12600, it is hard to
be very constructive about most stocks. In the study I did last night you can see
that
when there has been a Sell S9 in December, even the DJI tops out by early January
in 6 of 7 cases. Here are the relevant cases I can find now.
Opererative
Price Breakout B10
Subsequent Peak
Peerless Over Well-Tested
on
Signal
Resistance
Breakout?
----------
---------------------------- ----------------
---------------------------
S9,S12
1/3/1957 499.20 No
Peak - decline to 454.80 on 2/12/1957
S12 ,S15 1/5/1960
685.50 S15 A/D Lag.
Peak - decline to 607.10 on 3/9/1960
S9, B6
1/10/1983 1092.35
S12
Peak - Decline to lower band.
S9
12/28/1999 11485
S9
Peak - Decline to lower band.
B18, S9 (12/28/2004) 3/4/2005
10941 S15
Peak - 8% decline.
S9, S12
Dec.
head/shoulders JudgedS10 13.5% decline from Dec. peak
S9, B13
1/12/2010 10627 No
8% pull-back
The earlier S9 was a warning that the breakout would fail.
The current S9 suggests the same thing
if there is no new Peerless Buy.
What To Do
For now, stay long DIA, some defensive stocks and bullish MAXCP stocks. Short
selling
will be tricky now because of the cross currents of tax-loss selling.
DJI is approaching two horizontal resistance
lines.
Usually when the first is broken, the second higher one is overcome, too.
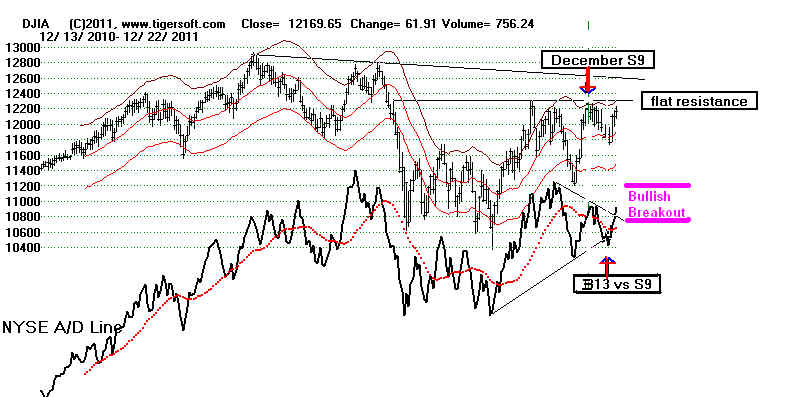

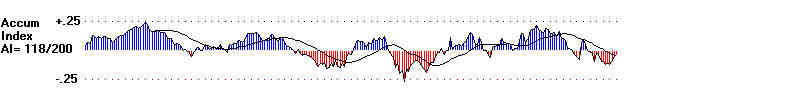

NASD - Below its 200-day ma and NASDJI is negative.
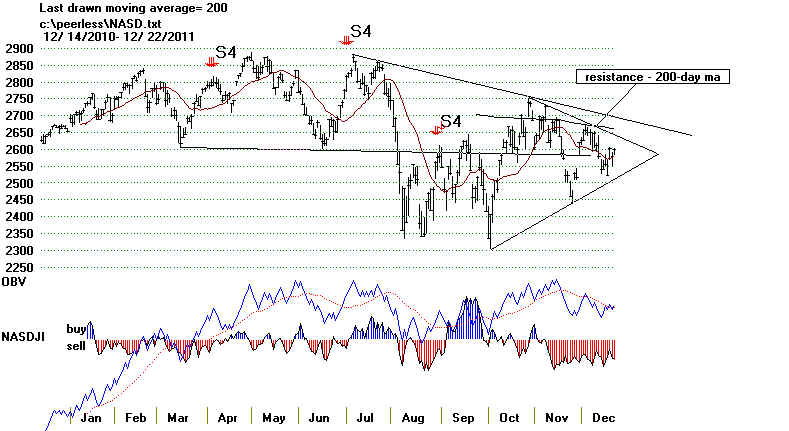
,s
====================================================================================
OLDER HOTLINES
====================================================================================
12/21/11 DJI = 12108 +4 la/ma=1.02 21-dma ROC= .563 P=
+59 IP21= -.056 V= -6
OP= -.011
12/21/2011 BREADTH STATISTICS:
42 +15 MAXCP stocks Bullish MAXCP Stocks
308
MINCP stocks Bearish MINCP Stocks Bearish.
MAXCP stocks are those showing
Tiger Closing Power making new highs.
This suggests heavy Professional Buying. Applying the Tiger Power Ranker's
"bullish" to the MAXCP stocks find those with heavy insider buying and
institutional accumulation. Bearish MINCP stocks show the opposite.
Also use the BOTHUPs condition with MAXCPs and BOTHDOWNS MINCPS.
28 new highs on NASDAQ. 27 new lows on NASDAQ
94 new
highs NYSE 12 new lows on NYSE
Bullish.
12/21//2011 GRAPHS ===>
See Key Peerless TigerSoft Index Charts: Industry Groups and ETFs
Most groups still have a plurality of stocks below their 65-dma. Defensive groups are still favored. BEARISH
DIA SPY QQQ
DJIA-Peerless TigerDJI TigerSPY
TigerQQQ GLD
SLV Crude
12/21/2001 ===> Closing Power (CP) Status Report: KEY ETF CHARTS:
The ETFs CPs are all in
Down-trends. But very oversold and rising.
DIA' s
CP iS far below its DOWNtrend It is considered oversold and apt to keep
rallying.
Any close of more than 2.49 ABOVE the
Opening will break the CP DOWN-trendline.
The Opening Power is short-term declining.
SPY's CP is far below its DOWNtrend It is considered oversold and
likely to turn up soon.
Any close of more than
2.28 ABOVE the Opening will
break the CP DOWN-trendline.
The Opening Power is short-term declining.
QQQ's CP is far
below its longer-term DOWN-trend
It is considered oversold and apt to keep rallying.
But any close of more than
0.29 BELOW the Opening will restore the
CP DOWNtrendline.
The Opening Power is short-term declining.
GLD's
CP is far below its DOWN-trendline,
oversold and apt to keep rallying..
it would take a close of more than 6.64 ABOVE the
Opening will break the CP DOWN-trendline.
The Opening Power is short-term
risng.
12/21/11 Santa Claus Rally versus December Sell S9.
12300 Should Be Tested This Year. A
Breakout
Past That Next Year Is Likely if Breadth will
stay positive enough to give us a Buy B10 on
the
Breakout. Right Now The Advance
Seems Way Too
Narrowly Defensive To Bring a New Bull Market.
I have suggested covering most short sales and
going long DIA, defensive and bullish
MAXCP stocks. The Futures appear to be up 70. A rally now is in keeping with
the time-|
honored Santa Claus rally tradition. Since 1965, the DJI has rallied on average 1.5%
and
risen 73.3% of the time over the next 10 trading days. The declining Closing Power
is
not a barrier to a rally when it gets as oversold as it was two days ago. In
additon, the
A/D Line downtrend since its mid-November peak may be violated tomorrow. That will
boost the market. And another bullish domino could fall if the DJI were to breakout
and close
above the flat resistance at 12300. I have argued that Wall Street, the Fed and the
Obama
Administration are betting heavily on the rally continuing. If it were to falter,
there could be
a bear market right in the middle of a Presidential Election year. That would surely
raise
populist pressures on Elite Wealth esconsced behind the Greed Connection between
Wall Street and Washington. It is this alliance which has created the bull market
since March 2009.
all without significant improvement to millions who live Main Street.
5/10/2009 - http://www.tigersoftware.com/TigerBlogs/April-7-2009/index.html
There is ample precedent for an important price breakout above flat resistance
after the New Year. It rarely occurs in the two weeks before New Year's Day. A
Buy B10
is not essential, but there should be an automatic Peerless Buy early on if the advance
after a breakout is apt to be significant. Well-tested means 3x or more tested. A
Sell
signal on the breakout is reliably bearish. Without a new automatic Buy signal, the operative
S9 signal suggests any breakout we may see here in the next few weeks will be false.
Oper. Price
Breakout B10
Subsequent Peak
Peer. Over
Well-Tested on
Signal Resistance
Breakout?
---------- ----------------------------
----------------
---------------------------
B13 1/22/1934
105.10 No
2/5/1934 110.70
B13 ,B11 2/3/1936
150.60 No
4/6/1936 161.90
B13
1/20/1937 185.90 No
3/8/1937 192.70
B10,B18 1/4/1943
120.30 No
6/4/1943 142.30
B7,B9 3/8/1944
139.50 B10
6/19/1944 148.40
B13,B11 12/8/1945 150.50 B10
5/15/1945 164.00
B10,B18 12/14/1949 198.50
No
6/12/1950 228.40
B7
1/2/1951
239.90 No
5/3/1951 263.10
B13,B12 1/20/1954 289.10
No
much higher
B13, B11 3/12/1956 500.20
B10
4/9/1956 518.50
S9,S12
1/3/1957
499.20 No
Peak
- decline to 454.80 on 2/12/1957
B11,B19 3/3/1959 610.88
No
7/1/1959 650.20
S12 ,S15 1/5/1960 685.50
S15 A/D Lag Peak - decline to 607.10 on 3/9/1960
B17 1/30/1961
650.60 No -B18
5/19/1961 705.90
B5
1/9/1964 776.60 No
much higher
B18,B11 1/6/1966 985.46
S12,S15
Peak - bear market followed.
B13, B12
1/29/1975 705.96 No
much higher
B9,B13 1/5/1976 877.83 B10
3/24/1976 1009.21
B17,B9
1/10/1980 858.96
S4,S12 Peak -
bear market followed.
S9, B6
1/10/1983 1092.35 S12
Peak - Decline to lower band.
B2, B13
1/21/1985 1261.37 No
much higher
B17,B13,B6 1/12/1987 2009.42
No
much higher
B17
1/11/1989 2206.43 B10
much higher
B17,B12 1/30/1991 2713.12 B10
much higher
B7, B13 12/23/1992 3022.56 B10
followed on second breakout 12/30/1992
Peaked 4/15/1992 3353.76
B6
2/15/1995 3986.17 No
much higher
B4,B13 1/29/1996 5304.98
No
2/7/1996 5549.21
B17,B13 1/13/1997 6709.18 No
3/11/1997 7085.16
B1,B13 2/9/1998
8180.52 No
4/22/1998 9176.76
S9
12/28/1999
11485 S9
Peak - Decline to lower band.
S9
3/4/2005 10941 S15
Peak - Decline to lower band.
B13
1/11/2006 11043 No
3% pull-back - Peaked 5/10/2006 11643
S9, B13
1/12/2010 10627 No
8% pull-back
The earlier S9 was a warning that the breakout would fail.
The current S9 suggests the same thing
if there is no new Peerless Buy.
B3,B8
1/3/2011 11671 No
5/2/2010 12807
-------------------------------------------------------------------------------------------------------------------------------------------------------
DJI Charts flat, well-tested resistance at
12350.
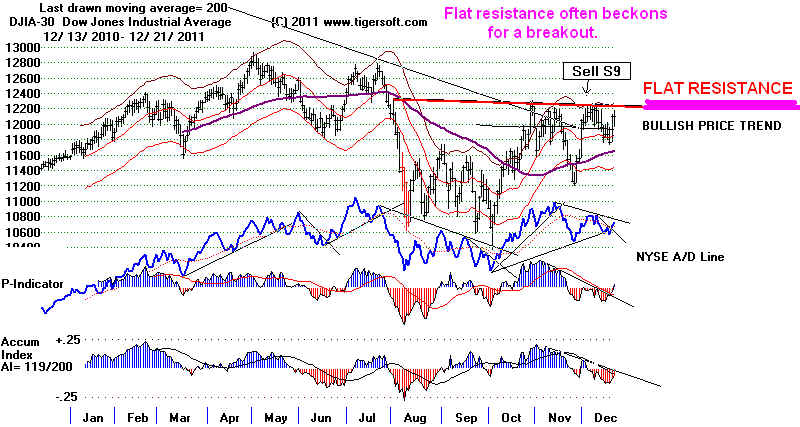
The leaders of the 2-day rally have been defensive stocks, stocks whose
revenue
does not dip so much in a recession are still in favor. There are
a handful of interesting
exceptions. We might want to study them because their high levels
of Accumulation
shows significant insider buying. They could therefore become the
best performers
of the next 3-12 months. They are
More Speculative
New Highs Today
AI/200 IP21
CP-65day %
GRMN
39.56 +.57 139
.321
100% - CP making 65-day high
HD
42
+.05 113
.114
100%
KMR
75.5 +.64
150
.162
100%
LTS
2.7 +.06
152
.195
100%
OSIS
48.41 +.11
133 .075
100%
BUY OXM 44.07 +.63
158
.269
100%
PCCC
11.47 +.09 126
.222
100%
BUY PGNX 8.84 + .35
153
.276
100%
RRR
18.7 +.08
129
.658
100%
Only two, OXM and PGNX show AI/200 score above 150 AND IP21 levels
above +.25.
This is considered a safer and effective way to find new highs that are
apt to extend their
gains nicely.
| OXM
Oxford Industries Inc 55 was high in 2007.
4000 employees textiles, apparels Atlanta, GA Oxford Industries, Inc. engages in designing, sourcing, and marketing apparel products primarily in the United States and the United Kingdom. 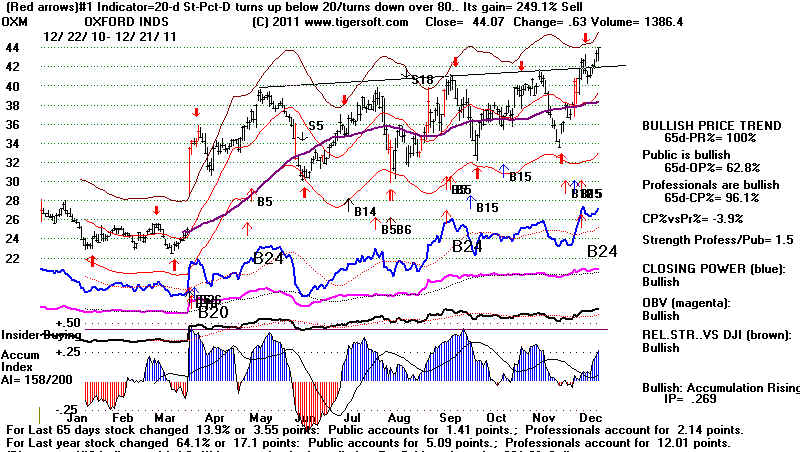 |
| PGNX 144
employees - This was over 90 in 2000. http://www.progenics.com Tarrytown, NY Progenics Pharmaceuticals, Inc., a biopharmaceutical company, engages in the development and commercialization of therapeutic products to treat the unmet medical needs of patients with debilitating conditions and life-threatening diseases in the United States and internationally. Its primary programs focus on gastroenterology, oncology, and virology. 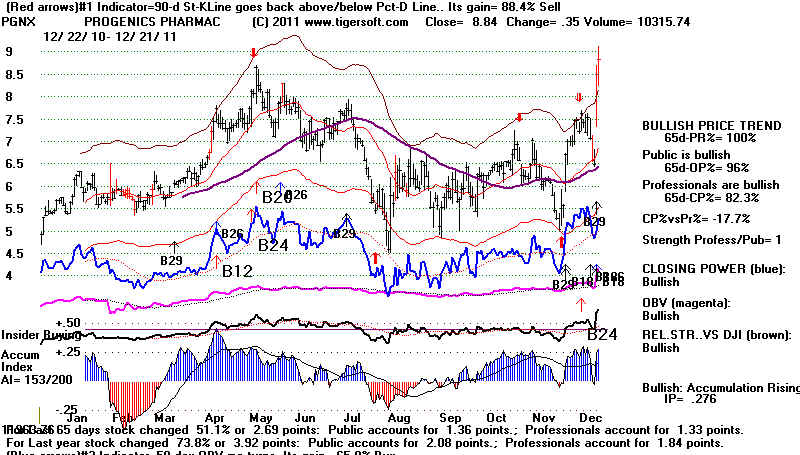 |
Over-Textended, Defensive-Led Rallies Often Lead To Bear Markets
The bullish MAXCPs are not numerous.. We have now a very defensive
market. Institutions
are putting their cash more into a select number of the best
perforing REITs,
Pharmaceuticals, Foods, Tobaccos, Papers, Less Regulated Utilities and
Bond Funds.
Did you notice that all of the 15 super defensive trading REITs
are above their 65-day ma?
They are "yoyo's."
The following defensive stocks made new highs:
Big Pharmaceuticals: ABT,
AMGN, BMY, IHE, LLY, PFE.
Foods, Tobaccos and Papers:
BGS, KFT, KMB, MCD, MO, PM, SBUX, TSN .
Less regulated Utilities:
AEP, DTE, DUK, ED, EP, IDU, LNT, OGE, PAA, PGN, PNY, SE, SO,
VPU, VZ, WEC, XEL, XLU
Municipal Bonds and Income
Funds: KTF, LEO, MFL, MUA, MUI, MYD, MYI, MYJ, NIO, NPI, NPM,
NPP, NVG
Below is the Tiger chart of the composite 45 SUPER DEFENSIVE STOCKS
that made new
12-month highs today.
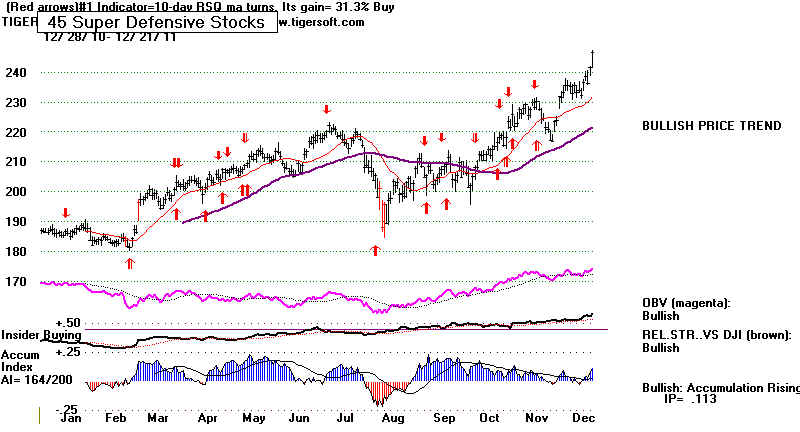 .
.
Excluding tobacco stocks, the most bullish Defensive Stocks, when Power
Ranked are
NPM Nueveen Prem 14.77,
NPI Nuveen Premier 14.36,
VZ Verizon 39.22 (CP bearish divergence but highest AI/200 score in DJI-30)
MUI Blackrock Muni - 15.14
It's hard to recommend these. They take great patience. More
important, when
the leadership is this defensive, the market is considered too dangerous by
most funds
to speculate aggressively. Often this is the environment that precedes
a substantial
decline in the next quarter. Technically, it is apt to bring bearish
divergences and Sell S9s.
| |
| |
| |
=====================================================================================
OLDER HOTLINES
=====================================================================================
12/20/11 DJI = 12104 la/ma=1.0222 21-dma ROC= .309 P= -76
IP21= -.086 V= -57 OP= -.096
12/20/2011 BREADTH STATISTICS:
27 +5 MAXCP stocks Bullish MAXCP Stocks
308
MINCP stocks Bearish MINCP Stocks Bearish.
MAXCP stocks are those showing
Tiger Closing Power making new highs.
This suggests heavy Professional Buying. Applying the Tiger Power Ranker's
"bullish" to the MAXCP stocks find those with heavy insider buying and
institutional accumulation. Bearish MINCP stocks show the opposite.
Also use the BOTHUPs condition with MAXCPs and BOTHDOWNS MINCPS.
36 new highs on NASDAQ. 37 new lows on NASDAQ
78 new
highs NYSE 9 new
lows on NYSE Bearish.
12/20//2011 GRAPHS ===>
See Key Peerless TigerSoft Index Charts: Industry Groups and ETFs
Most groups still have a plurality of stocks below their 65-dma. Defensive groups are still favored. BEARISH
DIA SPY QQQ
DJIA-Peerless TigerDJI TigerSPY
TigerQQQ GLD
SLV Crude
12/20/2001 ===> Closing Power (CP) Status Report: KEY ETF CHARTS:
The ETFs CPs are all in
Down-trends. This is short-term
BEARISH
DIA' s
CP iS far below its DOWNtrend It is considered oversold and apt to keep
rallying.
Any close of more than 2.70 ABOVE the
Opening will break the CP DOWN-trendline.
The Opening Power is short-term declining.
SPY's CP is far below its DOWNtrend It is considered oversold and
likely to turn up soon.
Any close of more than
2.69 ABOVE the Opening will
break the CP DOWN-trendline.
The Opening Power is short-term declining.
QQQ's CP is far
below its DOWN-trend It is
considered oversold and apt to keep rallying.
Any close of more than
1.16 ABOVE the Opening will
restore the CP DOWNtrendline.
The Opening Power is short-term declining.
GLD's
CP is far below its DOWN-trendline,
oversold and apt to keep rallying..
Any close of more than 7.16
ABOVE the Opening will break the
CP DOWN-trendline.
The Opening Power is short-term
risng.
12/20/11 Santa Claus Rally versus December Sell S9.
Tomorrow may open down.
The news that "Oracle
results shock investors, shares plunge "
will hit the QQQ
and SPY most. Bloomberg says that the DJI futures are still up 65, though.
The DJI jumped 2.87% today.
That's a big jump even from an oversold condition
in December at this time. It will probably continue short-term until
the flat resistance
at 12250 is reached. Volume did rise a little today . A breakout
to 12400 would
force a lot of short-covering and give the DJI a "first and ten"
renewal of energy,
so that 12700-12800, may be reached early next year unless we see more Sell
S9s.

Whether we get a new S9 will depend on breadth. If the P-Indicator can
rise by +90, it will turn
positive and this will help avert a new Sell S9. Because of the way the
P-Indicator is constructed,
using a simple 21-day ma, it will jump by about 90 even if the the number of
NYSE
advances is equal to declines. So, I would suggest giving the DJI a
chance here
to make a breakout above the flat and well-tested 12200-12250 level.
Peerless has
always appreciated their bullishness if they are confirmed by good internals
even
if no automatic Buy B10 occurs.
What To Do
The Closing Power did turn up as we expected. DIA was suggested for
purchase a night ago along with some of the bullish MAXCP stocks. The
number of Short Sales should have been reduced at the opening Tuesday.
Breaks in the CLosing Power downtrend-lines should be used to cover
other shorts, in my opinion.
Hot money tends to be poured into fewer and fewer stocks, the longer a
bull market lasts, making those that do make new highs near the end of the
market's advance rise relatively steeply. Profit-taking in these stocks
may be
postponed until 2012 while year-end window-dressing will add fuel to their
rises.
Look at the bullish MAXCP stocks for some trading ideas on the long side,
for sure. But consider the best recovering stocks today from among the year's
best performers, as shown in the SUPER11 stocks. Add as a consideration
"IP21",
the current level of Accumulation. This screening presents us with:
Close
AI/200 IP21
SIMO
Silicon Motion 20.83
128 .21 Taiwan
semiconductors
HCCI
Heritage Crystal 19.00 168 .36
hazardous waste services
Among the Bullish MAXCP stocks, here are the highest IP21 stocks now.
Close
AI/200 IP21
PVSA
Parkvale Fin. 24.29
139 .419 PA savings and loan
LQDT
Liquidity Srvcs 38.04 189 .35
DC online auction
marketplace
SIMO Silicon
Motion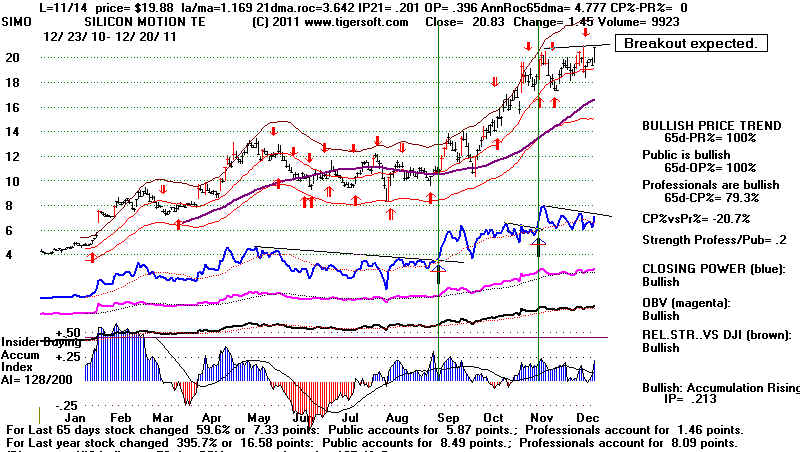 |
HCCI Heritage
Crystal 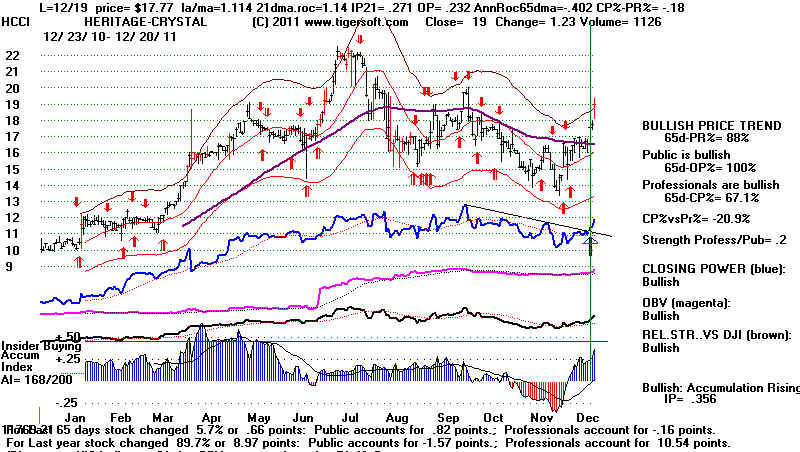 |
PVSA Parkvale
Fin. 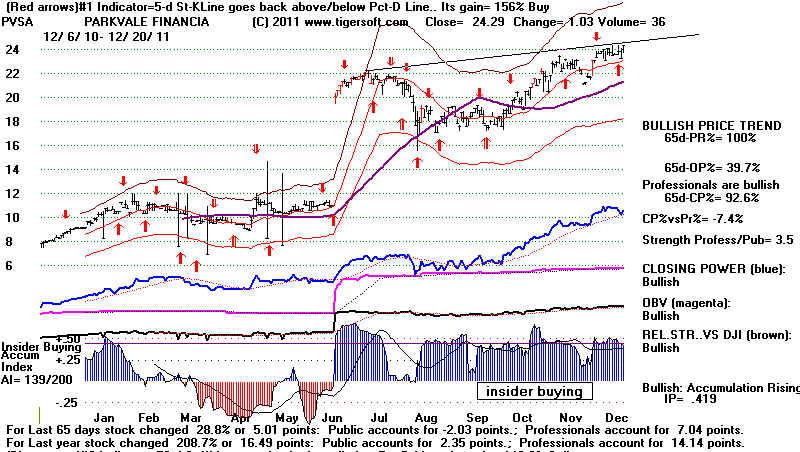 |
LQDT Liquidity
Services 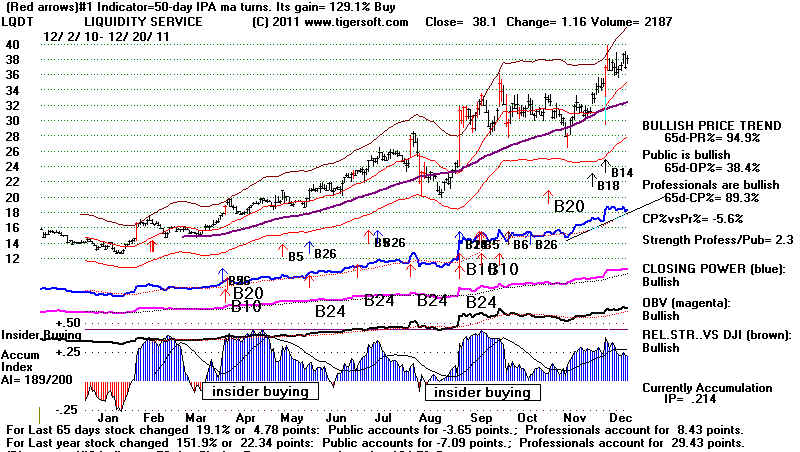 |
.
=====================================================================================
OLDER HOTLINES
=====================================================================================
12/19/11
DJI = 11766 la/ma= 995 21-dma ROC= -.004 P= -167 IP21= -.128 V= -93 OP= -.1 12/19//2011 GRAPHS===> See Key Peerless TigerSoft Index Charts: Industry Groups
and ETFs
Most groups still have a plurality of stocks below their 65-dma. Defensive groups are still favored. BEARISH
DIA SPY QQQ
DJIA-Peerless TigerDJI TigerSPY
TigerQQQ GLD
SLV Crude
12/19/2001 ===> Closing Power (CP) Status Report: KEY ETF CHARTS:
The ETFs CPs are all in
Down-trends. This is short-term
BEARISH
DIA' s
CP iS in a DOWNtrend It is considered oversold and likely to turn
up soon.
Any close of more than ABOVE the Opening will break the CP DOWN-trendline.
The Opening Power is short-term declining.
SPY's CP is in a DOWNtrend It is considered oversold and likely to turn
up soon.
Any close of more than
ABOVE the Opening
will break the CP DOWN-trendline.
The Opening Power is short-term declining.
QQQ's CP is in a DOWN-trend It is considered oversold and likely to turn up soon.
Any close of more than
ABOVE the Opening
will restore the CP DOWNtrendline.
The Opening Power is short-term declining.
GLD's
CP is in a DOWN-trendline and
oversold. Any close of
more than ABOVE
the Opening will break the CP DOWN-trendline.
The Opening Power is short-term
risng.
12/19/11 Clinched SELL S9 vs Santa Claus Rally (Old
B13)
Cover Many of the Profitable Bearish MINCP Short Sales.
Wait for the Closing Power to Turn up To Buy DIA Short-Term.
Bank Stocks Look DIsmal. Wall Street May Soon Be Outsourced.
There a two ways I see to interpret the
extreme Closing Power divergence now from
the rising Opening Power. The most benign is that Professionals are artificially
dropping
prices towards the close to hold the market back while they take in stock in advance of
a year-end rally. The more bearish interpretation is that Professionals and
Institutional
fund managers are selling in a big way because of dangers they foresee and Overseas buyers
are buying at the Opening from market makers who are shorting the openings now regularly.
Which view is more correct?
Time will, of course, tell. We cannot get a Buy B13 (as we used to) because of the
Sell S9 on 12/5/2011. B13s cannot now appear until 20 trading days has elapsed
since an S9.
Therefore, we are most likely to get a minor one / two week bounce, as in 1999 and 2007,
with
January bringing a sell-off. Remember that the Sell S9 is not reversed yet.
The Closing Powers are reaching oversold status. Any close much above the Opening
should probably be considered a short-term Buy. We will take profits in a few of our
short sales tonight and
buy some of the most bullish MAXCP stocks early tomorrow. Keep in mind that tax loss
selling
in the weakest stocks often lasts right up to the last day of the year while profit-taking
in the
best performing stocks very oftem is delayed for tax reasons to the next year.
As for DIA, the rally may be short-lived just as it was in 2007. Compare the
2007-2008 DIA and QQQ charts immediately below with the current DIA and QQQ charts which
follow. Only short-term traders should Buy DIA on a Close by it above its Opening.
Note that the DIA is significantly stronger and therefore safer than QQQ, I think.
Many, many Americans would judge Wall Street has been "bad" this year, not just
naughty, when it comes to fraud, theft
of funds, obscene
executive pay, Swiss
bank account collusion, manipulating
markets, rampant
insider trading, buying
politicians, exporting
jobs and breaching
fiduciary responsibilities and putting
their own interests above their clients...
Still, it's likely that Santa
will visit Wall Street and boost stock prices as he usually does in the next two weeks.
Perhaps,
because Santa has "sold out", been "bought out" or threatened with
out-sourcing!

Wall Street, Obama and the Fed have
no choice but to
get the Market to recover now. If it does not, and falls
back to 6500, say, in the coming election year,they will all
have their power challenged in a way the country has
not seen since the 1930s. I doubt if Obama will still
be able to protect Wall Street amd deflect Main Street's
anger away with empty populist rhetoric.
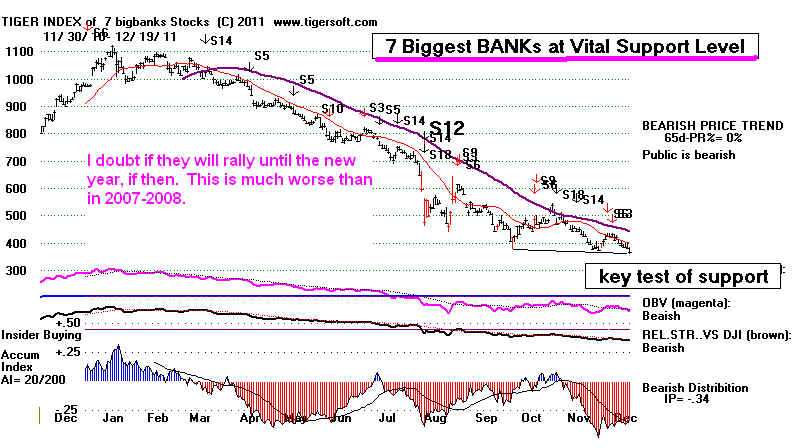
This is a dire-looking chart of the 7 biggest
banks. I think Wall Street itself
will soon be
outsourced. This reminds me of when the NKVD under Stalin in the 1930s
turned on itself, just
as the Reign of Terror in the French Revolution ultimately
did.
Even if Santa Claus does show up, the danger remains that a narrow, low-volume rally
now may produce another S9 or S12 early next year. And by rebounding, it will
make the unsuspecting public and value-minded investors believe as in January 2008
that all dips
are good buying opportunities. Most emphatically, they are not if Peerless has
rendered
numerous major Sells in the previous 6 or 8 months.
For now, let's see if we can get a year-end rally.
DIA - 2007-2008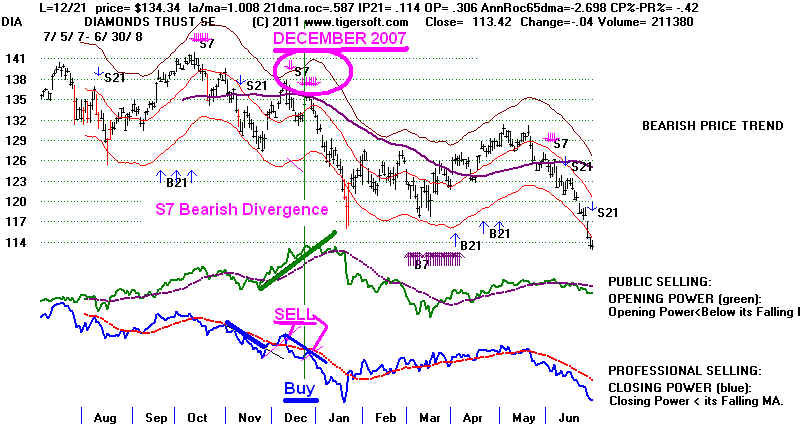 |
QQQQ - 2007-2008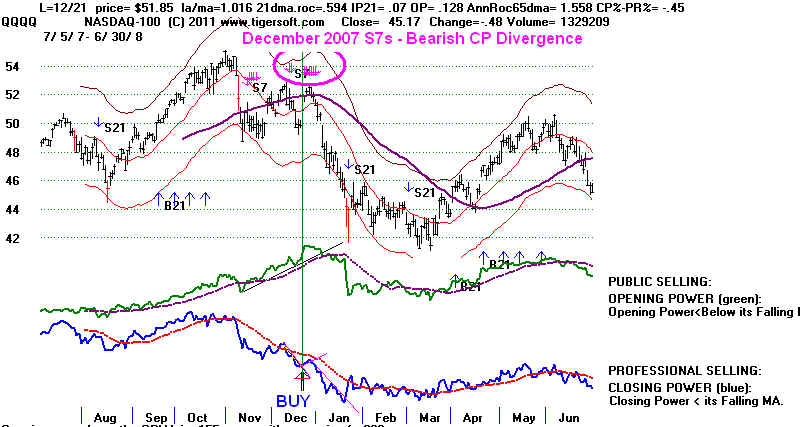 |
Current DIA - 2011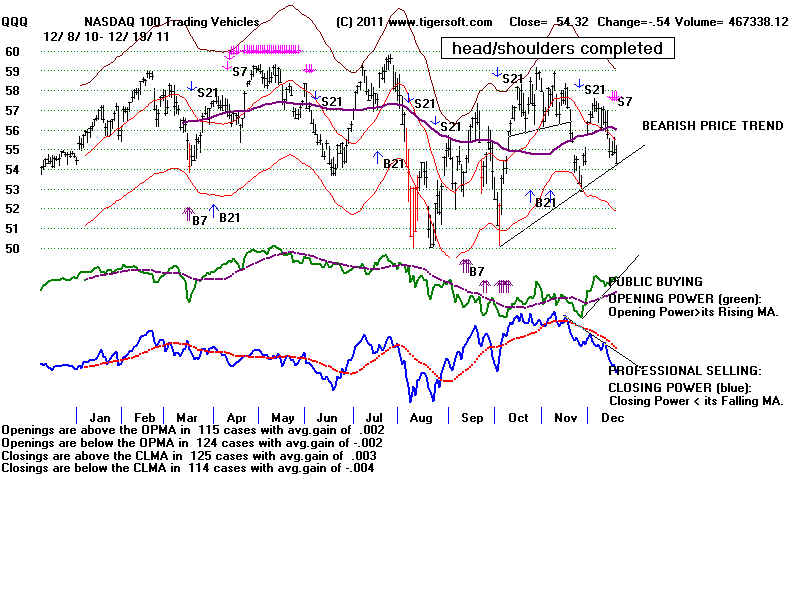 |
Current QQQ - 2011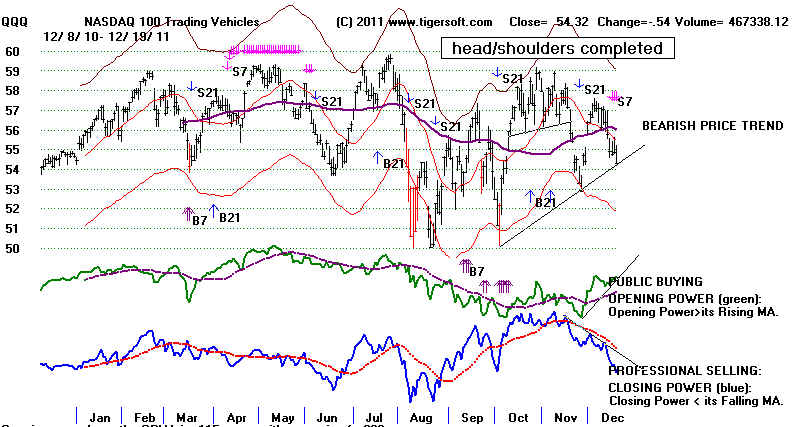 |
I do not consider us to have gotten a Santa Claus Buy B13 now.
But below is the track record of B13s where S9's prevent a
B13 for 15 trading days. B13s occur on the first DJI close
below the 21-day ma after December 16th and before
December 25th. It will be finished, posted and made into
a regular Peerless signal. 3 of the 41 cases brought a paper loss
of more than 4%.
Buy B13s: 1929-2011
Date Gain
Paper Loss
Internals
la/ma ma-roc
P-I
IP21 V-I
OPct
12/17/28 15.7%
none
.961 .034 -38 -.027
-518 .044
12/18/29 1.3%
5.7%
.999 .875
42 .116
-47 .034
12/17/30 3.8%
none
.926 -.988 -125 .034 -599
-.246
12/17/31 5.8%
3.5%
.833 -4.28
-242 -.285 -936 -.543
12/20/32 6.0%
3.7%
.984 -.814
-75 -.090 -186 -.143
12/18/33 12.0%
1.95%
.974 -.215
-42 -.226 -158 -.107
12/17/34 4.9%
1.3%
.993
.141 28 -.029
-7 .313
12/17/35 9.1%
none
.980 .472 -51 -.214 -303
-.01
12/17/36 13.0%
2.7%
.997 -.269 -54 -.143
-264 -.234
none in 1937 - 1940
12/17/41 2.4%
1.6%
.993 -.461 -58
-.129 -95 -.112
none in 1942 - 1945
12/17/45 4.6%
0.7%
none in 1947 - 1952
12/22/53 7.0%
0.6%
none in 1954 - 1952
12/19/55 7.6%
4.0%
none in 1956
12/17/57 Big Gain
none
none in 1958-1960
2/18/61
-1.8%
1.8%
2/18/62 9.6%
none
none in 1964-1965
12/19/66 11.1%
1.7%
none in 1967-1968
12/17/69 5.2% none
none in 1970-1971
12/18/72 3.4%
1.3%
12/17/73 5.4% none
12/17/74 Big Gain none
12/22/75 20.3% none
none in 1976
12/19/77 -1.8%
1.8%
none in 1978-1979
12/17/80 4.8% none
12/17/81 -4.3% 8.6%
B13 could not reversed a Sell in a Bear Market.
none in 1982
12/19/83 3.4% none
12/17/84 big gain none
none in 1985
12/18/86 25.8% 0.8%
none in 1987 -1988
12/18/89 4.2% none
none in 1990
12/17/91 13.9% none
12/17/92 big gain 0.5%
none in 1993-1994
12/17/95 9.3% 0.8%
12/17/96 8.3% none
12/18/97 17.1% 2.5%
12/17/98 22.3% none
none in 1999
12/19/00 6.3% 2.5%
12/17/01 2.3% 2.8%
12/17/02 2.8% 2.3%
none in 2003-2004
12/19/05 6.8% 1.6%
none in 2006-2007
12/22/08 5.8% none
*12/17/09 1.0% 4.8%
(*There has been an S9 on 11/13/2009 )
none in 2010-2011
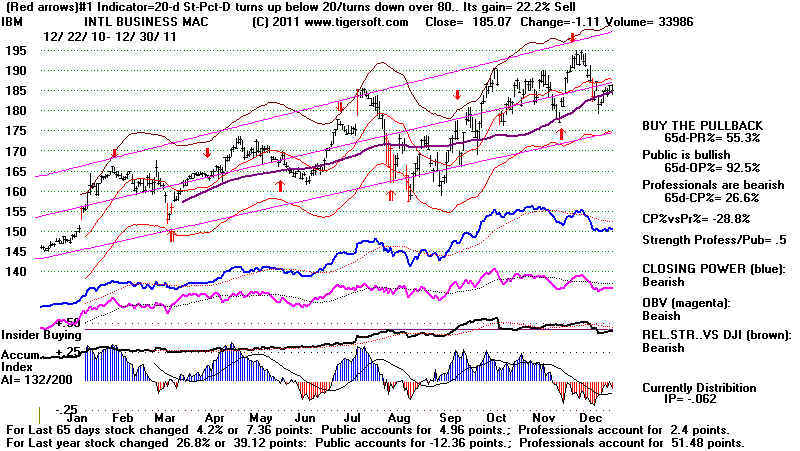
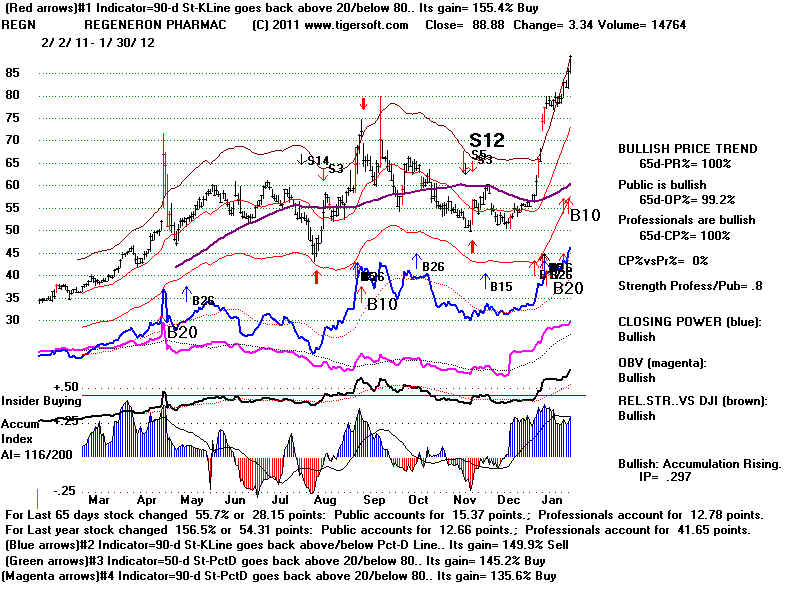
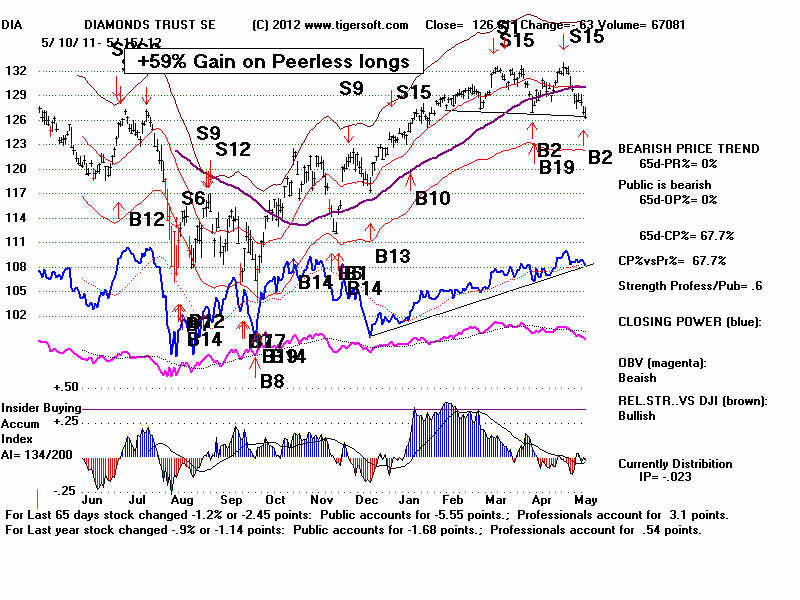
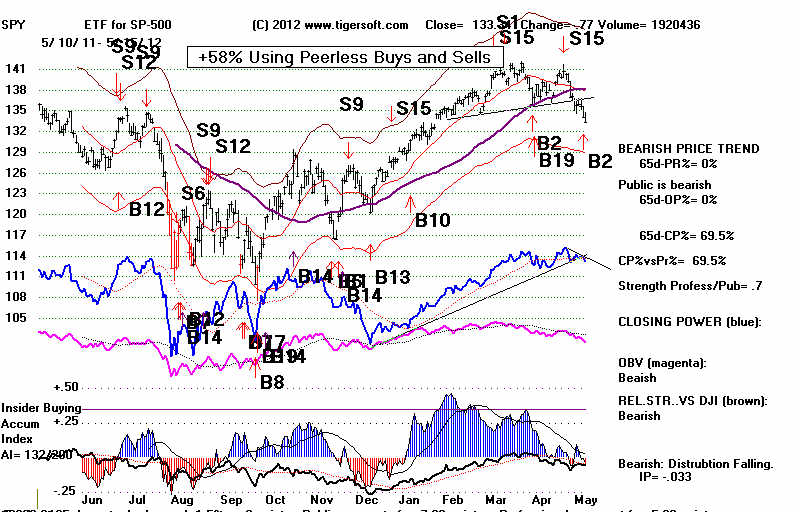
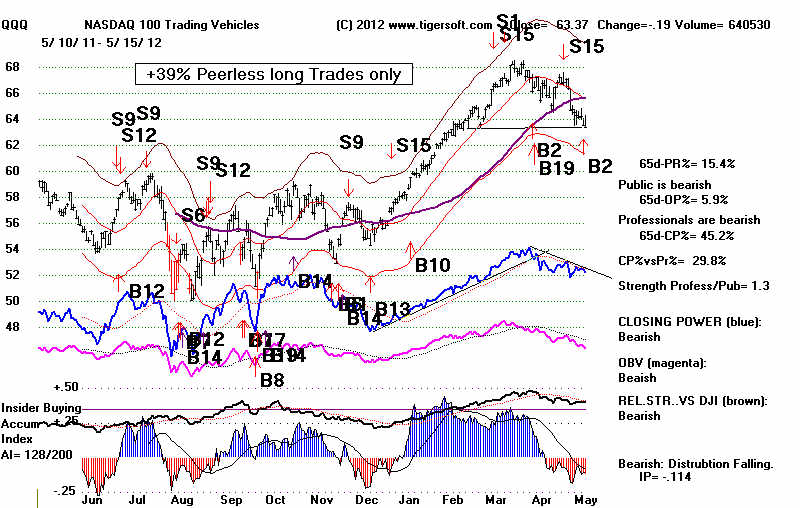
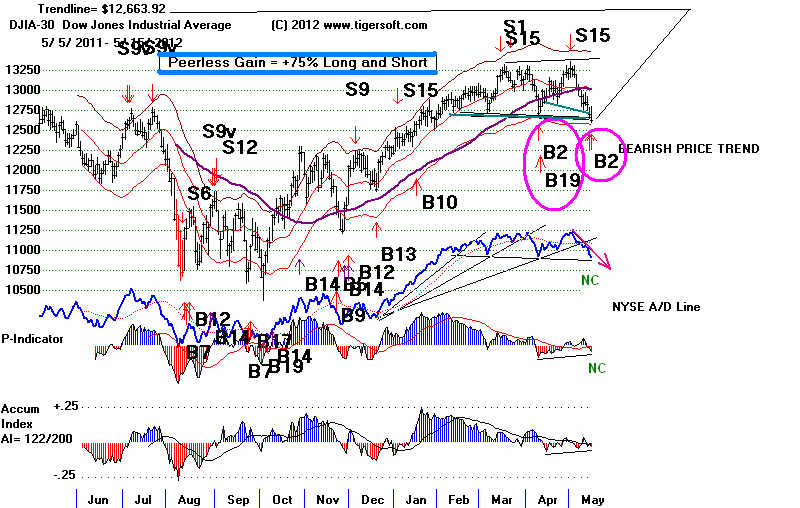
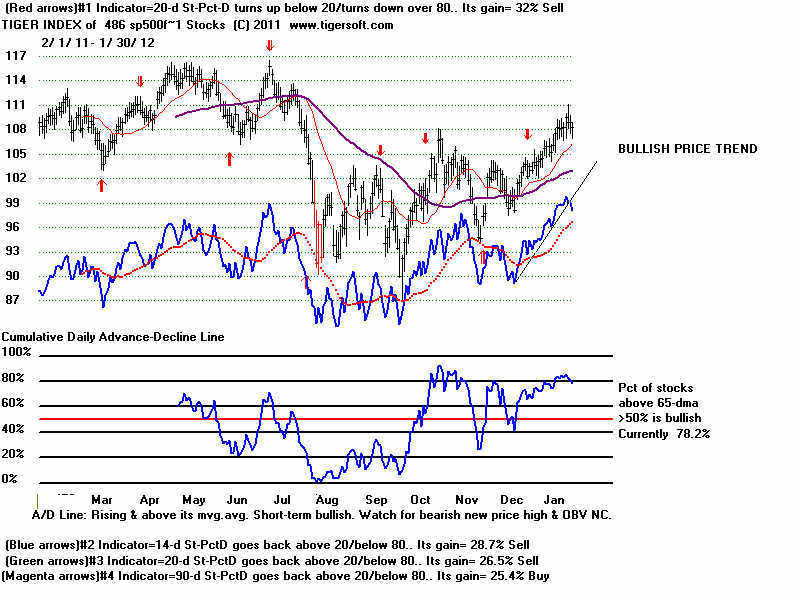
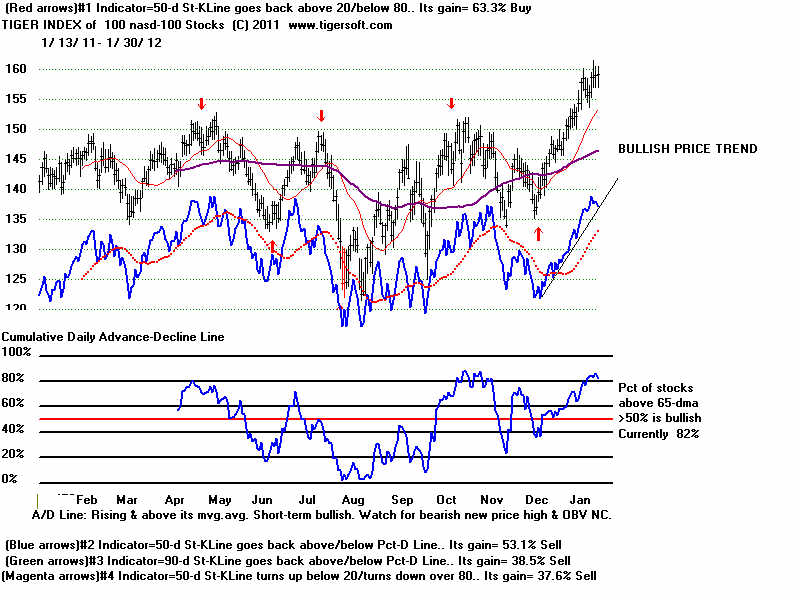
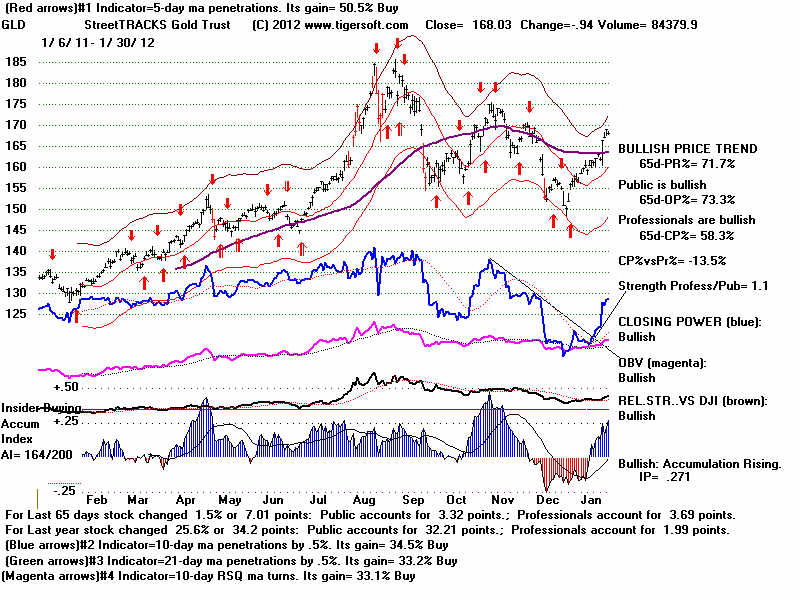
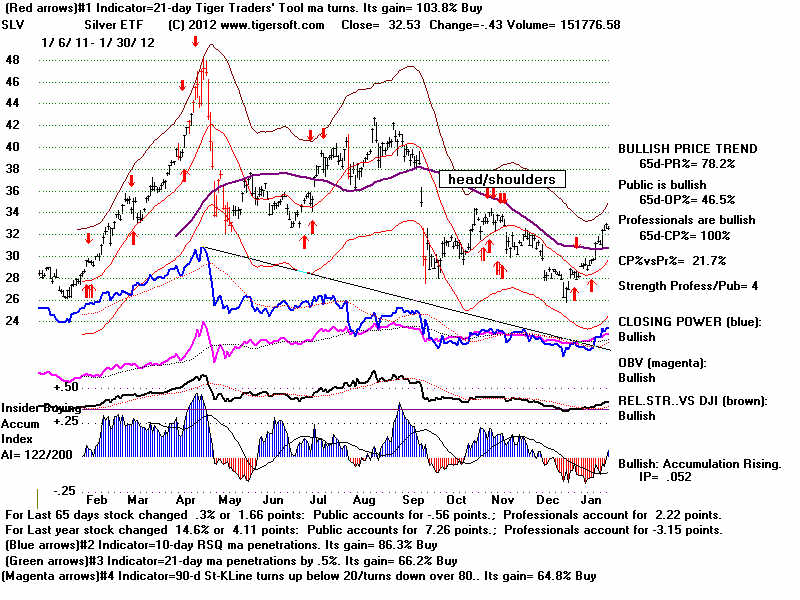
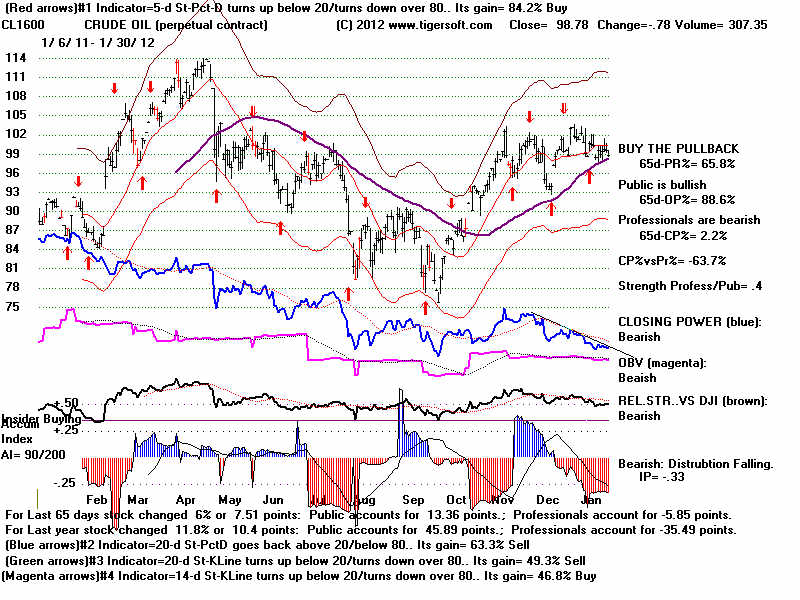
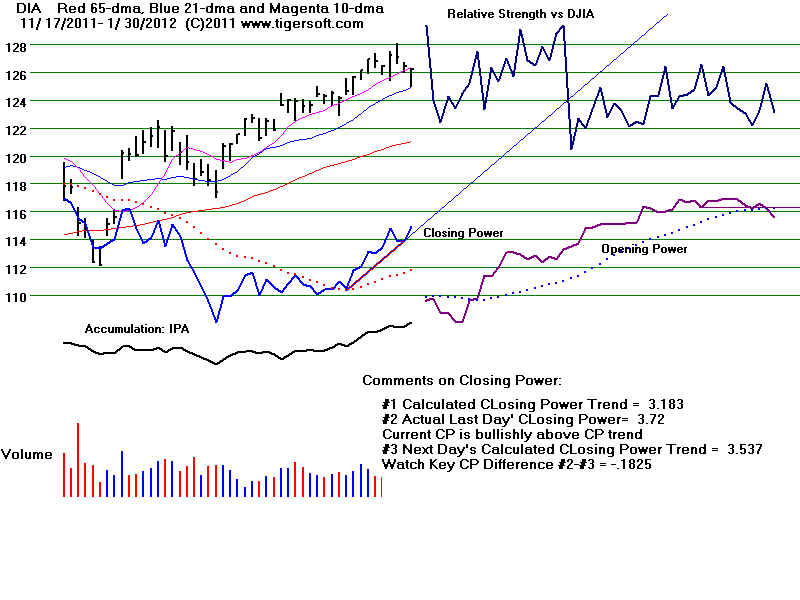
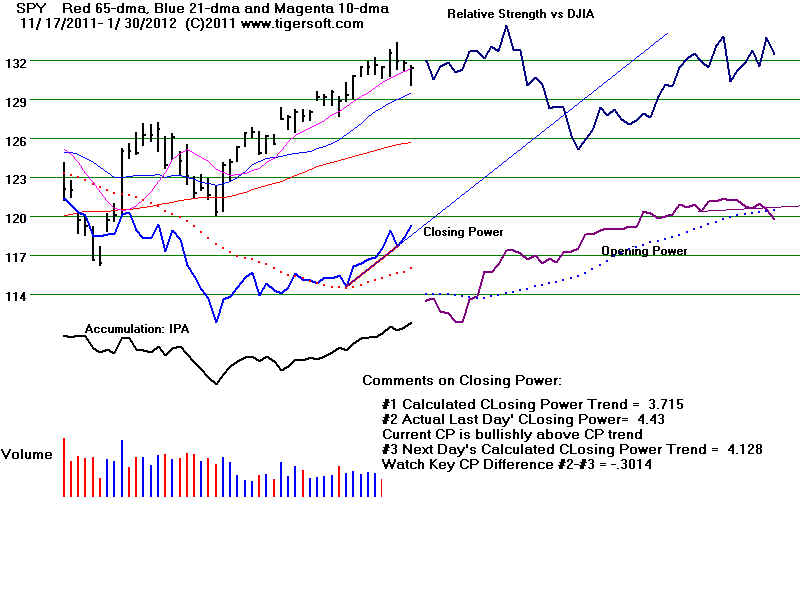
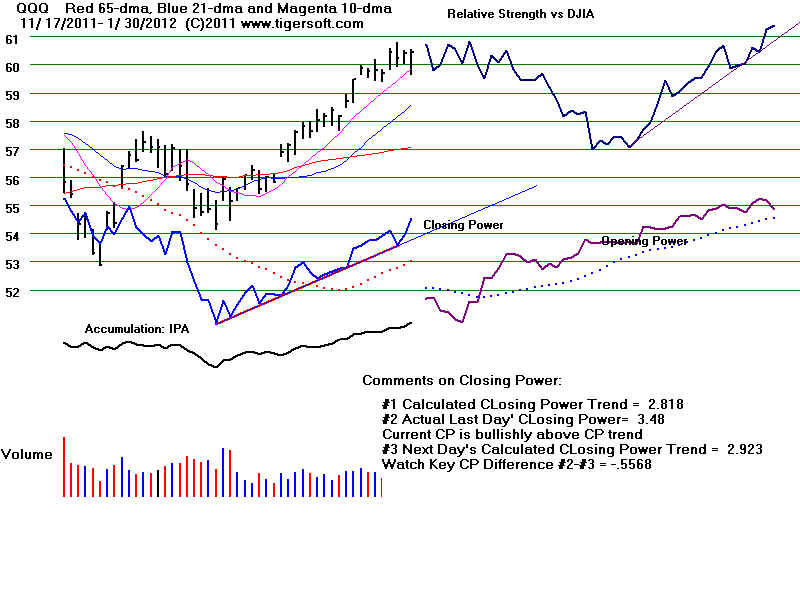
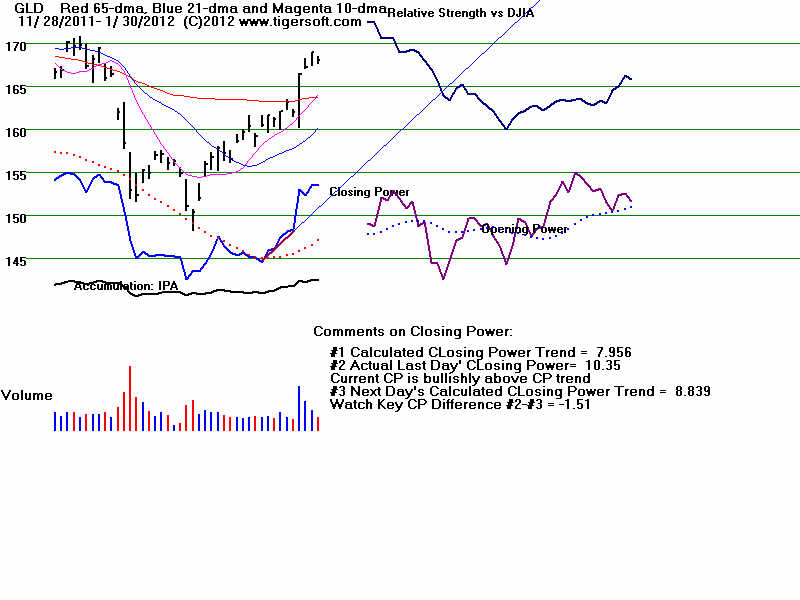
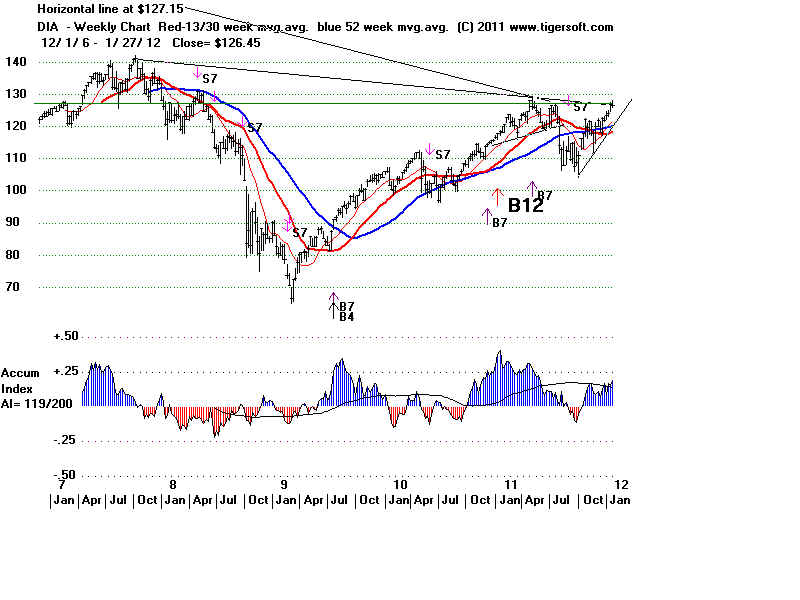
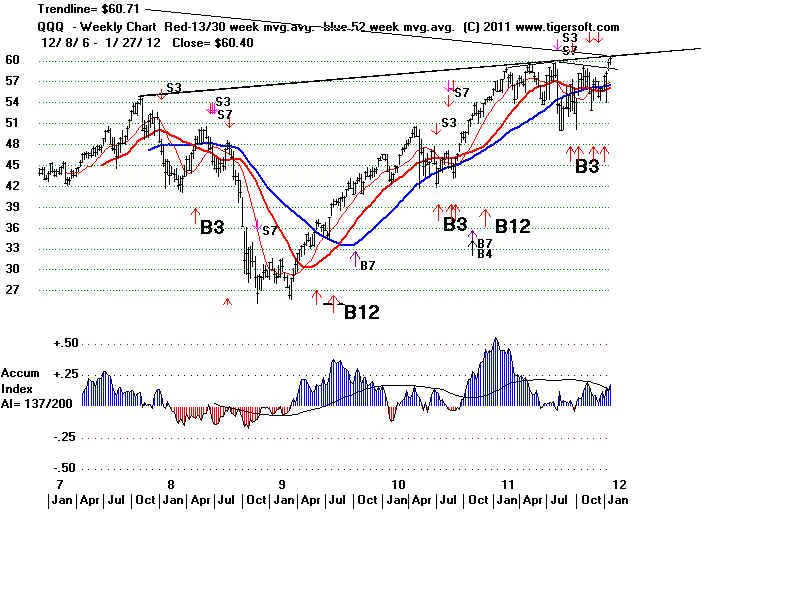
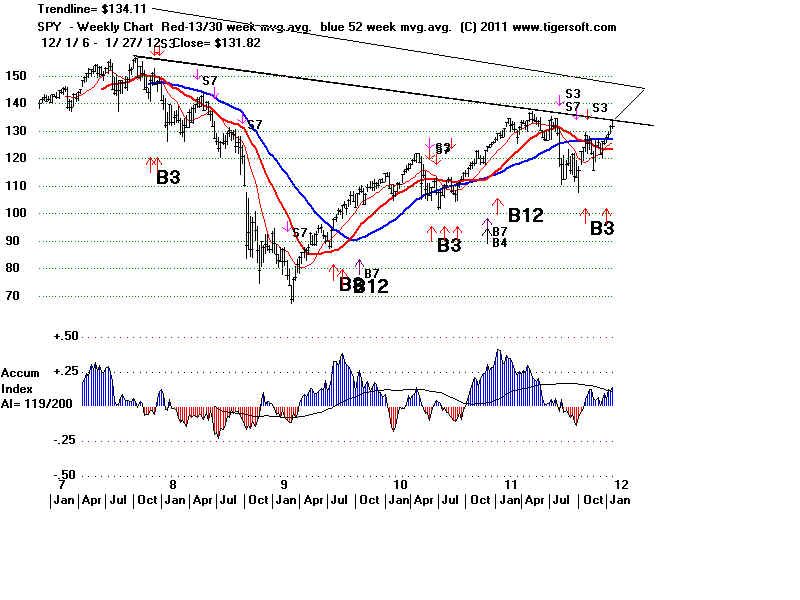
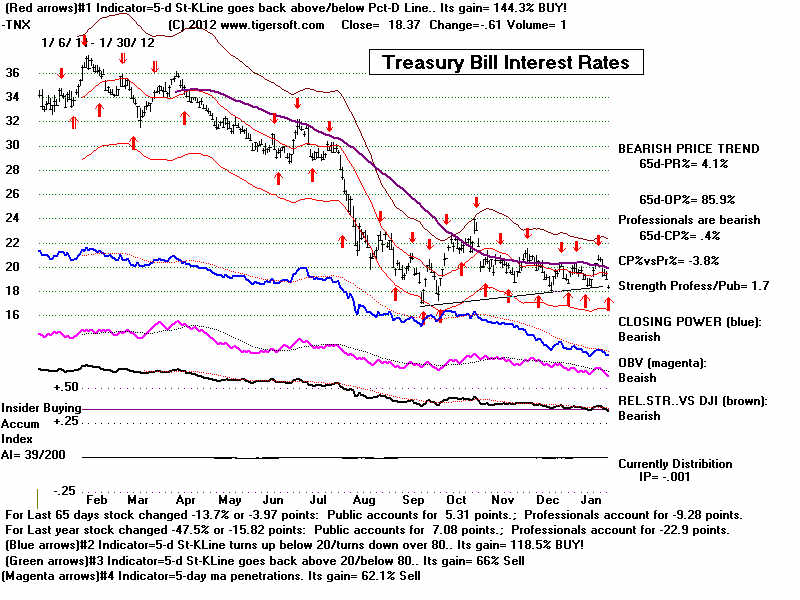
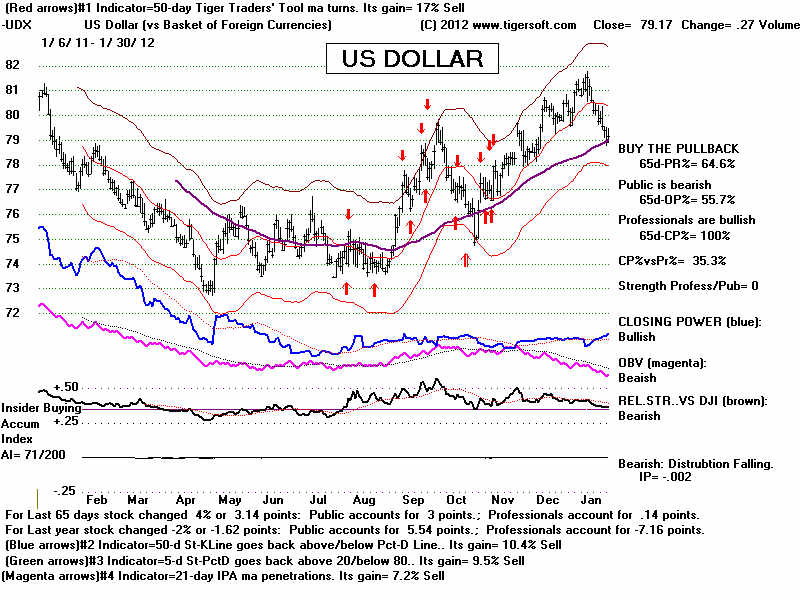
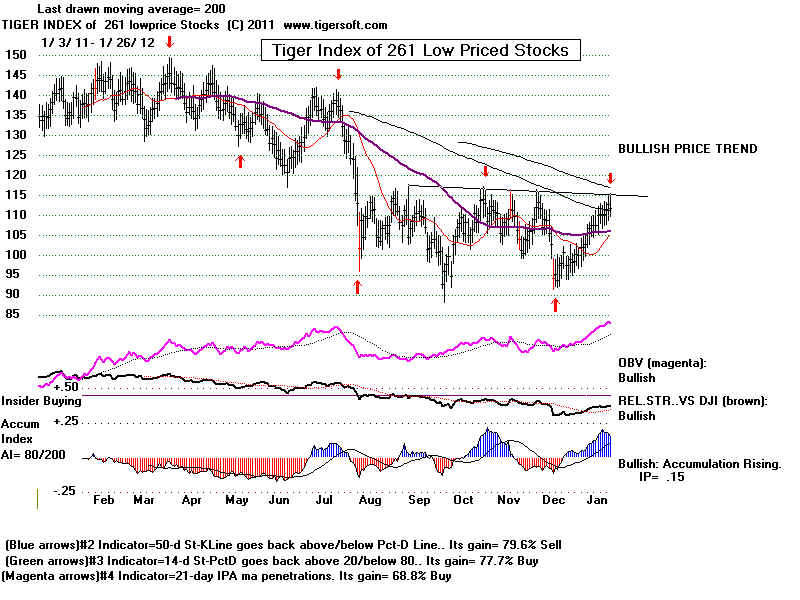
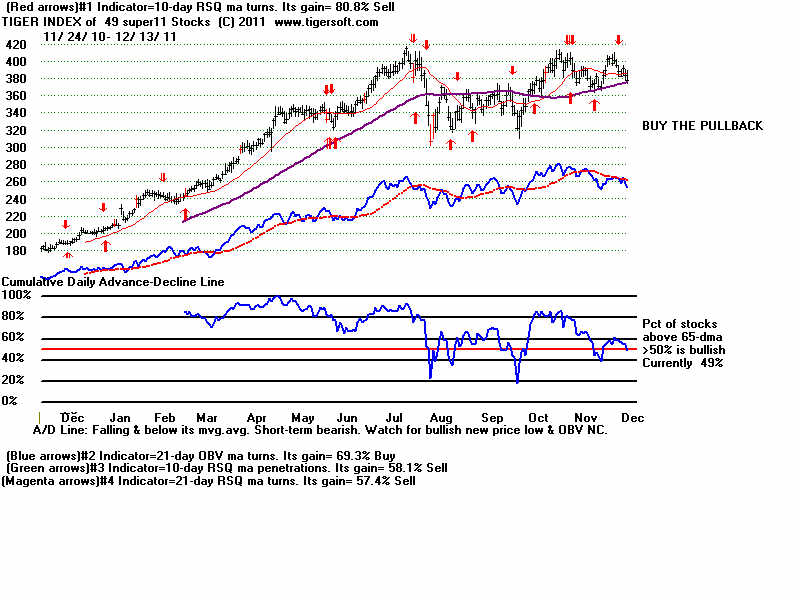
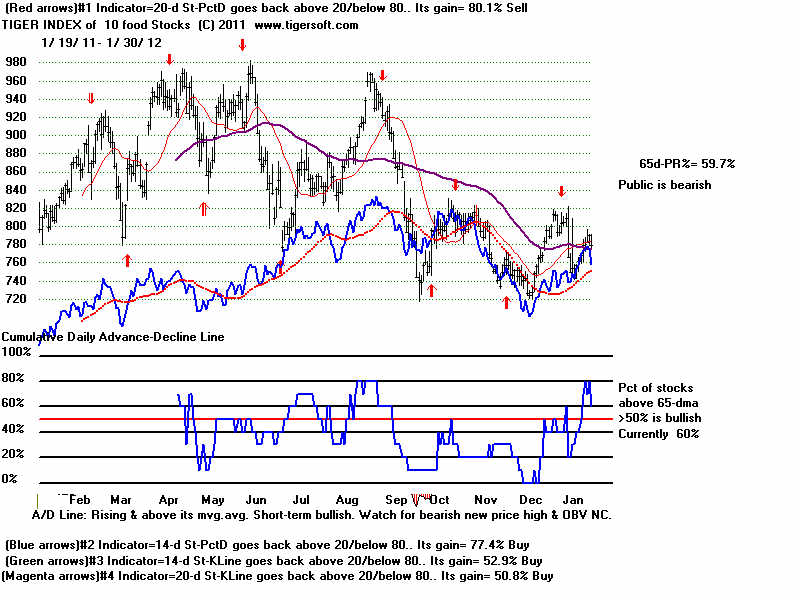
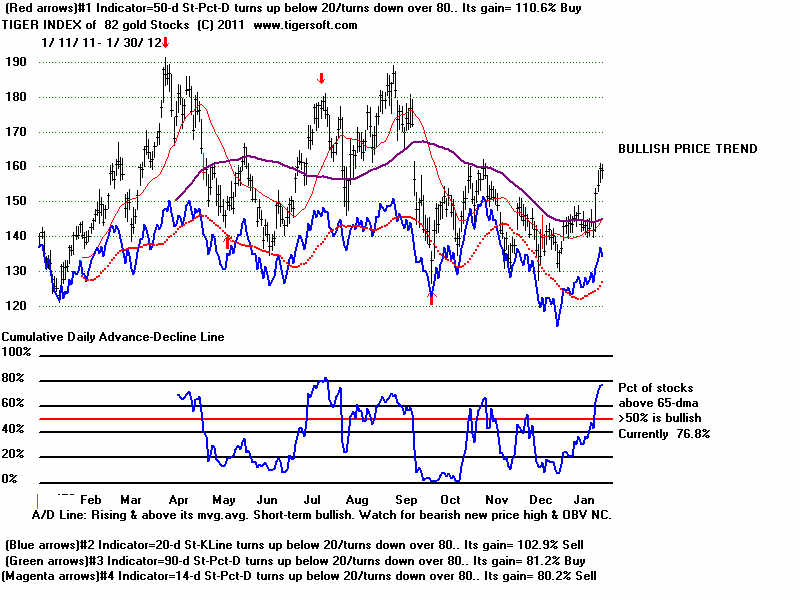
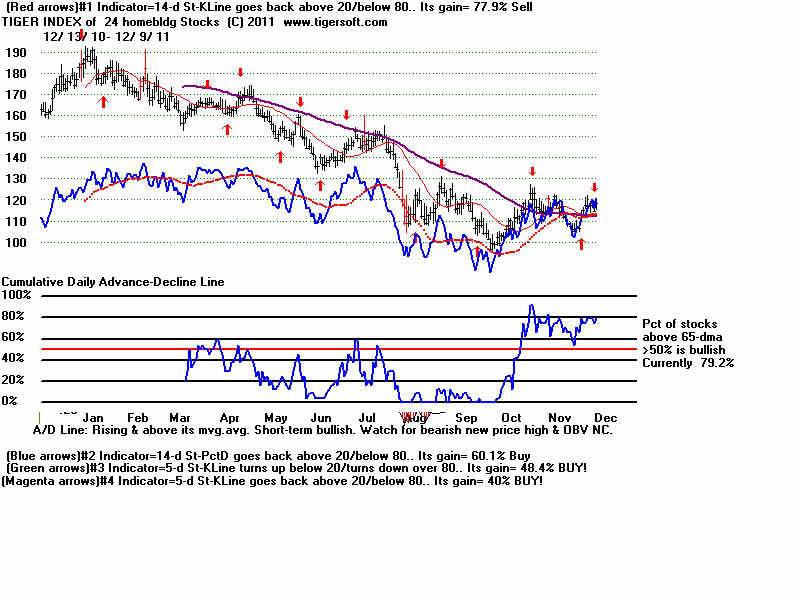
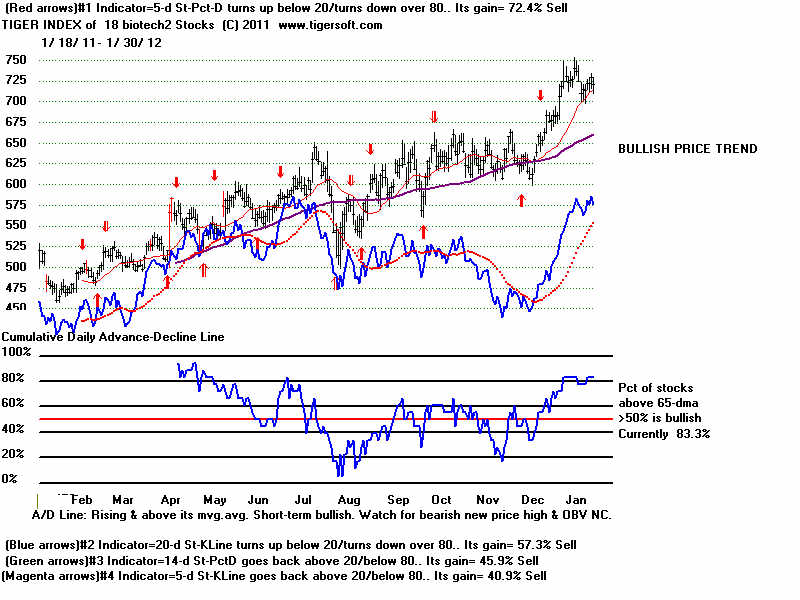
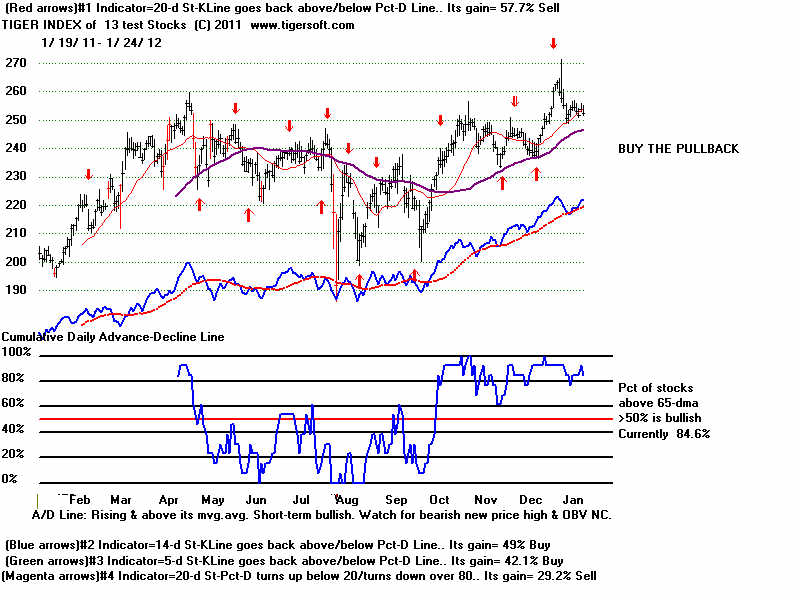
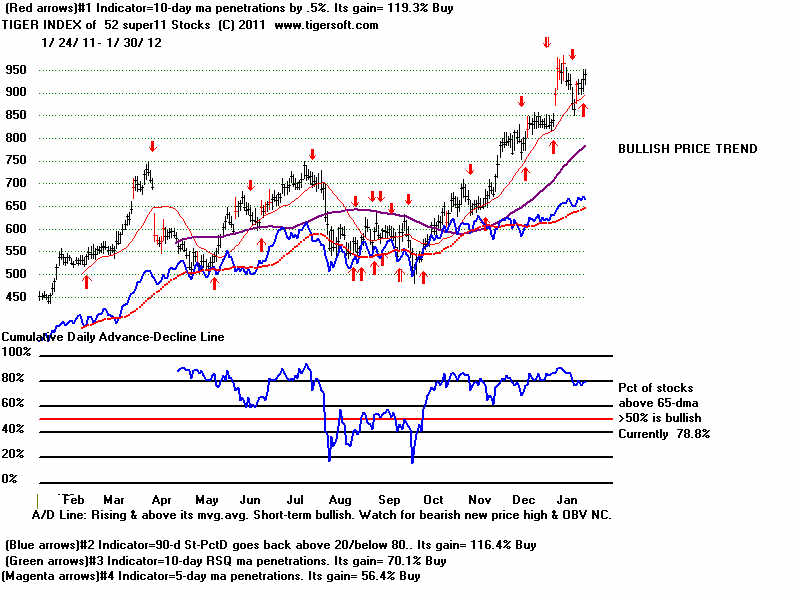
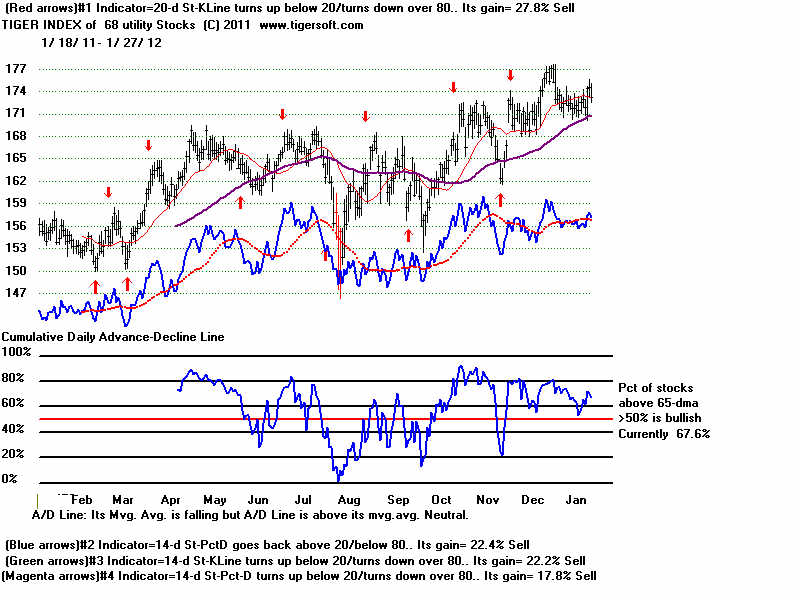
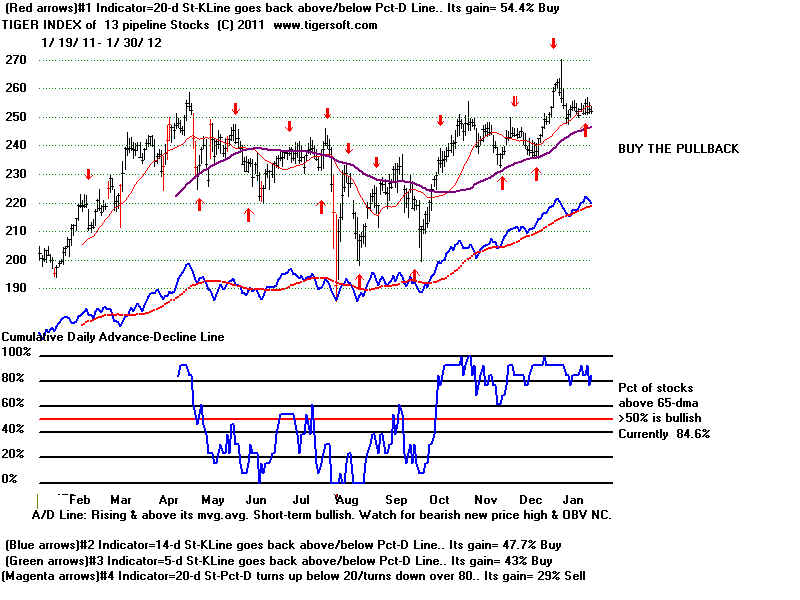
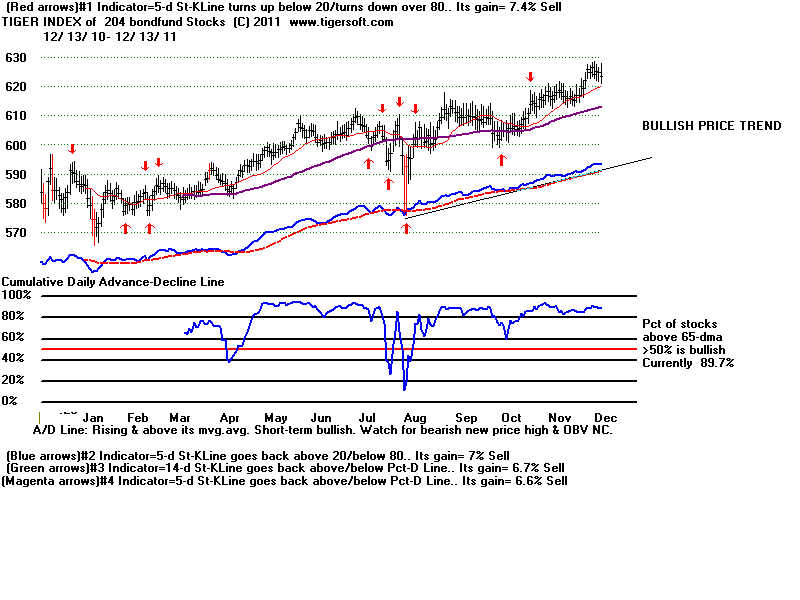
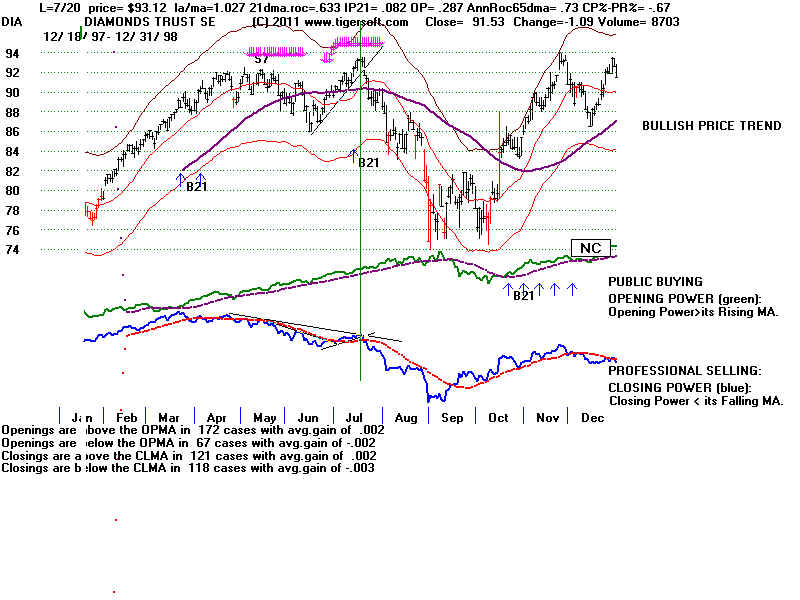
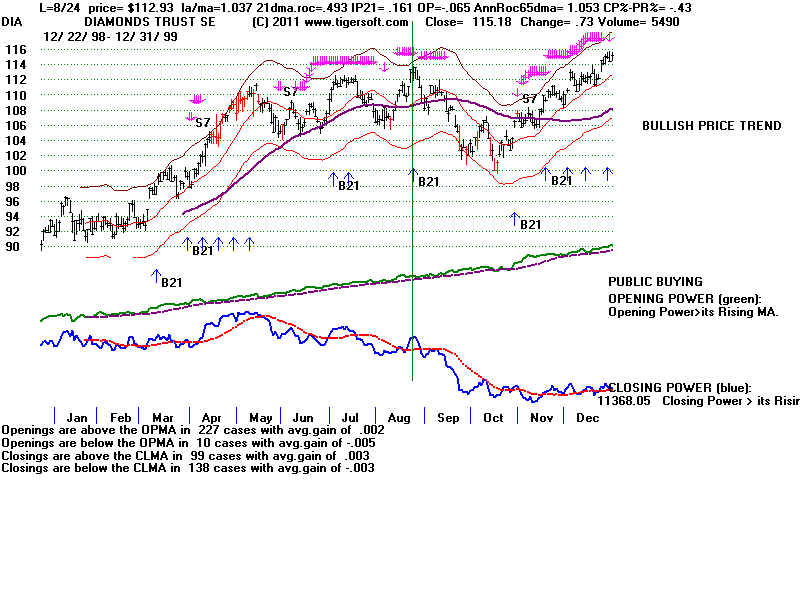
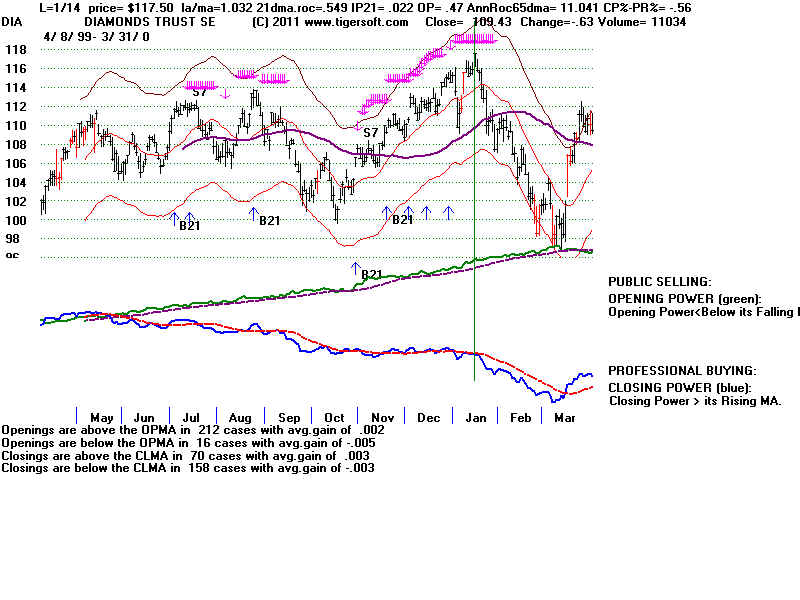
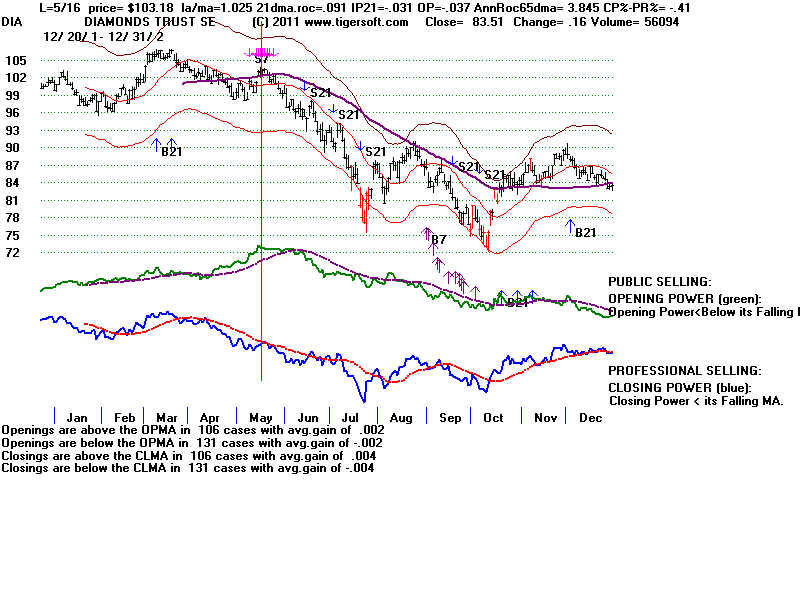
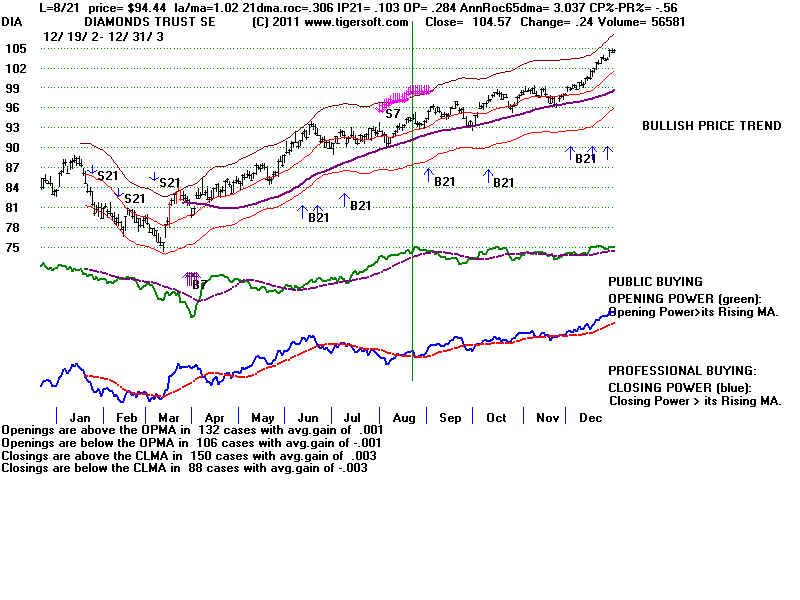
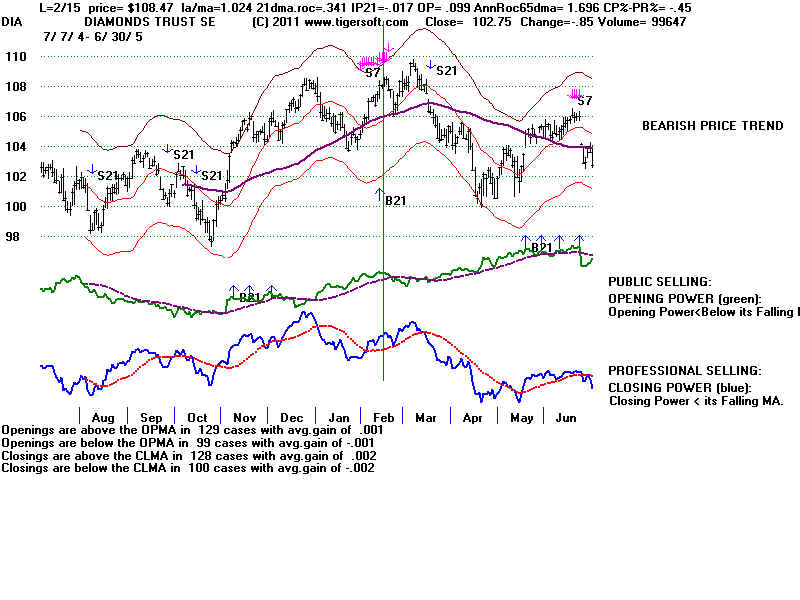
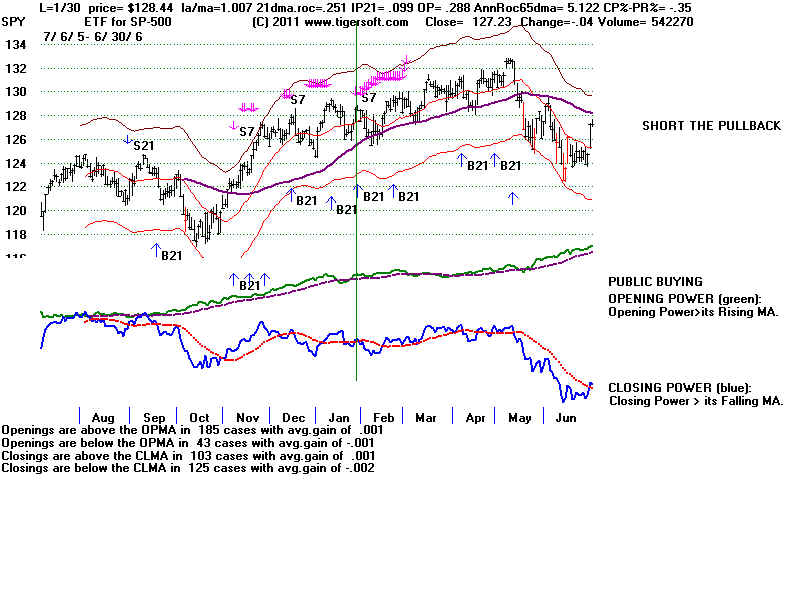
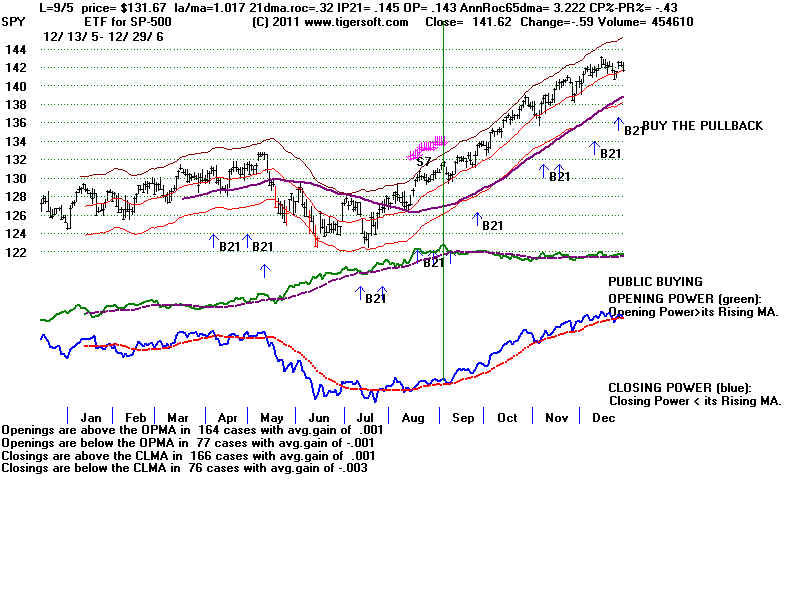
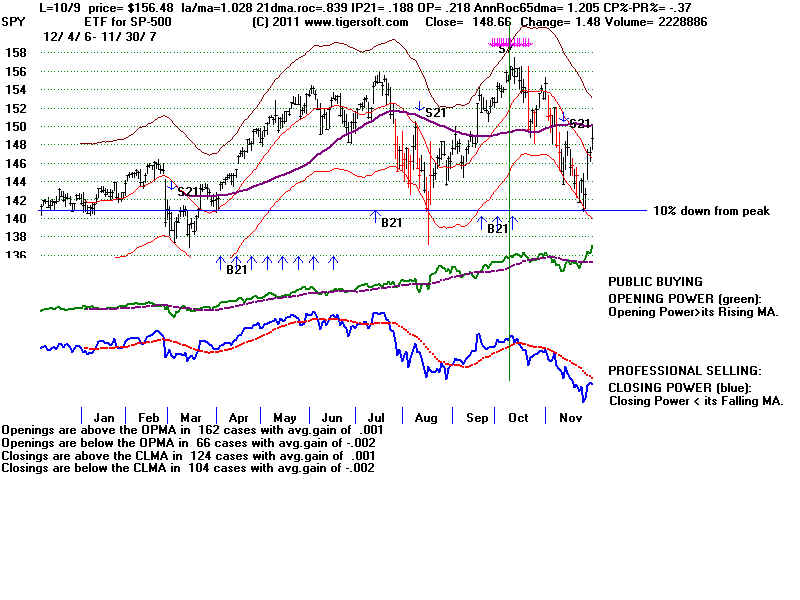
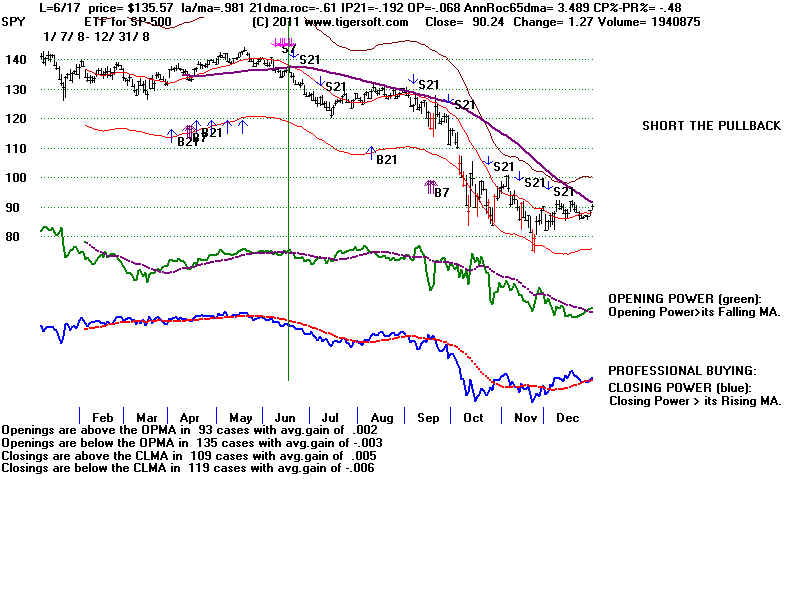
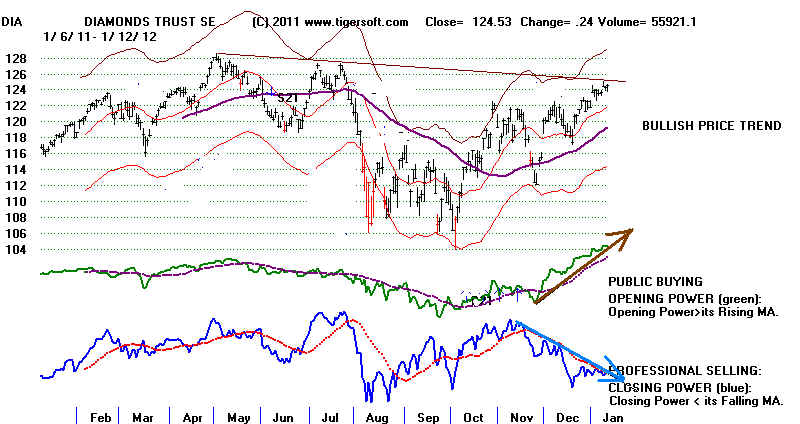
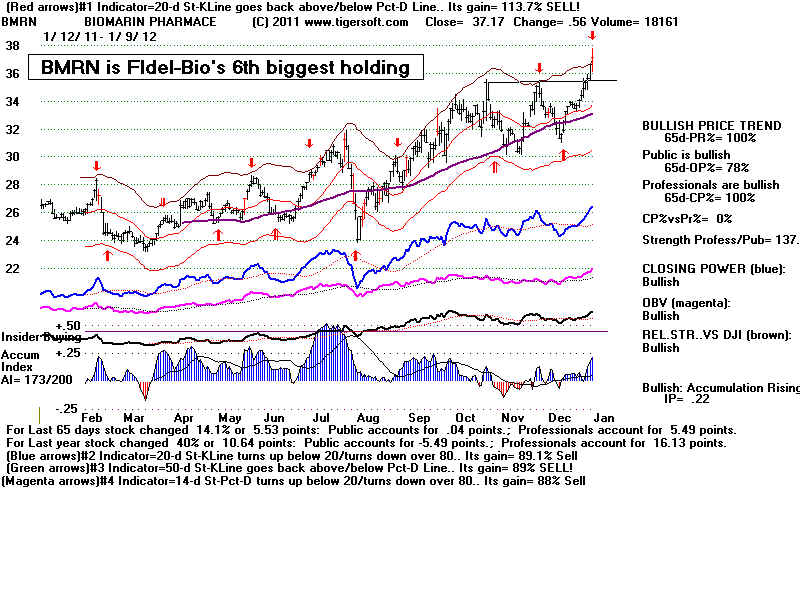
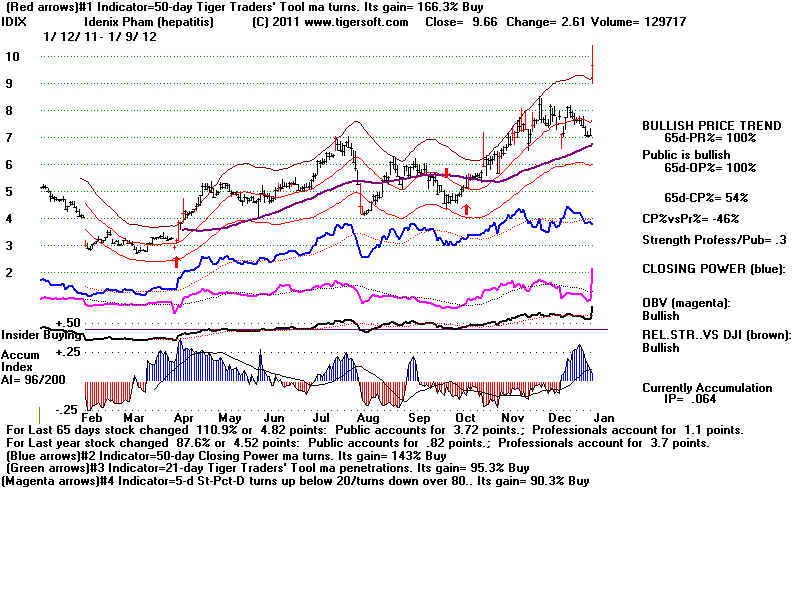
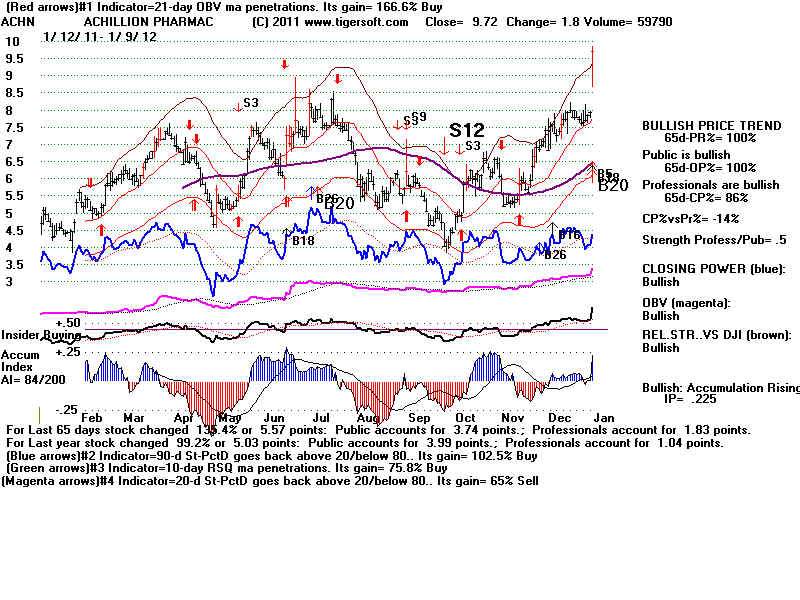
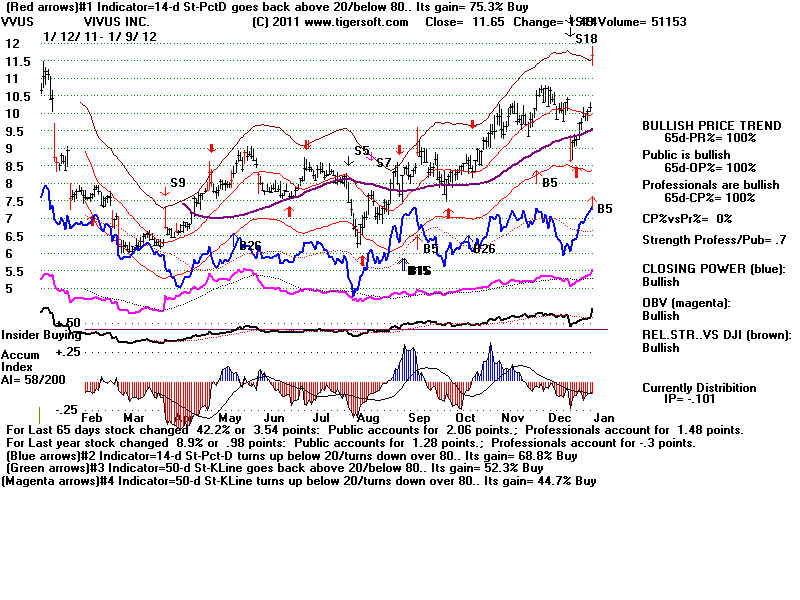
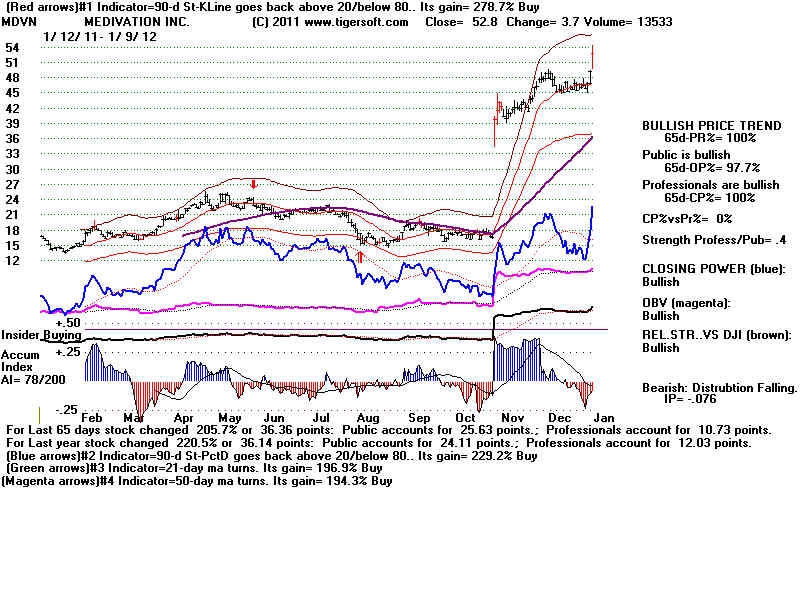
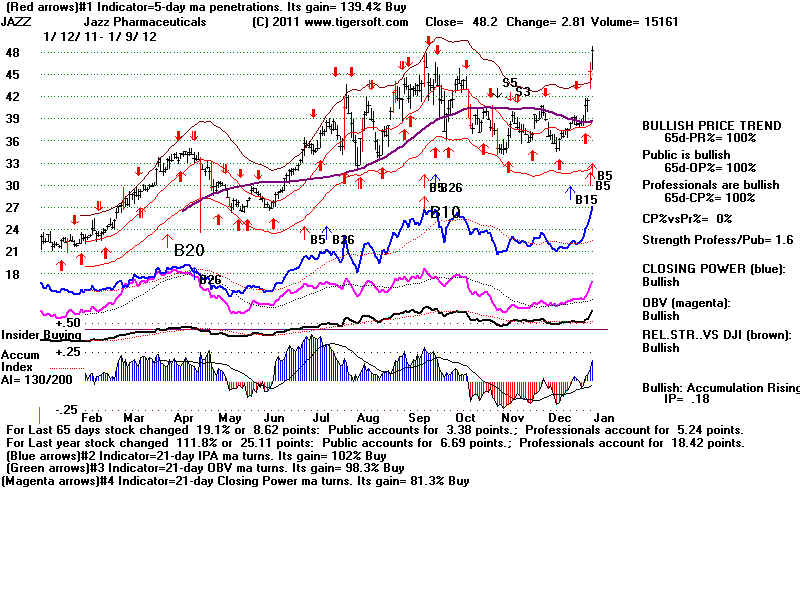
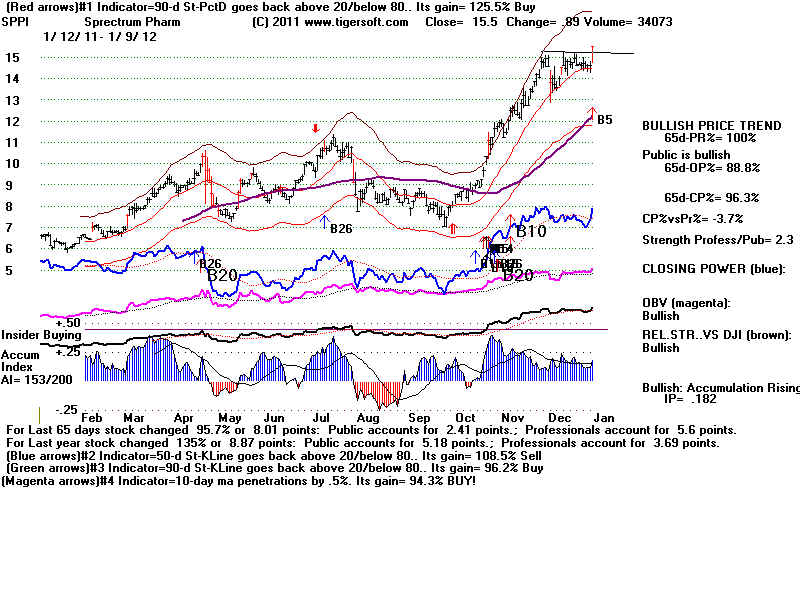
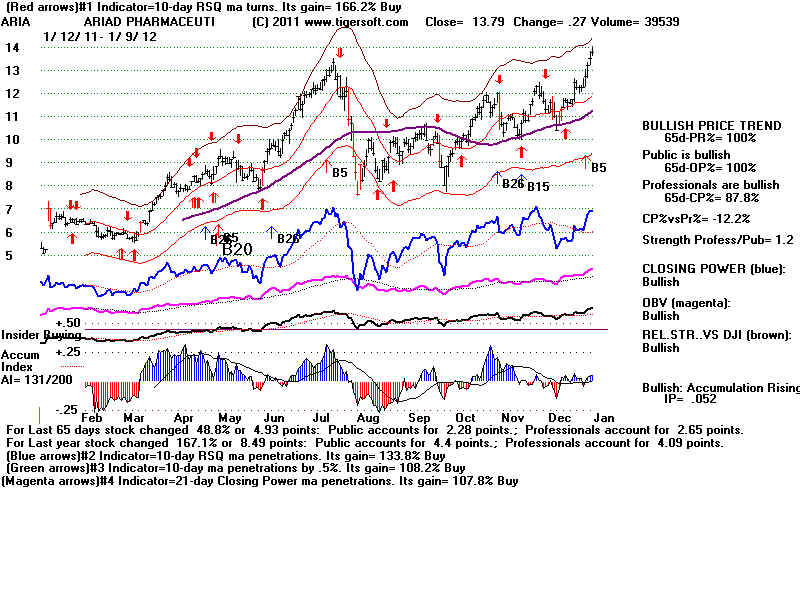