- SANTA FE GOLD CORP Files SEC form 8-K, Entry into a Material Definitive Agreement, Financial Statements and ExhibitsEDGAR Online(Mon, Jan 9)
- Santa Fe Gold Obtains Financing to Proceed with Columbus Silver AcquisitionBusiness Wire(Thu, Jan 5)
- SANTA FE GOLD CORP Files SEC form 8-K, Entry into a Material Definitive Agreement, Unregistered Sale of Equity SecuriEDGAR Online(Fri, Dec 30)
- Santa Fe Gold Announces New $20 Million Credit Facility and $5 Million Revolving Facility with Waterton Global and Conversion of $13.5 Million Senior Secured Convertible Debentures Due December 31, 2012Business Wire(Fri, Dec 23)
- Santa Fe Gold Signs Definitive Agreement to Acquire Columbus SilverBusiness Wire(Thu, Dec 15)
- SANTA FE GOLD CORP FinancialsEDGAR Online Financials(Thu, Nov 17)
- SANTA FE GOLD CORP Files SEC form 10-Q, Quarterly ReportEDGAR Online(Wed, Nov 9)
- Santa Fe Gold Reports Strong Operating Results for September QuarterBusiness Wire(Wed, Nov 9)
- Q1 2012 Santa Fe Gold Corp Earnings Release - Time Not SuppliedCCBN(Wed, Nov 9)
- SANTA FE GOLD CORP Files SEC form 10-K, Annual ReportEDGAR Online(Tue, Sep 13)
 Daily Blog - Tiger Software News Service January 15, 2012
Consider SFEG - Santa Fe Gold.
Speculators,
I want you to discover the importance
of waiting for Insider Buying and Bullish Closing
Power
dIvergences from Price as Measured by TigerSoft Charts.
This is a presentation on how to use Tiger Software to
spot very Bullish Insider and Professional Buying.
It shows how our tools can be applied to low priced stocks.
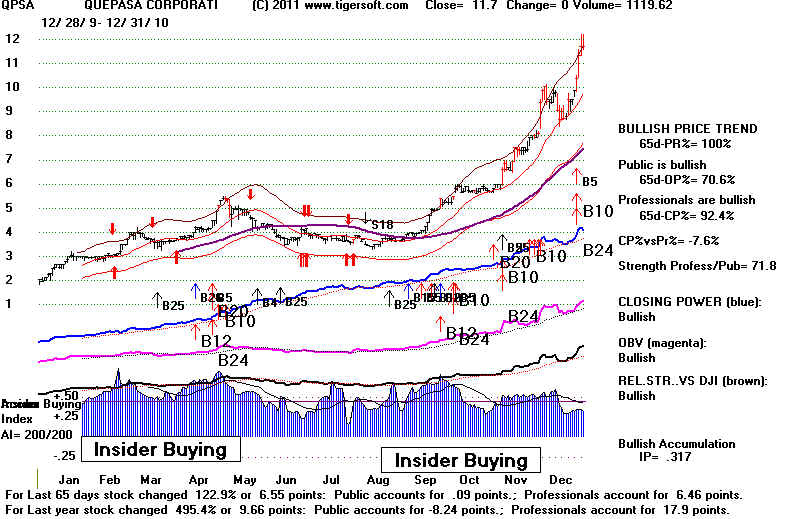
The last time a TigerSoft chart showed so much Insider
and Professional buying was a stock called QuePase (QPSA)
at $2.00. It rose to $15 a year later. On May, 3,
2010 I wrote:
"Our favorite stock remains
QPSA. We keep recommending buying more. Stocks with this much blue
Accumulation are
very rare. They are often way under the radar screen of Wall Street. But
insiders
are bust buying.
Usually such stocks are bought out at much higher prices. Since 1981, I can
recall
only a handful of
stocks showing this much Accumulation. At this writing, QPSA is actually up for
the day, even
though the DJIA is down over 200."
Compare QPSA's TigerSoft chart with
SFEG's further below.
 www.tigersoft.com
and William Schmidt, Ph.D. (Columbia Univeristy) |
| Do some due
dilligence. Does SFEG present a compelling case to invest in?
|
SFEG - Santa Fe Gold: http://santafegoldcorp.com/home/
Speculators,
Discover The Importance of Waiting for:
1) Price Breakouts accompanied by
2) Intense Insider Buying and
3) Bullish Closing Power DIvergences from Price
as Measured by TigerSoft Charts.
4) Red high volume breakouts confirm the breakout.
1. Feb 2002 Flat-resistance
breakout after Insider Buying +80% rally.
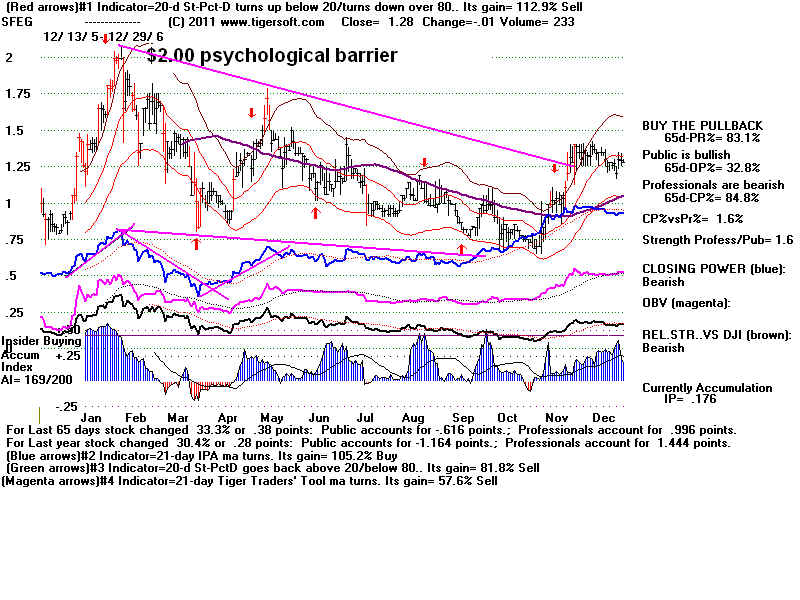
2. Aug 2005 Red High
Volume Breakout after Insider
Buying and
B7 Bullish CP divergences: 30 cents to $2.00 (Jan 2006)
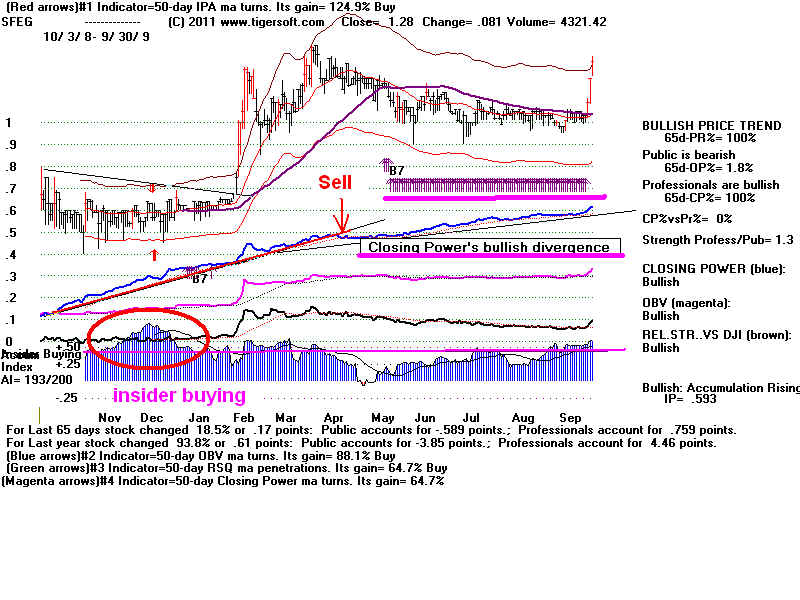
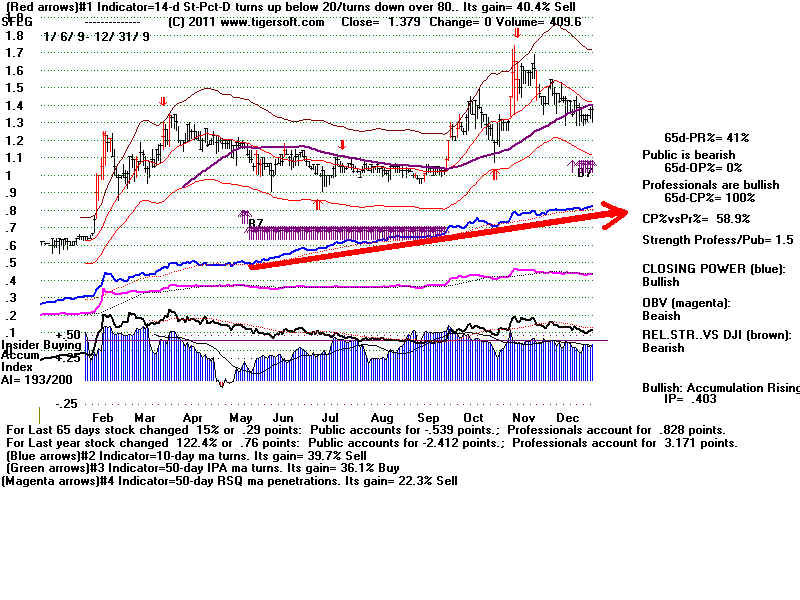
3. Feb 2009 Red High
Volume Breakout after Insider Buying and
B7 Bullish CP divergence: 75 cents to $1.30 (March
2009)
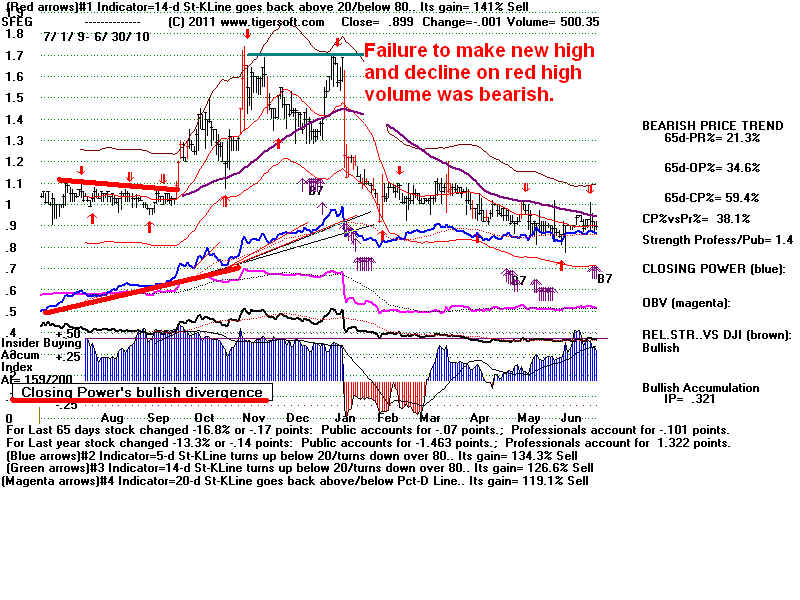
4. Sept 2009 Red High
Volume Breakout after Insider Buying and
B7 Bullish CP divergence: $1.10 to $1.70 (Jan 2006)
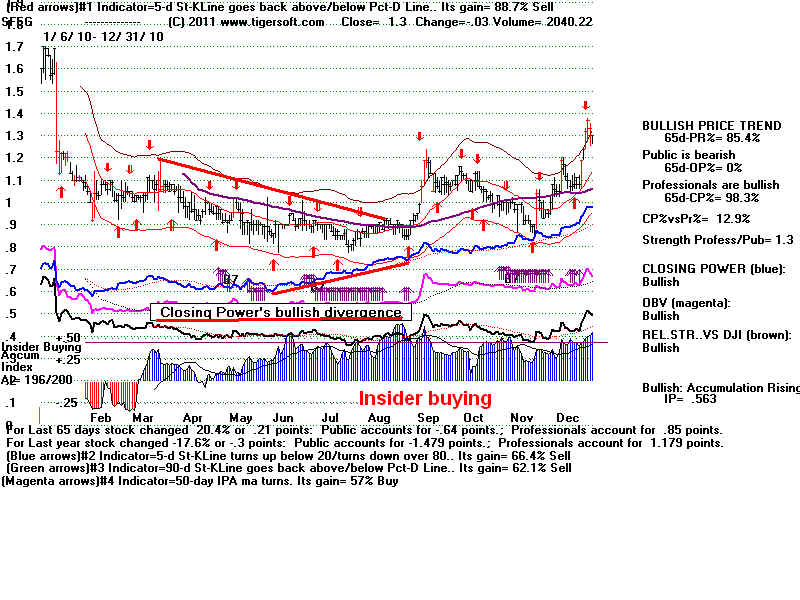
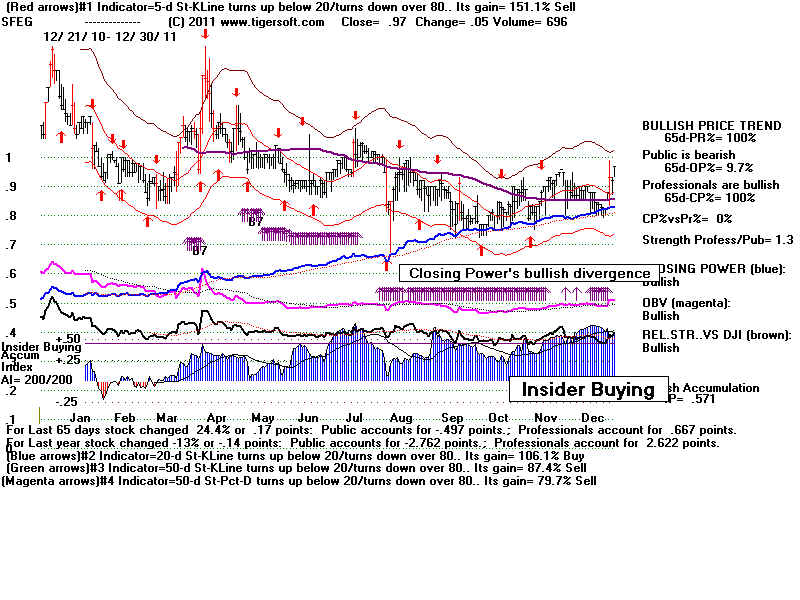
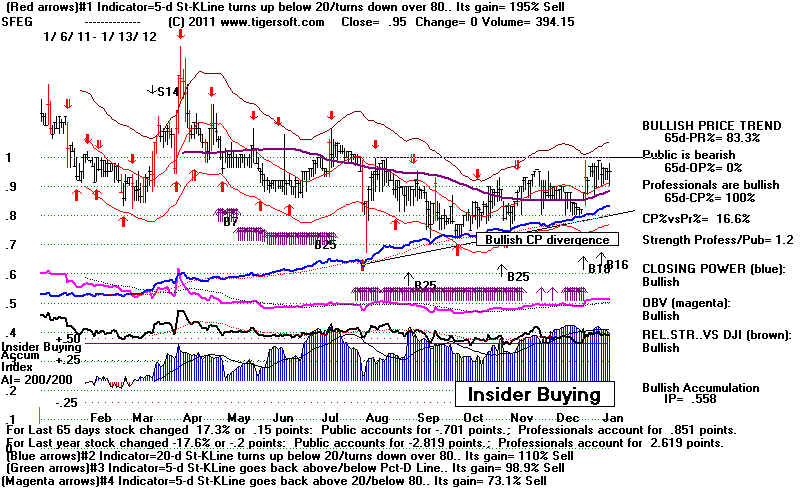
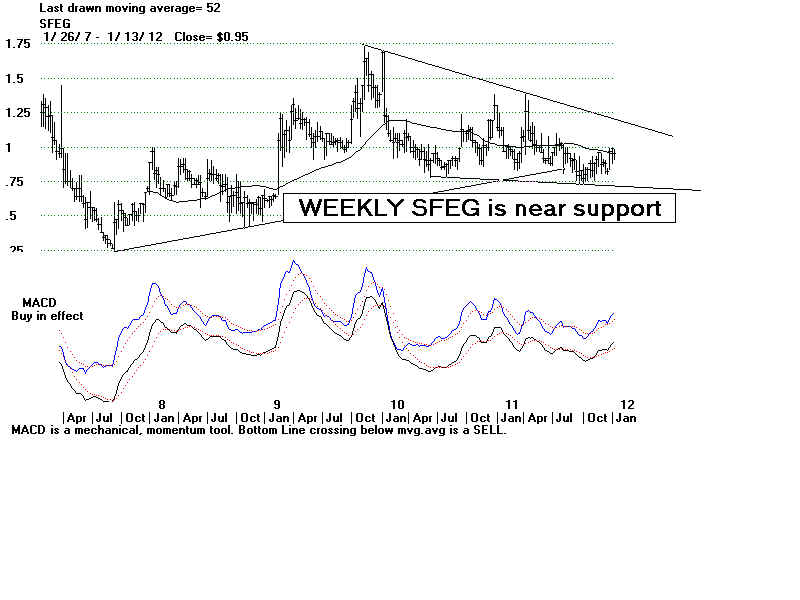
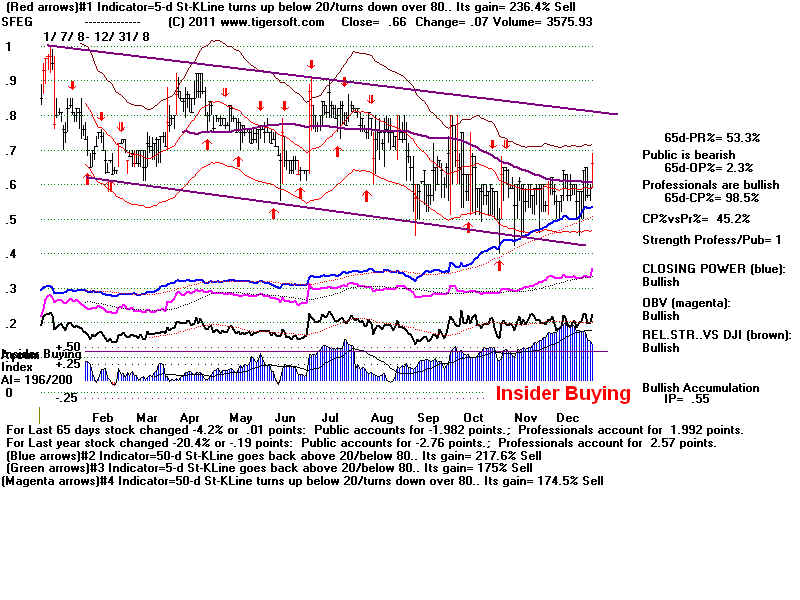
SFEG's TigerSoft chart now shows flat resistance at
about 1.00 and very
high insider accumulation and bullish
Closing Power Buy B7s.
See how the Blue Closing Power
has been rising for a year
while prices are just below $1.00.
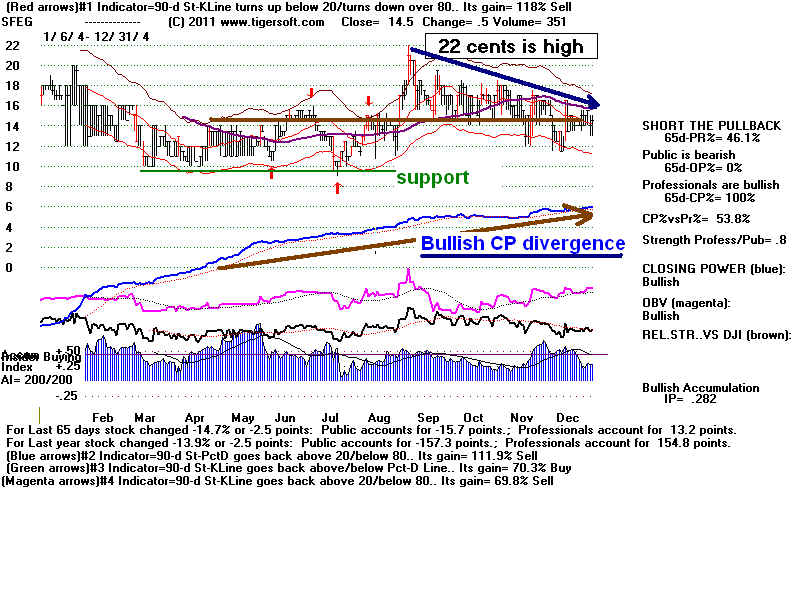
2001-2002 Insider Buying and breakout without red high volume brings quick advance
from .75 to 1.25
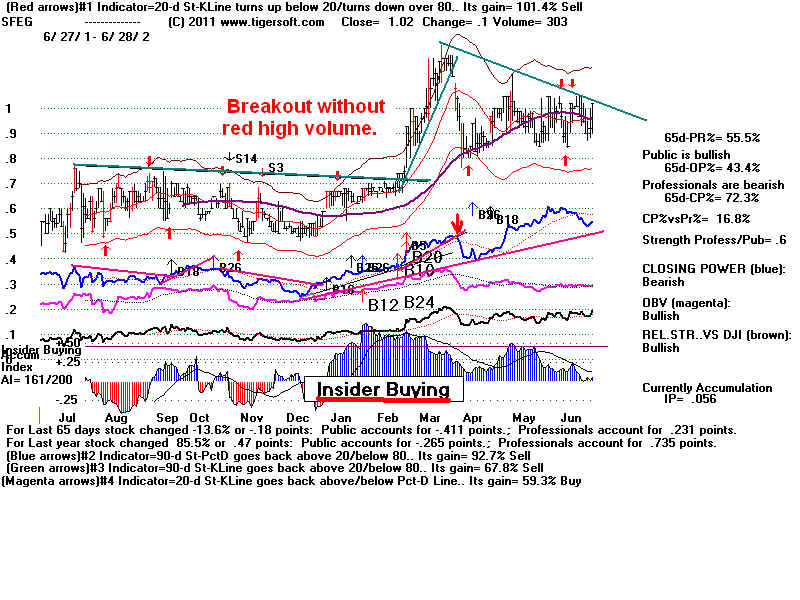
2002
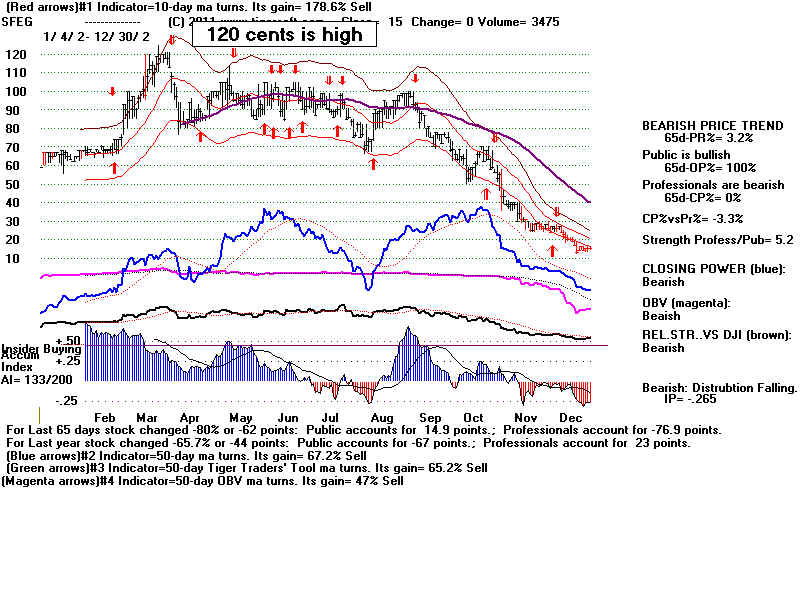
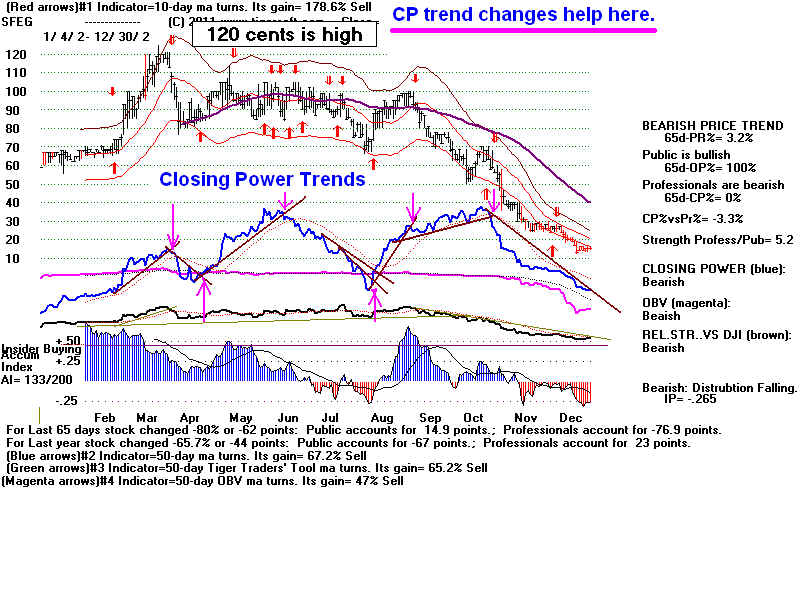
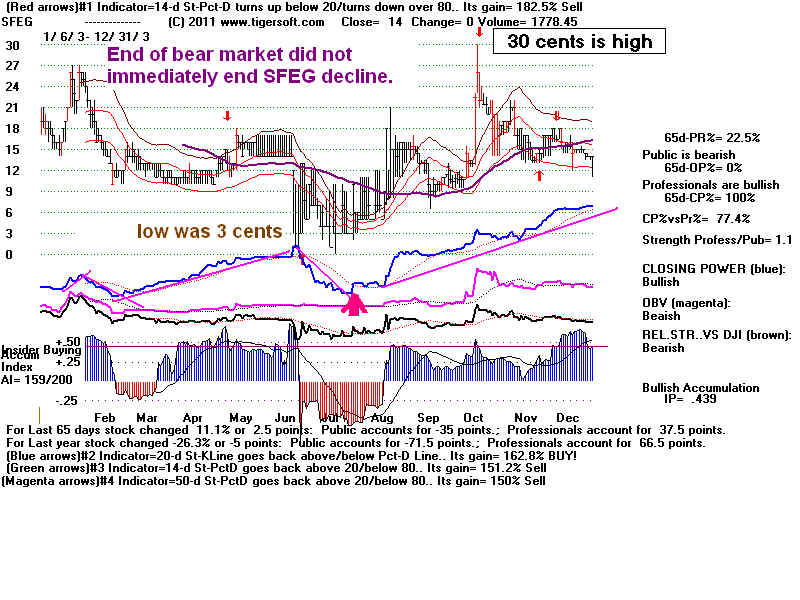
Closing Power was much stronger than price action from April-December.
Accumulation was very high - positive every day for a year, averaging +.25
20 cents to $2.00.
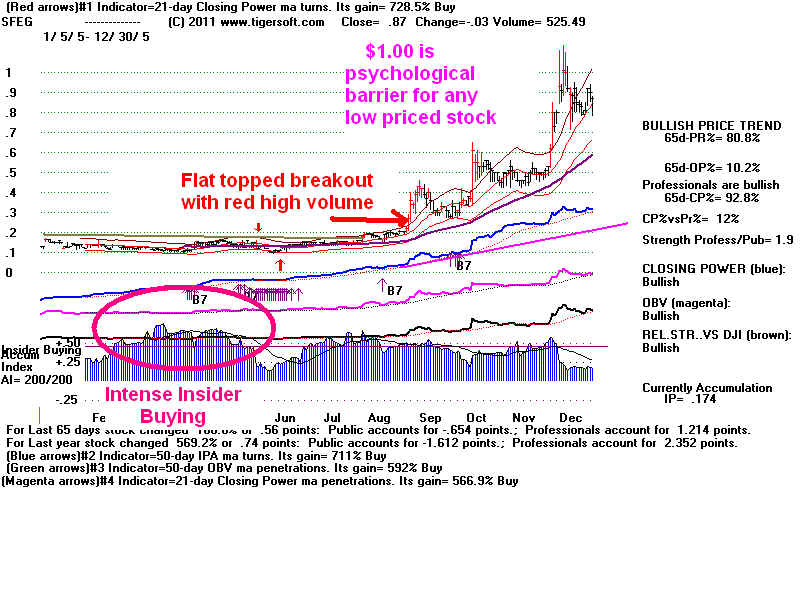
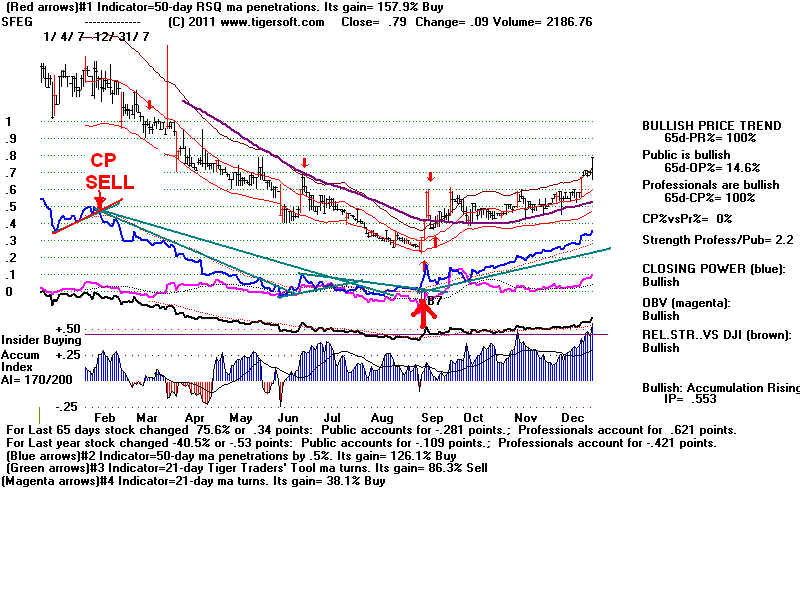
the yeat insider buying became very sizable.
Buy B7s show CP divergence. Red high volume marking price breakouts i Bullish, too.
