TigerSoft News Service 10/9/2009
www.tigersoft.com
TigerSoft News Service 10/9/2009
www.tigersoft.com
Other
Free Tiger Blogs - http://www.tigersoft.com/Tiger-Blogs/index.htm
WORLD
BULL MARKET ROLLS ON
---- The Weak US Dollar Is The Fuel ---
Only a part of the huge rally since March can be
explained away as being a bear market bounce in an
extremly oversold market. There is much more happening
than that. This has been a very broad advance, affecting
nearly all equities around the world.
Peerless and TigerSoft have had no trouble since March in
advising traders and investors to play the rally
aggressively on the long side and avoid the short side.
Foreigners should consider using our Peerless Stock
Market Timing Software to better time the trading of
their country's stocks.
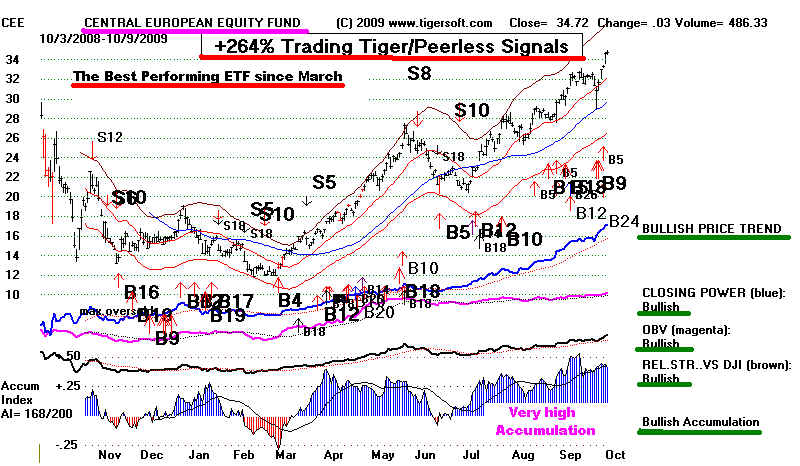
The outlook is still quite good. Non-US stocks, gold stocks
and technology stocks are the leaders. 25 of the 65 foreign
ETFs we track were up more than 100%. Central European
Equity Fund was up the most, +190%, in this period.
We spot the best of these ETFs and any group of stocks
using our Tiger Power Ranker and noting how strong the
TigerSoft's Accumulation Index and Closing Power are.
CEF's Closing Power is #1 in Closing Power. Its AI/200
score is 168. Only two other funds have this high an AI/200
score, but their Closing Power rank in much lower.
Both Peerless and TigerSoft Remain
Bullish
by William Schmidt, Ph.D.
Buy and Holding Is Dangerous See All The Peerless Real-Time
Signals: 1981-2009
Tiger Software - Helping Investors since 1981
Make Your Retirement Grow
Suggestions:
Peerless
Stock Market Timing: 1928-1966
Track Record
of Major Peerless Signals
Earlier Peerless-DJIA charts
7 Paths To Making 25+%/Yr. Using
TigerSoft
Index Options
FOREX trading
Investing Longer-Term
Mutual Funds
Speculative Stocks
Swing Trading
Day Trading
Stock Options
Commodity Trading
Research on Individual Stocks upon Request: Composite Seasonality Graph
of Any Stock for $125. Example of
historical research NEM - Newmont Mining. Order Here.

WORLD BULL MARKET ROLLS ON
Look at the
huge gains in foreign ETFs since the March
bottom. Below we rank these ETFs for their 150 day
performance since March 9th.
NON-US ETFS  Days back= 150
 3/9/2009 - 10/9/2009
Rank          Symbol        Name                          Price        Pct.Gain     %over 50dma  Accumulation  Closing Pwer Up%
---------     -----------------------------------        ------------  -----------   ------------  ------------  ----------------
 1                              CEE                          CENTRAL EUROPEAN EQUITY FUND  34.72                        190%                        17%                           168                            63%
 2            TRF           TEMPLETON RUSSIA FUND        19.72         181%          7.1%          106           51%
 3            IF            INDONESIA FUND               10.3          167%          10.5%         138           48%
 4            RSX           MKT VCTR RUSSIA S            30.25         152%          20%           148           55%
 5            INP           IPATH ETNS LINKED            60.18         149%          9.2%          139           51%
 6            EWO           ISHARES MSCI AUSTRIA INDEX   22.58         137%          11.3%         144           56%
 7            IIF           MORGAN STANLEY INDIA D       21.57         124%          7%            114           52%
 8            IFN           INDIA FUND                   29.42         123%          4.2%          170           50%
 9            EWA           ISHARES MSCI AUSTRALIA INDEX 23.37         122%          12.4%         124           54%
 10           EWZ           ISHARES MSCI BRAZIL INDEX    72.12         118%          14.9%         159           56%
 11           SGF           SINGAPORE FUND               12.49         117%          5.1%          131           52%
 12           TAO           CLAYMORE/ALPHASHA            18.67         117%          4.4%          114           45%
 13           EWI           ISHARES MSCI ITALY INDEX     20.78         115%          7.9%          165           51%
 14           HAO           CLAYMORE/ALPHASHA            24.47         112%          3.4%          88            44%
 15           KEF           KOREA EQUITY FUND             8.97         112%          7.9%          170           50%
 16           EWY           ISHARES SOUTH KOREA INDEX    46.62         111%          6.4%          151           56%
 17           EWW           ISHARES MSCI MEXICO INDEX    45.88         110%          5.7%          147           54%
 18           GRR           ASIA TIGERS FUNDS            18.86         110%          5.4%          139           48%
 19           BKF           ISHARES MSCI BRIC            43.91         109%          9.9%          102           51%
 20           EPP           ISHARES PACIFIC EX-JAPAN IND 41.61         107%          9.6%          169           57%
 21           EWS           ISHARES MSCI SINGAPORE INDEX 10.81         105%          3.3%          94            50%
 22           MXF           MEXICO FUND                  21.4          105%          3.7%          154           57%
 23           EWP           ISHARES MSCI SPAIN INDEX     50.22         104%          5.1%          168           57%
 24           ILF           ISHARES S&P LATIN AMERICA-40 45.05         102%          11.1%         165           56%
 25           VWO           Vanguard Emerg Mkts Stocks   39.83         101%          8.1%          181           50%
 26           EWK           ISHARES MSCI BELGIUM INDEX   13.29         97%           8.8%          158           57%
 27           EWD           ISHARES MSCI SWEDEN INDEX    23.07         96%           1%            169           54%
 28           EWN           ISHARES MSCI NETHERLANDS     20.56         96%           8.9%          134           57%
 29           EZA           ISHARES SOUTH AFRICA INDEX   55.89         95%           5.8%          165           57%
 30           DGS           WISDOMTREE Emerg MKT         41.33         94%           6.7%          121           48%
 31           PGJ           PowerShares Dragon China     23.66         93%           2.6%          145           50%
 32           EEM           ISHARES EMERGING MARKETS     39.85         92%           7.2%          161           52%
 33           GMF           ST SP EM AS PAC E            71.58         91%           6.3%          164           54%
 34           GCH           GREATER CHINA FUND           12.79         90%           4.5%          147           47%
 35           EWC           ISHARES MSCI CANADA INDEX    26.11         89%           6.4%          152           44%
 36           EZU           ISHARES MSCI EMU INDEX       38.57         89%           6.9%          142           55%
 37           JFC           JARDINE CHINA REGION FUND    13.55         89%           5.2%          141           54%
 38           TFC           TAIWAN GRR CHINA              5.95         88%           8.3%          165           53%
 39           FEZ           FRESCO DOW JONES EURO-50     41.81         87%           5.6%          136           53%
 40           VGK           Vanguard European Stocks     49.83         86%           4.6%          160           56%
 41           GXC           STRK SPDR S&P CH             69.76         84%           4%            139           49%
 42           CHN           CHINA FUND                   25.99         82%           11.1%         181           50%
 43           FXI           iShares FTSE/Xinhua China-25 42.89         81%           3.7%          151           52%
 44           MF            MALAYSIA FUND                 7.68         81%                         115           52%
 45           EWQ           IShares MSCI France          26.07         80%           6.4%          165           57%
 46           IEV           ISHARES S&P EUROPE 350 FUND  38.61         80%           4.4%          158           56%
 47           EWH           ISHARES MSCI HONG KONG INDEX 15.74         79%           3.7%          164           51%
 48           EWG           ISHARES MSCI GERMANY INDEX   22.47         76%           6%            157           53%
 49           EWT           ISHARES MSCI TAIWAN INDEX    12.34         75%           6.9%          140           55%
 50           TF            THAI CAPITAL FUND            10.32         74%           11.4%         169           52%
 51           EKH           HOLDRS EUROPE 2001           60.81         73%           4.8%          151           21%
 52           EWU           ISHARES MSCI UK INDEX        15.45         71%           1.7%          184           54%
 53           IXN           ISHARES S&P GLOBAL TECH      52.52         69%           3.9%          157           52%
 54           EWL           ISHARES MSCI SWITZERLAND     21.65         66%           4.3%          157           57%
 55           CH            CHILE FUND                   16.34         65%           4.3%          156           49%
 56           TWN           TAIWAN FUND                  14.05         65%           8.3%          180           56%
 57           VPL           Vanguard Pacific Stock VIPERs 52.92        65%           3.1%          171           52%
 58           EWM           ISHARES MSCI MALAYSIA INDEX  10.64         59%           6.2%          162           54%
 59           BZF           BRAZIL FUND                  26.53         45%           5.5%          91            48%
 60           ITF           ISHARES S&P-TOPIX 150        42.89         45%          -.7%           132           52%
 61           EWJ           ISHARES MSCI JAPAN INDEX     9.95          44%          -.8%           149           52%
 62           PWJ           PS DYN MIDCAP GR             16.33         43%           5.6%          151           53%
 63           JOF           JAPAN OTC EQUITY FUND        7.75          41%          -1.8%          157           57%
 64           IXP           ISHARES S&P GLOBAL TELECOMM  53.15         36%           1.4%          119           49%
 65           CAF           MORGAN STANLEY CH            33.43         25%           2.5%          131           50%
|
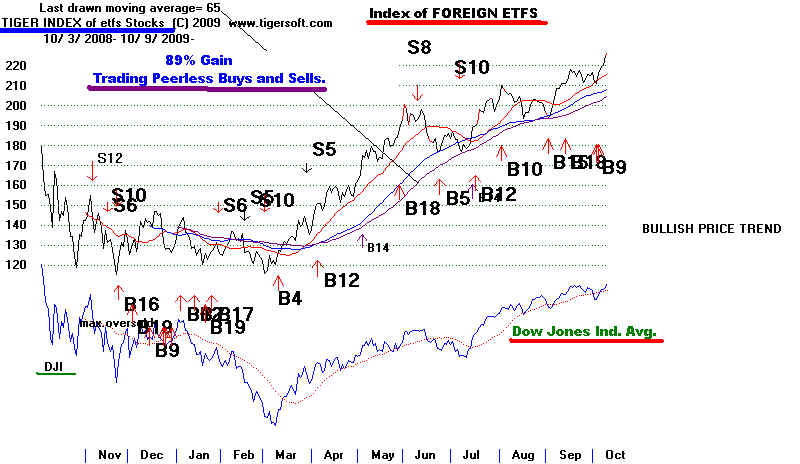
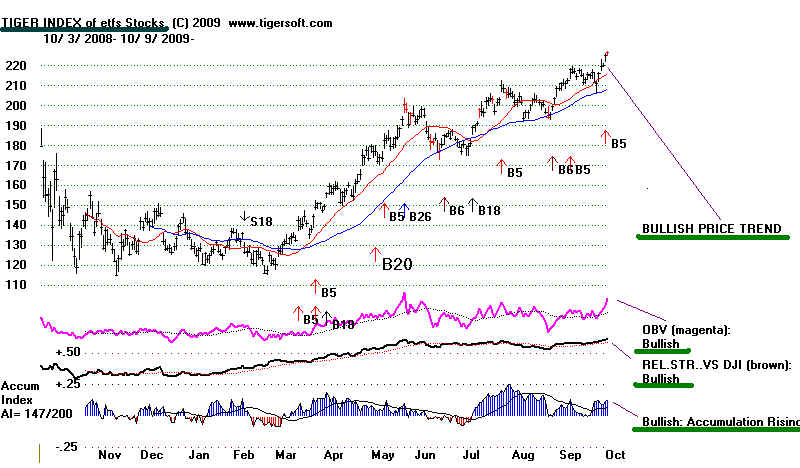
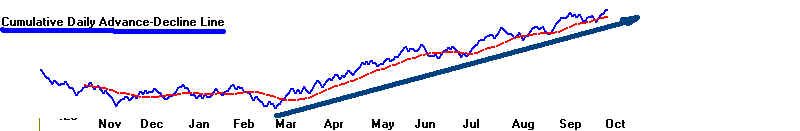
Both Peerless and TigerSoft Remain
Bullish
Below is the TigerSoft Index of foreign ETFs.
The
uptrend is clear. A new high was just made. The OBV,
Relative Strength and Accumulation Indicators are all
rated "Bullish" and the last signals are TigerSoft
and Peerless Buys. An Advance-Decline Line for the
65 foreign ETFs in our ETFS.exe data download is also
uptrending and has confirmed the lastest recent new high.
This is a relatively volatile ETFf, but the combined
Peerless and TigerSoft signals' gain trading it is +269%.
TIGER
INDEX of FOREGN ETFS
Up
80% since March Bottom
A
False Rally?
I know many who read this believe
that the rally in
the US stock market owes to the trillions of dollars
provided US banks by both the Bush and Obama
Administrations and the Federal Reserve under their
protector, Ben Bernanke. The rally is therefore phony and
therefore expected to be ephermal. The first part may
be true. Main Street certainly got no bailout like
Wall Street did. And real unemployment is very high.
More than 15% in Michigan. If this is not a damn
disgrace both for capitalism and for our political "leaders".
than such words mean nothing.
But the second part - that the rally will be
short-lived
has not been true. Nowhere has this been more true in
the 500%, 1000% and even 2000% record gains in some
stocks since March. I have written about this Stealthy bull
market elsewhere. The momentum is clearly up. Rallies
have been shallow, thus giving nervous traders few chances
to buy on pullbacks. Bears, who have been caught in the
uptrend are being gradually squeezed.
What's most important is that the world markets are
now also booming. It is very hard to stop such momentum.
This world-wide momentum cannot be quickly and
simply explained away, as being merely the result of
a bubble created by bank bailouts and trillions of Dollars
in almost no interest loans for US banks by the Federal
Reserve.
I can understand and accept the proposition that US
banks are using the trillions the Fed has given them
to buy Treasury securities and some US stocks. But it
seems unlikely that they are buying overseas stocks and
pushing up foreign equities like we now see.
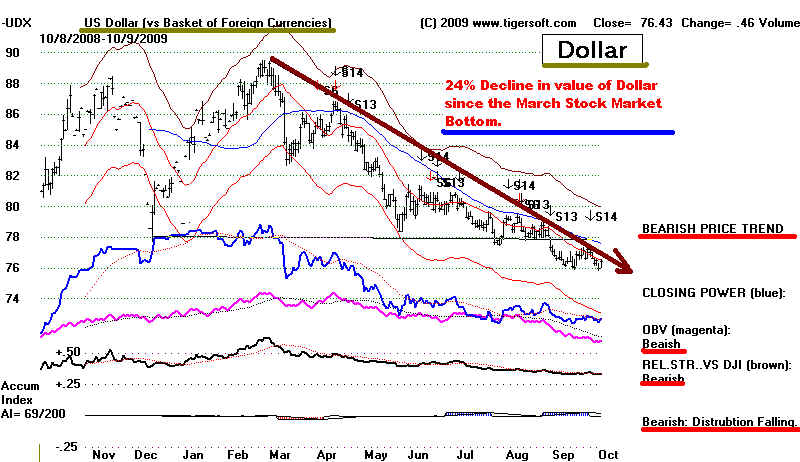
But much can be explained as a deliberate
pursuit of non-US investments in an era of a weak
US Dollar. Since the March 2009 stock market bottom,
the Dollar has fallen 24%.