|
Charts of Presidential Election Years: 1944 to 2004: Early Weakness
Followed
by
A Limited Rally And Then An End of Year Partisan Rally.
For
a long time, I have said that big declines are avoided in a Presidential
Election
year, especially after the first quarter. We now see why this is true.
Politicians
are
much more heedful of Wall Street and Main Street. They do what they can
to
avoid a big drop so as not to become political targets because of a weak stock
market.
These forces are clearly at work now. It takes a while for monetary policies
to
impact Main Street. They often have a substantial effect on stock prices. We
have
never
seen a 3/4% rate cut in a Presidential Election year. It should bolster the market
a
lot unless economic conditions and business confidence have already passed the
point
of no return, as was true in 2001 and 2002.
It
may be said that the Fed panicked last Tuesday morning when they
saw
the severe drops overseas on the Friday and Monday. If so, the discovery that
a
single rogue French trader may have caused their panic, may lead them not
to
cut rates again this week. If they do cut rates again, it may well be taken as a
sign
that
the number of bad loans may be much larger than outsiders realize. It may
mean
they
want to help banks return to profitability to avoid a bail out of some very big banks,
as
happened in the UK with Northern Rock Bank.
My
own feeling is that they will only cut rates again if the DJI falls another 10%.
And
that will bring a typical Presidential Election year rally nearer the end of the
first
quarter.
Arthur
Merrill studied the market in Presidential Election years, from 1886 to 1980. The
median
probability
for any given month being up was 56%. 55% of Januarys in Presidential Election years
rise.
Februarys
are worse. They are up 47% of the time. March features an advance by the close
and is
up
71% of the time. April and May are each up only 47% of the time. June is up
51% of the time..
Julys
rise 59% of the time, August advance 67% of the time. But Septembers fall.
They rise only 41%
of
the time. The probabilities of a monthly advance are 69%, 69% and 59% for October,
November
and
December, respectively.
Below
are the charts since 1940 of Presidential Election years. First quarter declines
occurred
in 12
cases: 1940, 1944, 1948, 1952, 1956, 1960, 1968, 1980, 1984, 1988, 1992, 2000 and 2004.
The
exceptions
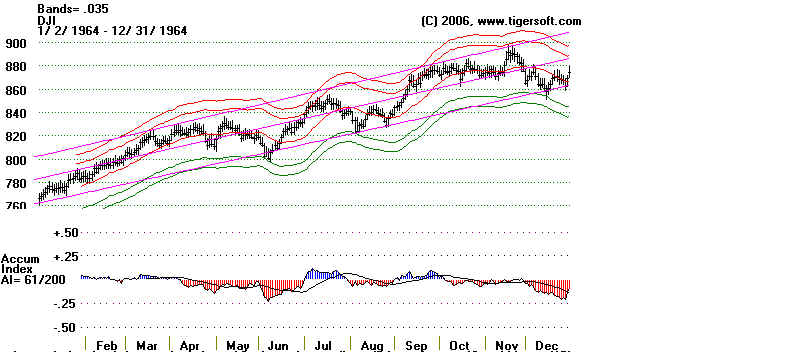
were 1964, 1972, 1976 and 1996. So, on this basis the odds are 3:1 for a significant
decline
in the first quarter. Of course, we have already seen that for January. But
will the market go
down
more. A decline to May and June is most typical. If we count count the number
of times bottoms
occurred
in subsequent months, we see the number are:
late
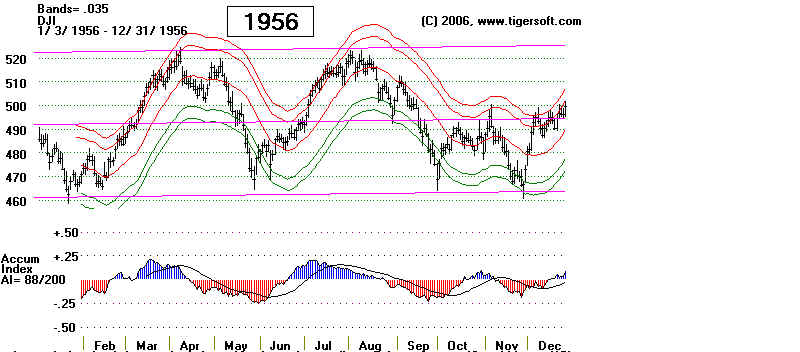
January-February: 1948, 1956 (trading bounce), 1988
March
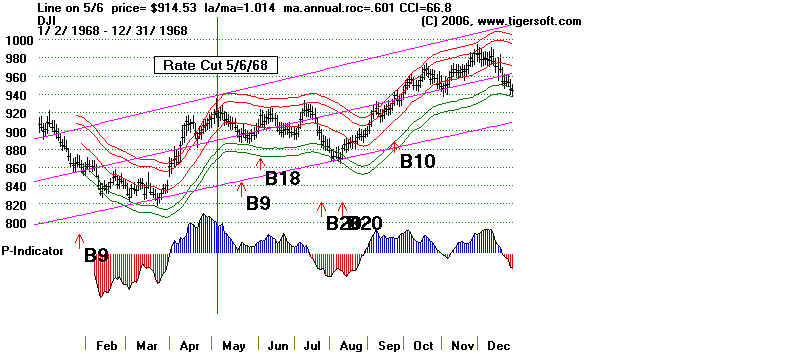
1968, 2000
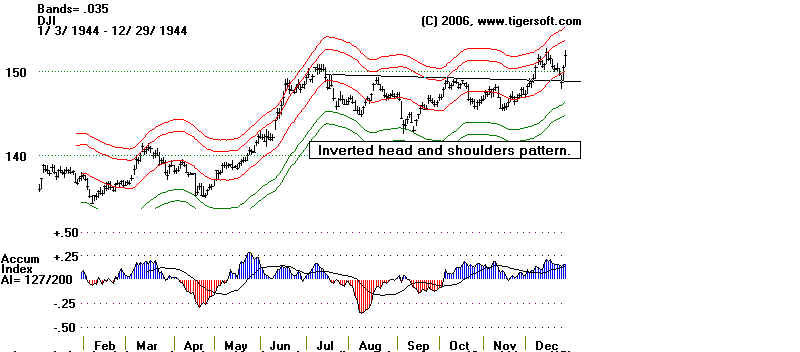
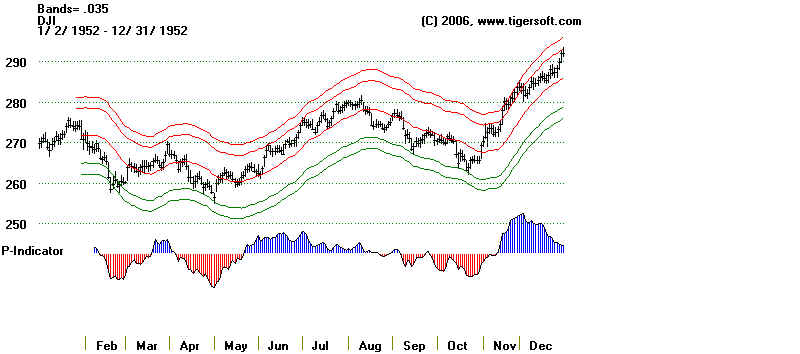
April 1944, 1952, 1960 (trading bounce), 1980, 1992
May
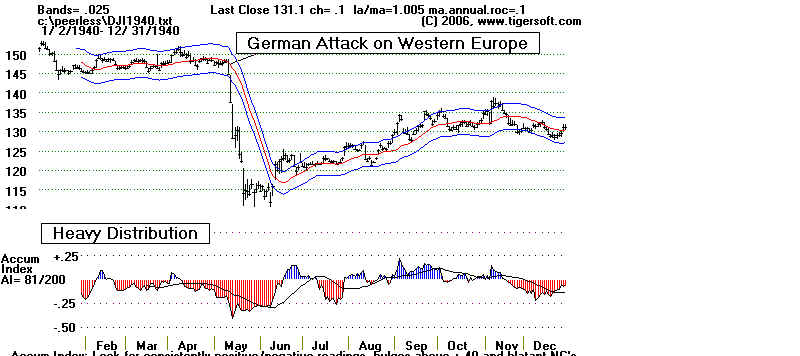
- 1940, 1956, 2004 (trading bounce)
June
July
- 1984
Over
and over, we see interest rates are not raised until late in a Presidential Election year,
unless
a Republican Fed Chairman wishes to sabotage chances for re-election of a Democrat
or
vice verse. See the cases of this in 1956, 1980 and 2000. The Feds delay in 1992 may
have
cost the first Bush re-election. Lowering interest rates by the Fed in 2008 helps
Republicans
avoid
going into the Presidential Election saddled by a recession. In 1972, the Fed sat on
its
hands
in 1972, despite rising commodity prices. After the Election, they started raising rates.
(Source:
http://minneapolisfed.org/research/data/us/disc.cfm
)
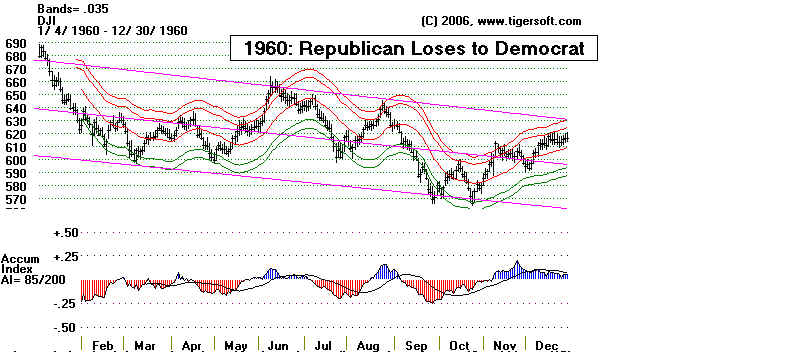
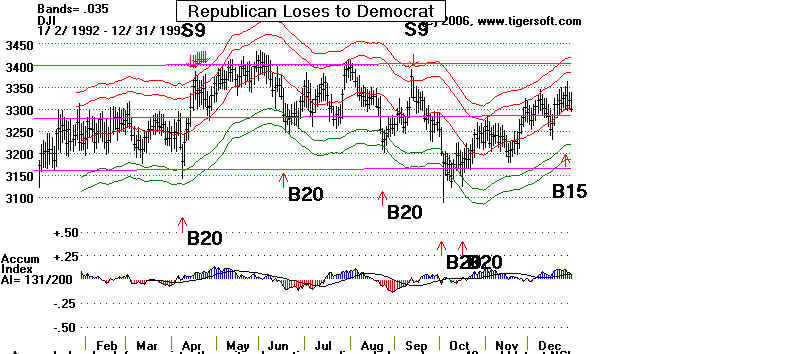
The
market tends to be weaker in a Presidential Election year when a Democrat is going to
take
away the White House from a Republican. See 1960 and 1992 below. 1976 may be viewed
as
an exception, because Republicans were tarred with Nixon's resignation.
--------------------------------------------- 1940
--------------------------------------------------------------------------------------
-------------------------------------------- 1944
-------------------------------------------------------------------------------------
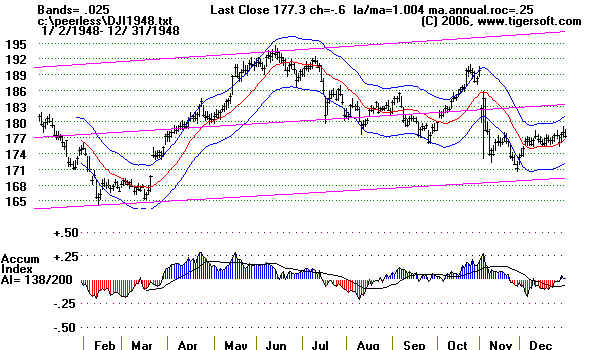
------------------------------------------- 1948
--------------------------------------------------------------------------------------
Discount rate was raised from 1.0% to 1.25% on 1/12/48. Hence the early decline.
------------------------------------------- 1952
--------------------------------------------------------------------------------------
------------------------------------------- 1956
--------------------------------------------------------------------------------------
Democrat Fed raised Discount rate from 2.25% to 2.5%
on 4/13/56. This brought an immediate sell-off.
------------------------------------------- 1960
--------------------------------------------------------------------------------------
Federal Reserve lowered Discount Rate from 4/0% to
3.5% on June 10th. This brought a rally
for a month. On August 15th, they lowered rates to 3.0%.
The stock market still declined.
Richard Nixon angrily claimed that the Fed deliberately delayed cutting
rates to help a Democrat
win.
------------------------------------------- 1964
-------------------------------------------------------------------------------------
Fed raised rates on November 30th from
4.0% to 4.5%. This was too late to effect
the Presidential Election.
------------------------------------------ 1968
-------------------------------------------------------------------------------------
The Fed
raised the Discount Rate from 4.5% to 5.0% on March 15th. A month
later they raised the rates to 5.5%. On
August 16th, rates were lowered to 5.25%.
1968 was a year of wild speculation in
low-priced stocks.
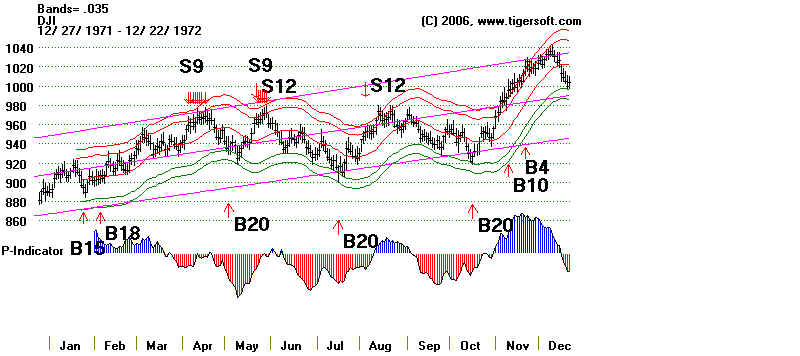
------------------------------------------ 1972
-------------------------------------------------------------------------------------
In November and December 1971, under
pressure from Richard Nixon, the FED lowered
rates from 5.0% to 4.5%, despite the widespread talk by the
Nixon Administration that
prices should be stabilized.
----------------------------------------- 1976
--------------------------------------------------------------------------------------
On January 19, 1976, the Fed
lowered the Discount rate from 6.0% to 5.5%. After the
election, the rates were lowered to 5.25% on November 26.
That brought a year-end rally.

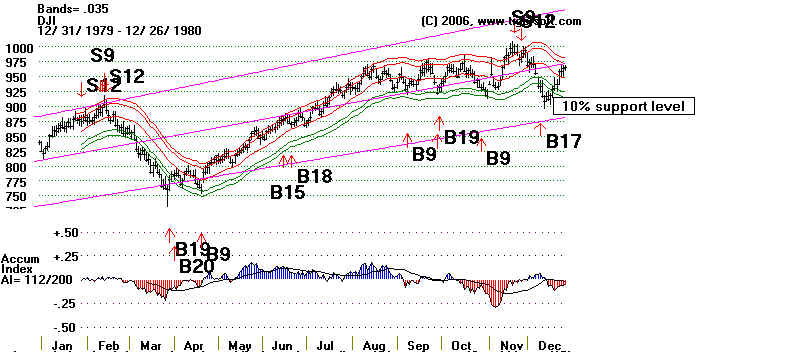
----------------------------------------- 1980
-------------------------------------------------------------------------------------
The Fed raised
rates (sabotaging Jimmy Carter's Presidential Election hopes) from 12.0%
to 13%. That was on February 15th.
The stock market immediately declined. On May 29th,
they lowered the rates from 13.0% to 12.0%.
That sent the DJI to new highs. On June 13th,
rates were lowered to 11.0% and on July 28th,
they lowered them again to 10.0%. Then rates
were taken back up by a percent on September
26th, November 17th and December 12th.
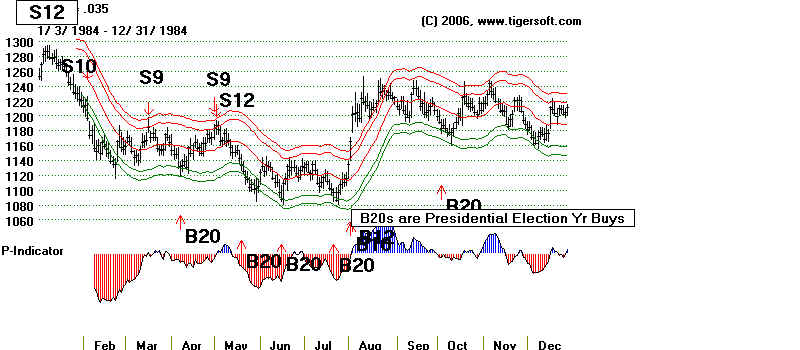
----------------------------------------- 1984
-------------------------------------------------------------------------------------
The Fed raised rates
from 8.5% to 9.0% on April 9th. That sent the market down again.
In November and December rates were
lowered in half steps to 8.0%.
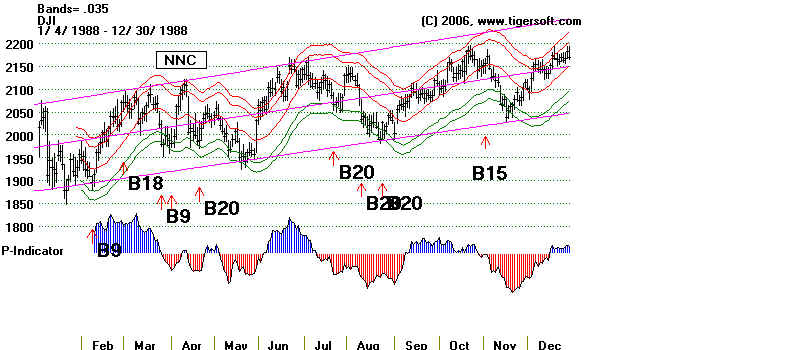
----------------------------------------- 1988
-------------------------------------------------------------------------------------
The Fed raised the Discount
Rate from 6.0% to 6.5% on September 8th, too late to
affect the Presidential Election.
----------------------------------------- 1992
-------------------------------------------------------------------------------------
On July 2nd, 1992, too late to help
the first President Bush be re-elected, the Fed lowered
rates from 3.5% to 3.0%. This may have cost him the
election.
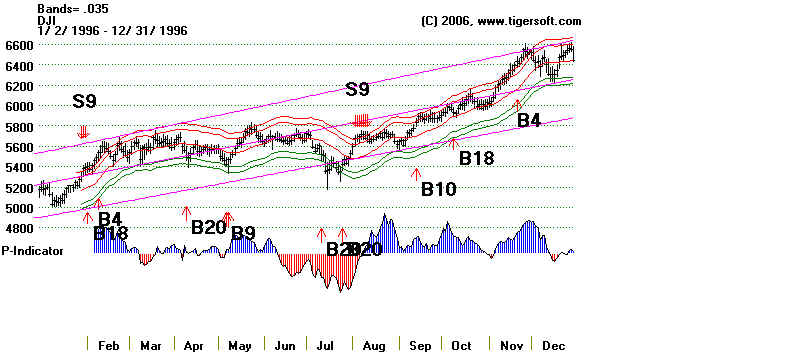
----------------------------------------- 1996
-------------------------------------------------------------------------------------
On January 31th, the Fed
lowered the Discount Rate from 5.25% to 5.0%. By then
President Clinton had proven he was a good
friend to Greenspan and Wall Street. He had
re-appointed him and the stock market was
booming.
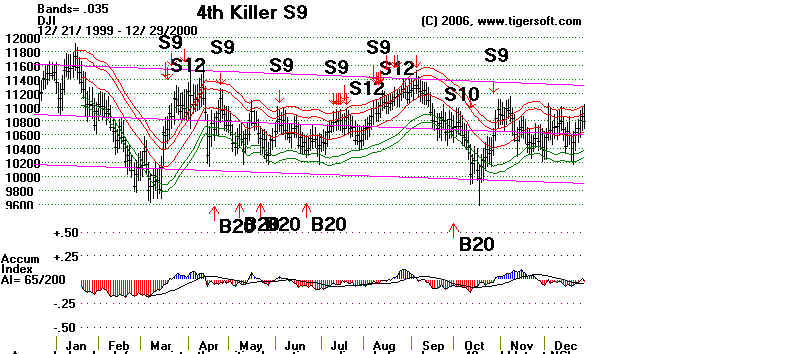
----------------------------------------- 2000
-------------------------------------------------------------------------------------
The Fed raised rates from 5.0% to 6.0% in
2000 between February 3rd and May 18th.
This was designed to cool the over-heated stock market and
probably, not incidentally,
help make the Democrats lose the Presidential Election.
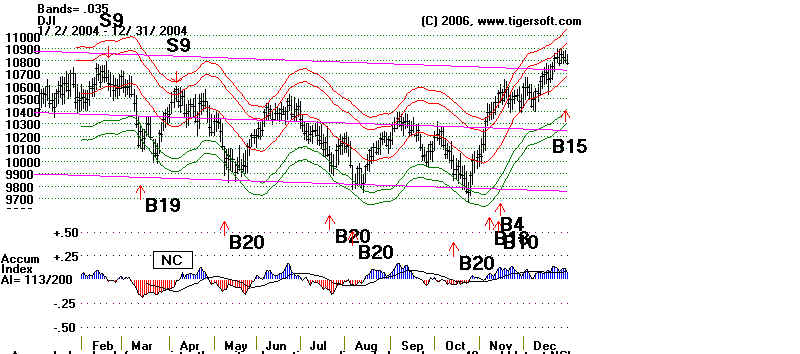
----------------------------------------- 2004
-------------------------------------------------------------------------------------
The Fed raised
rates from the low 2.0% of 2003 to 2.25% on June 39th. On August 10th
the rates were raised to 2.5%. 1/4%
raises were also instituted in September, November
and December. Notice how the rates
were not cut until late in the Presidential Election year.
"
|