wpeC.jpg (1913 bytes)        Tiger Software   -  Bill's Blog   9/26/2007   Stock Market Seasonality
wpe11.jpg (33251 bytes)          Daily Blog -
      Tiger Software

  
Stock Market Behavior
       in Fourth Quarter  in 3rd Year
     of Presidential 4 Year Cycle


  =======================================
   William Schmidt,       - Tiger Software's Creator
   (C) 2007 William Schmidt, Ph. D.  - All Rights Reserved. 

   No reproductions of this blog or quoting from it
   without explicit written consent by its author is permitted.

   Send any comments or questions
   to william_schmidt@hotmail.com

     Tiger Software - Helping Investors since 1981 -
          How To Boost Your Retirement Account
    Suggestions: 
      
Peerless Stock Market Timing: 1928-1966          Track Record of Major Peerless Signals
       Earlier Peerless-DJIA charts        7 Paths To Making 25+%/Yr. Using TigerSoft 

       Index Options           FOREX trading       Investing Longer-Term         Mutual Funds
       Speculative Stocks      Swing Trading       Day Trading       Stock Options         Commodity Trading


DJI's Performance in Fourth Quarter
    in 3rd Year of Presidential 4 Year Cycle


                  65% of the time, Septembers bring a market decline.  It wasn't true last year.  And it's
          not true this year.  What's Up?  Is a decline just being postponed?

                  I was first turned onto seasonality in the stock market reading Arthur Merrill's gem,
          Behavior of Prices on Wall Street.  His study of the markets from 1886 to 1983 shows
          that Septembers are up typically only 38% of the time, Octobers are up 50% of the time,
          Novembers 56% of the time and December 80% of the time.  Clearly "Helicopter Ben"'s
          easing of credit and adding of cash (printing money) is inflating the market.  We should
          ask at what price and for how long.   
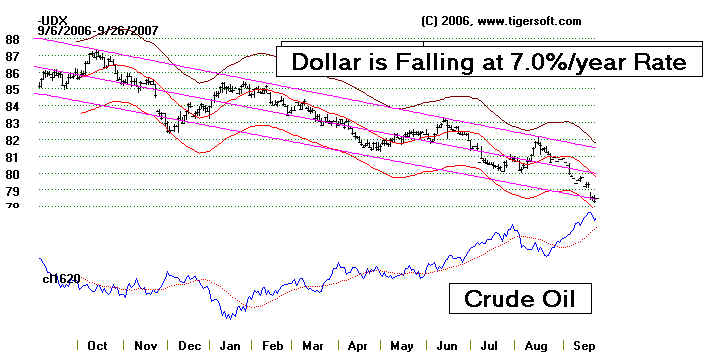
The weakness of the dollar and great strength in oil,
          gold, foreign ETFs and telecomms and Chinese stocks all stem from the deliberate policy
          of debasing the greenback.

                How long can the rally continue?  I looked back at my data, which starts at 1915. There
          is still a chance for a September peak. In the years before a Presidential Election, a September
          peak was seen in 1939 (followed by a long bear market as WWII started) and in 1955
          (followed by a bull market).   A peak in October would be more bearish, if the two cases 1979
          (12% decline in DJI) and 1983 (9 months' decline) are any indication.  A top in November
          this year would be bearish if 1919's November top was significant, but would be of only
          passing importance if the 1939 case (DJI dropped to the lower band and then rallied) were
          repeated.  Decembers are bullish.  But a peak then would be bearish based on the single case,
          1919. 
      
               If the DJI rally can continue for the rest of the year without a decline to even the lower band,
          the market will look like it did in 1963 (when an intermediate 10% decline did not occur until
          mid 1965), in 1991 (when the market rose steadily until March the next year, only to endure a
          shallow 7% pullback) and 1995 (when priced soared for nearly five years, though there was
          a 10% decline after a May 1996 top).

                              US Dollar's Decline and Crude Oil's Rise
       wpe13.jpg (45925 bytes)
How well does behave in the Fall before a Presidential Election?

2007

2003  up all year

1999  DJI peaked in August and fell 12% to an October bottom before a fine rally.

1995 up all year.

1991 up all year.

1987 peaked in August and declined to 10/20/87 and then stabilized.

1983  peak in October and the DJI the fell only to lower band and then to rallied until January.

1979 DJI peaked in early October and fell 11% to a bottom in early November and rallied until Feb 1980.

1975 DJI peaked in July. Fell to a new lows on October 2, 1975 10% down from peak and
tallied.

1971 DJI fall to a November bottom on 11/24/71 and rallied strongly until May.

1967 DJI hit a peak ia late September and hit a bottom 10% lower on November 8th, rallied until
December and then fell to new lows. with a bottom in March/

1963 The DJI rallied from July 1963 to July 1964 with an 8% decline in November when
JFK was assassinated.

1959  The DJi fell 9% from a July peak to a September bottom and then rallied until December
and fell again by February to a new low.

1955 The DJI fell 10% from 488 peak(late September) to 440 low on October 11, 1955 and then rallied.

1951 The DJI fell 7% from August 1951 to a bottom on in mid November.  It went
up and sidewise for the next 9 months without breaking the November low.

1947 The DJI rallied in October 1947, but peaked on 10/21/47 at 185 and then fell
until  February with a bottom on 2/13/1948 at 165.70

1943 November 30th, 1943 bottom was easily called because P-Indicator
was very positive despite the DJI's reaching the lower band with DJI at 130.. It rallied
strongly in 1944,

1939 DJI reached a peak on 9/12/39 when Germany attacked Polant and then fell gradually
for the rest of the year and until May 1940 bottom when German attacked Western Europe.

1935 DJI rallied throughout the year.  It did reach a short-term peak on 11/20/1935
fell until 12/19/35 (138) and then rallied strongly, reaching a peak in March. (162)

1931 DJI declined throughout year.  Rallied in October and then declined
steeply until end of year. Wide bands needed.

1927 DJI was in uptrend for 1927, but peaked October 4, 1927 (199)
and fell to 1191.40 on October 25, 1927.  We would not have wanted
a Sell S9 on quick recovery in November to upper band, Market roared
ahead in 1928.

1923 DJI had been falling since February 1923.  Hit bottom (a triple bottom)
on October 30. 1923 (88) .  It rallied until February 7, 1924 (100).

1919  DJI peaked on November 5, 1919.The DJI fell gradually until
October 1920 and then fell more sharply

1915   market stayed in uptrend in fall.  Peaked in December
          and declined for first six months of 2006.