|
Gold and Gold Stocks' Breakouts
Are Powered
by FED Cut in Interest Rates by 1/2%
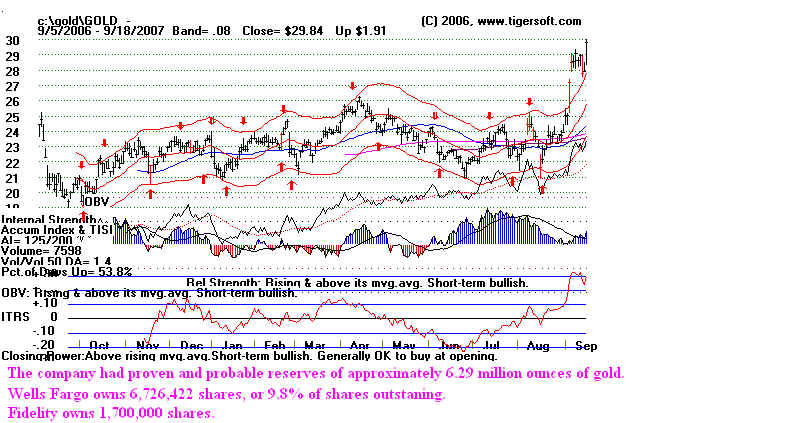
Gold's rate
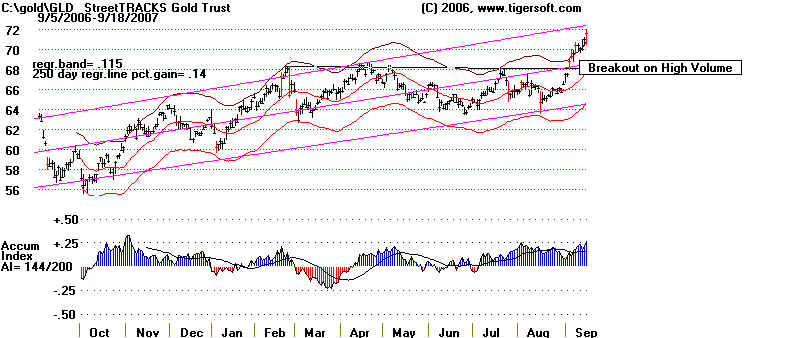
of ascent is rising faster and faster. Look at the chart of GLD, the bullion ETF.
Two weeks ago it moved past $68, as
Gold went over $680/ ounce. Back in 1980, it peaked
near $725. We are on the
verge of an all-time high. Our Tiger chart shows very bullish (blue)
levels of Accumulation. GLD's
Least Squares Regression Line shows a rate of ascent that
is now 14% per year. An
all-time high will surely cause a buying stampede. (Note- 9/20/2007:
Gold made an all-time high today.)
As long as the Fed is willing to add liquidity (a euphemism for printing
greenbacks), like
it has for the last 6 weeks, gold
will be very strong. I have talked about the decline in the
dollar elsewhere. The
continued reckless wastage of US tax dollars in Bush's insane war on
and occupation of Iraq virtually
guarantees a dollar collapse! What
this will do to retired
people living on a fixed income is
CRUEL!
See http://www.tigersoft.com/Tiger-Blogs/9-13-2007/index.htm
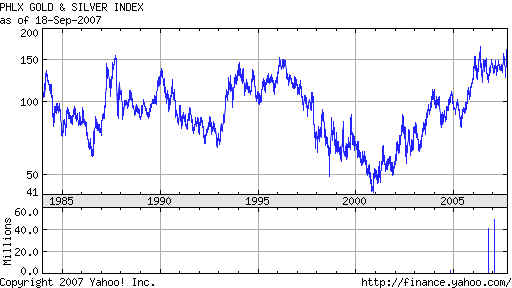
Gold stocks, as measured by the Philadelphia Stock Exchange's XAU
Index, have today made
a 20 year new high
past flat resistance formed by more than a ten earlier peaks between 150
and 160. Here is
the Yahoo long-term chart of the XAU. Its close of 164.78 is not shown
yet in the Yahoo longer-term
chart. This is a reliably very bullish development for Gold.
It is a baleful sign for the
Dollar.
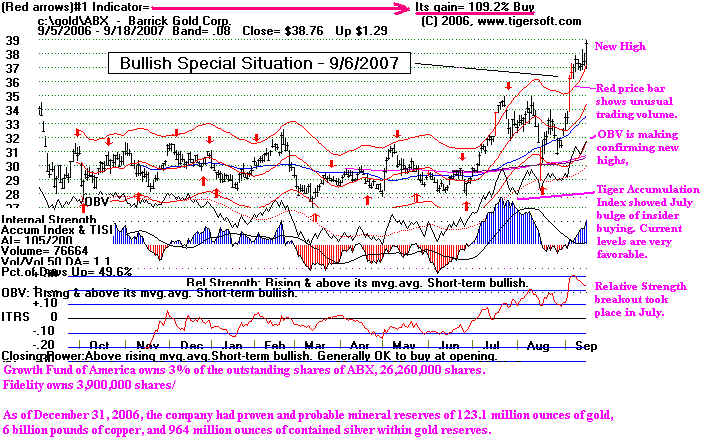
More than a week ago, Tiger Software recommended traders buy Gold bullion and
the gold stocks, ABX (Barrick
Gold of Toronto - http://www.barrick.com ) and
GOLD (Randgold Resources
Ltd - http://www.randgoldresources.com )
Both are
now running in all-time high
territory, where technical resistance is light, because
traders cannot bunch their orders
at an obvious earlier level.
ABX - American Barrick Gold
GOLD - Randgold Resources Ltd
Why
did we choose these stocks to recommend? Tiger Software's Power Ranker gave
them the highest marks for accumulation and insider buying
and they were "the first-out-of-the-gate",
that is, they made new 12-month highs before the others
this past month.
A good way to go now,
is to buy the highest gold stock with very high current reading from
the Tiger Accumulation Index, provided there is
not technical resistance just overhead. Using this
approach, one should look at AZS (11.42, but at
resistance), FCX (103.3, which looks like a Buy. ),
ABX (38.86) and EZA (131.59 - South Africa ETF).
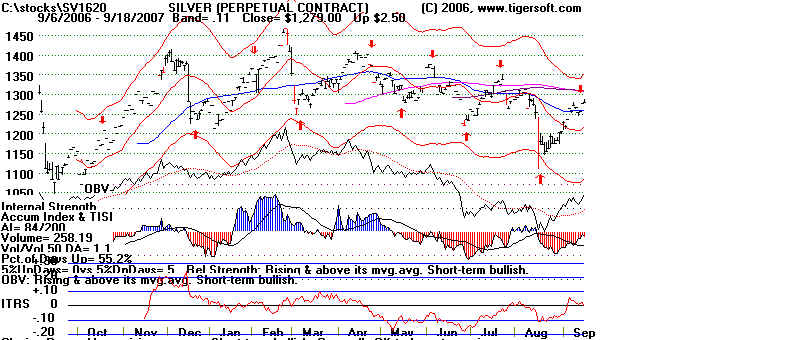
Silver
stocks should enjoy this run, too. But sliver prices are often more dependent on the
level
of economic strength, though. They will top out
sooner than gold if a recession is looming. Here is the
current "perpetual futures contract" chart of
silver. It shows red distribution and is just below
the expected resistance posed by declining 30-week and
200-day moving averages. Perhaps, it
will breakout and catch up with Gold. But the charts
say otherwise. Almost three months ago,
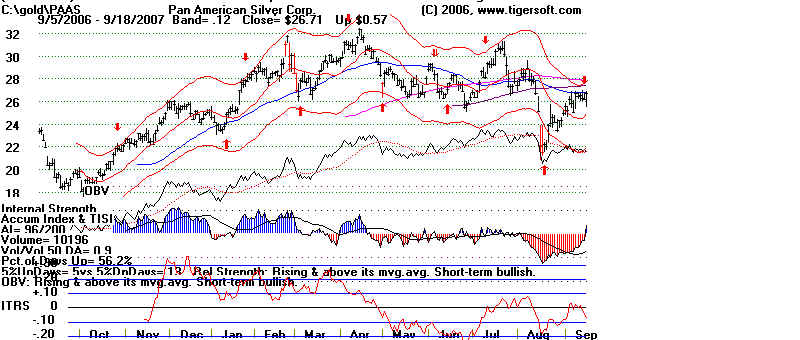
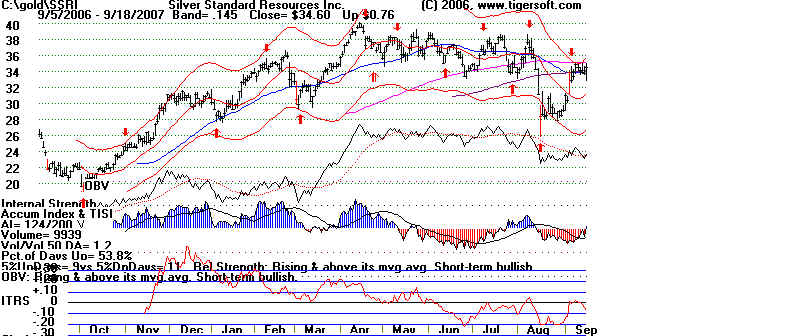
I pointed out that "silver stocks were starting to tarnish".
Two very fine silver stocks, PAAS and SSRI are only doing as well as
silver.
I hope they play catch-up. That
will mean that a recession is farther away than some
of the pessimists think. Red sell
signals have appeared on this rally. But I think they will
keep rising if the XAU stays as strong as
I expect and Gold can get past $725 an ounce
and keep going.
The ending of the XAU trading range, will mean a lot of
short covering.
Jim Sinclair says
that "there is a huge illegal short in each and
every one of the
(gold stock) juniors.
Those shorts are going to run for cover." And he points out that many
companies have limited
how much they can make if there is a steep rise in gold, because
of the extent to which
they themselves hedge with derivatives.
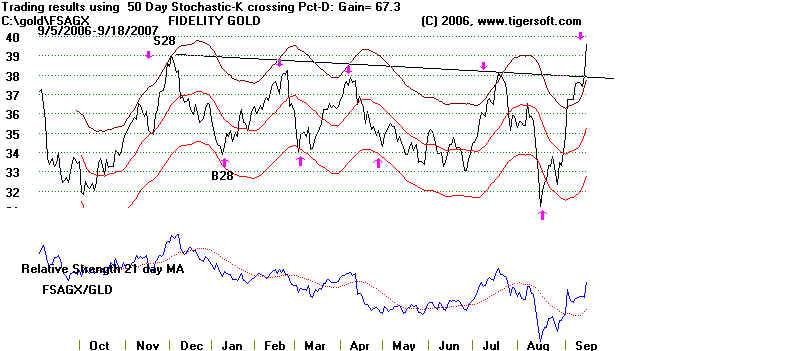
Watch the top 10 holding of Fidelity Gold on FSAGX
on Yahoo. They have a new fund manager there.
The one before
could not beat the performance of just owning GLD (Gold bullion). Here are their
reported holdings
now.
Top 10 holding of Fidelity
Gold, FSAGX
| TOP 10 HOLDINGS ( 67.00% OF TOTAL ASSETS) |
|
| Company |
Symbol |
% Assets |
YTD Return % |
| MERIDIAN GOLD INC. |
MDG |
9.63 |
-0.07 |
| Newcrest Mining Ltd |
N/A |
9.17 |
N/A |
| BARRICK GOLD CP |
ABX |
8.51 |
6.48 |
| IAMGOLD CORPORATION |
IAG |
8.21 |
-24.97 |
| NEWMONT MIN CP (HLDG |
NEM |
7.94 |
-5.95 |
| Lihir Gold Ltd |
N/A |
6.75 |
N/A |
| KINROSS GOLD CP |
KGC |
4.91 |
2.86 |
| GOLD FIELDS LTD ADS |
GFI |
4.42 |
-18.40 |
| GOLDCORP INC |
GG |
4.00 |
-16.73 |
| ARIZONA STAR RESOURC |
AZS |
3.46 |
-16.67 |
|
Here is the chart showing Fidelity's FSAGX and a relative
strength comparison with GLD (gold bullion)
In fairness to FSAGX, most gold stocks have not done
as well as GLD. And it ranks higher for the
last month than 38 of 47 gld and sillver stocks.
Note that if Gold continues to run, the automatic red Sell
signal will finally be bested. But they served
us very well for nearly two years.
Fidelity
Gold Fund's Breakout and Under-Performance Relative to Gold Bullion
Best Performing Gold and Silver Stock for
Last 3 Months (65 trading days.)
C:\gold       Days back= 65
 6 / 15 / 2007 - 9 / 18 / 2007
Rank          Symbol        Name                         Price        Pct.Gain
---------     -----------------------------------       ----------    ------------
 1            SA                                         29.61         65%
 2            AEM           Agnico-Eagle Mines Ltd.      49.98         35%
 3            ABX           Barrick Gold Corp.           38.76         33%
 4            GOLD          ---                          29.84         30%
 5            FCX           Freeport-McMoRan C & G       103.3         22%
 6            ANO           ---                            3           21%
 7            MDG           Meridian Gold Inc.           31.61         20%
 8            XAU           GOLD STOCK INDEX             164.78        17%
 9            GG            Goldcorp Inc.                 28.9         16%
 10           FSAGX         FIDELITY GOLD                 39.65        15%
 11           SLW           Silver Wheaton Corp.          12.99        14%
 12           AU            Anglogold Limited             46.5         13%
 13           NEM           Newmont Mining Corp.          45.99        13%
 14           AGT           Apollo Gold Corp.               .45        12%
 15           GLD           StreetTRACKS Gold Trust       71.63        10%
 16           IAU           iShares COMEX Gold Trust      71.7         10%
 17           KGC           Kinross Gold Corporation      14.43         9%
 18           IAG           IAMGOLD Corp.                  8.17         7%
 19           GFI           ---                           17.24         5%
 20           AZS           ---                           11.42         4%
 21           CEF           Central Fund of Canada         9.48         3%
 22           EZA           ISHARES MSCI SOUTH AFRICA    131.59         2%
 23           HL            Hecla Mining Company           8.33         1%
 24           EGI           Entree Gold Inc.               2.24        -1%
 25           EGO           Eldorado Gold Corp.            5.69        -1%
 26           MGN           ---                            3.66        -2%
 27           RBY           Rubicon Minerals Corp.         1.58        -2%
 28           ASGMF         ---                            1.65        -3%
 29           SLV           ---                          128.68        -3%
 30           PAAS          Pan American Silver Corp.     26.71        -4%
 31           MNEAF         ---                            1.92        -5%
 32           GBN           Great Basin Gold Ltd.          2.51        -6%
 33           GSS           Golden Star Resources Ltd.     3.48        -6%
 34           CDE           Coeur d'Alene Mines Corp.      3.49        -7%
 35           NGD           New Gold                       6.38        -7%
 36           SSRI          Silver Standard Resources Inc. 34.6        -7%
 37           TIE           Titanium Metals Corp.          31.52       -8%
 38           RDIAF         ---                              .55       -9%
 39           SIL           Apex Silver Mines Limited      19.09       -9%
 40           CALVF         Caledonia Mining Corp.           .136     -12%
 41           HMY           Heilig-Meyers Company          11.61      -17%
 42           SWC           Stillwater Mining Company       9.85      -19%
 43           GRS           Gammon Lake Resources Inc.      9.97      -24%
 44           PAL           ---                             7.43      -29%
 45           EXK           ---                             3.3       -30%
 46           KRY           Crystallex International        2.73      -39%
 47           MGH           ---                              .8       -44%
 48           BMD           ---                             1.53      -51%
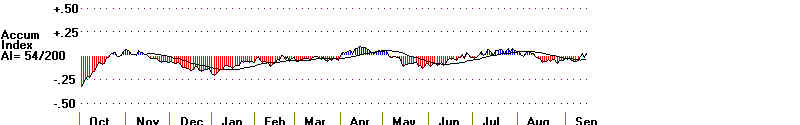
Another tool Tiger Software offers is the
ability to build your own index of any
group
of stocks. Here is the Tiger Index of 48 gold and silver stocks. It is a
composite
of all of them weighted by price times average volume. It lets us
see
Accumulation and an A/D Line. Right now the Tiger Gold Stock Index's
cumulative
A/D Line is not making a new high. So, most gold and silver stocks
have not yet made
new highs. There is
still red distribution. And aggressive
buying was
stronger in July. The
XAU breakout still needs to prove itself. I
think it will.
The Dollar is very weak now. And seasonality for gold stocks is
good until at
least January.
Tiger Index of 48 gold and silver stocks.

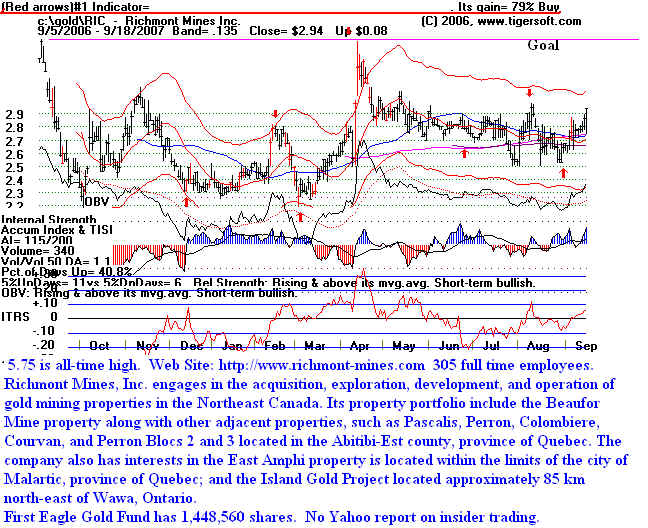
Want to speculate?
"Richmont (RIC) has a market cap of $50MM with $10MM in cash and a mill worth $30MM.
They are
buying back stock
and selling at 10 times 2007 earnings estimates. At today’s price, the market is
predicting
more
problems. They are un-hedged. They are leveraged to gold prices and the Canadian
Dollar."
(Source: http://seekingalpha.com/article/24948-gold-stock-earnings-to-shine-in-2007
)
News from
Yahoo - September 13, 2007 - http://biz.yahoo.com/iw/070913/0302074.html
Gold sales
increased by 28% in 2nd Qtr, while production costs declined $147 per Ounce.
http://biz.yahoo.com/iw/070802/0285606.html
From Yahoo message Board:
2.84 at the time of the Tiger Blog's posting of RIC..
POG (price of gold) @$720 will provide Additional
$50/oz profit to bottom line.
22,000 oz X Extra $50/oz = $1,100,000.00 Extra Profit
24 million shares = $0.0458/sh added profit
@ P/E of 8, added $0.36/share
$2.75 + $0.36= $3.11/share and adding.
So at POG $720, looks to me like you're losing $$$$ if you sell RIC below $3.11.
What happens if they hit on one or both mines this autumn?
BOOM! +100,000 ounces mined and a stock price +$5.25
Are you as intrigued as I am? "
Author: Goldisgoldisgoldisgolden
http://messages.finance.yahoo.com/Stocks_%28A_to_Z%29/Stocks_R/threadview?m=tm&bn=15480&tid=5567&mid=5567&tof=3&frt=2
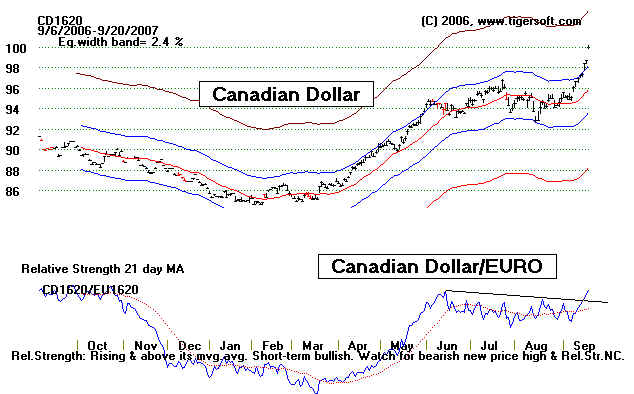
CANADIAN DOLLAR
Another way to play the prospects of a very weak dollar is to buy
the Canadian Dollar. Canada,
of course
is a major producer of natural resources. The trends we see will not change as long
as Bush's
trillion dollar blunder in Iraq continues to ooze blood, honor, prestige and dollars.
EZA
- SOUTH AFRICAN ETF
South Africa, long known as the world's biggest producer of gold is lagging. I would
look elsewhere for a good gold investment, though it will probably play catch-up. It
is underperforming
bullion (GLD)

===================================================================================
Let Tiger Boost Your Investments
These are some of the tools Tiger offers to analyze and pick from a group unoverse
of 48 gold and silver stocks, whose
data we provide each night. Seasonality studies and whether
to buy and the opening or at the
close and the projected next day;s highs and lows give you
still more reasons to use
TigerSoft. Give us a call - 858-273-5900.
|