New TigerSoft Short Selling
Tools and Techniques
Only $98.====> Get our TigerSoft Special Here
and run the same programs shown here.
We always look at the weakest stocks in order to
to make the lessons
as clear as possible. As the DJI has now
gone 55 months without a decline of more
than 10%, it would be wise to consider some short selling
techniques. Of course,
there are ETFs that now
let you be long on a short sale. And these are fine for many accounts.
But we make much more
money using the approaches outlined below and expanded in my book,
Killer Profits in Any Market using Tiger's Original
Accumulation Index.
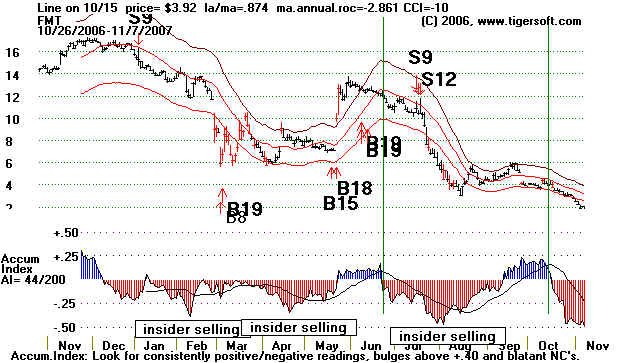
In the
chart below, notice first the bold major Peerless S9 and S12 Sell signals.
These are our most bearish general
market signals. The software lets you impose
them on any chart. The first
thing you will want to do when we get a reversing
Peerless Sell signal is to look at
the weakest stocks, stocks making new lows and
stocks in the weak groups.
It usually takes a few days for the market to roll over.
So you have a little time.
Selling FMT short on the January and June Sell signals
would have worked perfectly.
A
second powerful system is based on the original Tiger Accumulation. When it
dips below -.25, wait for the
next recovery. Then when the Accumulation Index goes back
below its moving average, sell
short. The vertical lines illustrate where short sales
would have been made using this
system. The best such "Accumulation Index MA
penetration Sells" take
place between 4 and 8 weaks of the previous dip and coincide
closely in time with a price
violation of the 50-day ma.
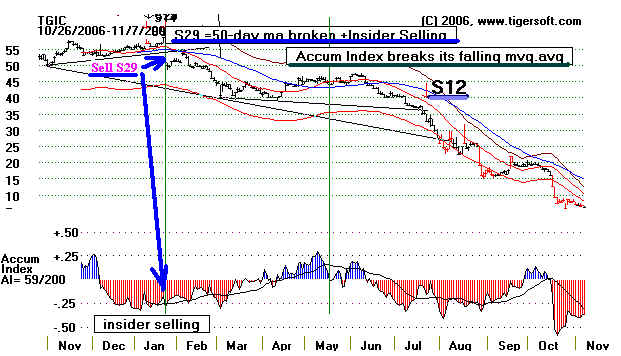
A third, very simple approach also based
on the original Tiger Accumulation
is to sell short when our index is
deeply negative and the stock violates its 50-day ma.
Very negative Accumulation Index
readings below -.25 show, we postulate, informed
insider selling if the stock
then starts to weaken more than the market as a whole.
That is true for TGIC below
in January. The rest of the market turned up in February,
but not TGIC. A
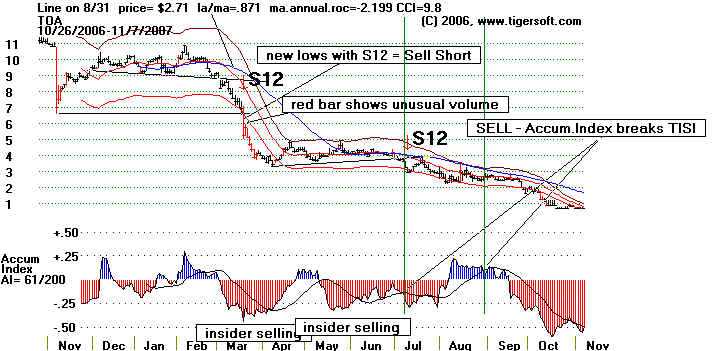
fourth system is based on our proprietary S12 Sell for stocks.
You will see that in many of
of the charts here and charts that show weakness that
is exploitable by the
short seller using TigerSoft. The Tiger S12 is not the same as the
Peerless S12. It
is based on the stock's behavior, not the Dow Jones, as is the case
with the Peerless S12.
In May, the Accumulation Index falls back below its moving
average after
previously dipping beloiw -.25. This constitutes a great place to
go short a stock that
is clearly underperforming the market. It means the effort to
support the stock is
ending. So, it becomes vulnerable. It did hold up for a few weeks.
That was because the
overall market was strong until our July 17th major Peerless Sell.
The chart of TOA shows the same principles. To that
we add the idea of looking at our
Tiger
charts to see if the daily price bars turn red. If that happens on a new low, as it
did in March
you
have another sign to sell short immediately. Here it was augmented with a Tiger
Sell. In
all
these charts the preponderance of color from the Accumulation Index is red. That is
the most reliable
sign
of all that the stock is under big money distribution and it will probably trend lower.
Look
for more materials here, late this weekend.
|