wpe1E.jpg (33803 bytes)

         Daily Blog - Tiger Software

                     November 6, 2007 

   ATTRACTIVE SHORT SALES NOW

          Short Selling Techniques:
         That Will Make You Money


Back to Home Page

__________________________________________________________________
                  Index of All Tiger Blog Topics

       If you like our stock market insights, think how
       much you will like our Software and Hotline.
                      www.tigersoft.com

       
People have asked me to write a Daily Blog.  
    They seem to want  me to give them a thought
    or two each day.  About what?     Well,   we'll just
    have to wait and see.  As, I see it, a blog is a
    personal statement.  I will try to make it enter-
    taining and relate it mostly to the stock market. 

          I do promise not to belabor the obvious. So,
    I hope these thoughts, reflections and finds are
    worth your time.  I will give you my best
.

        Send any comments or questions
        to william_schmidt@hotmail.com


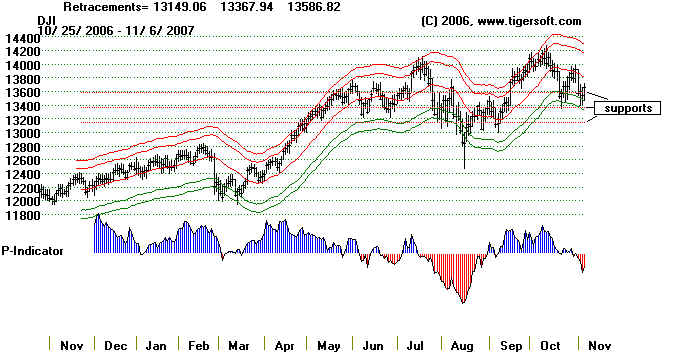
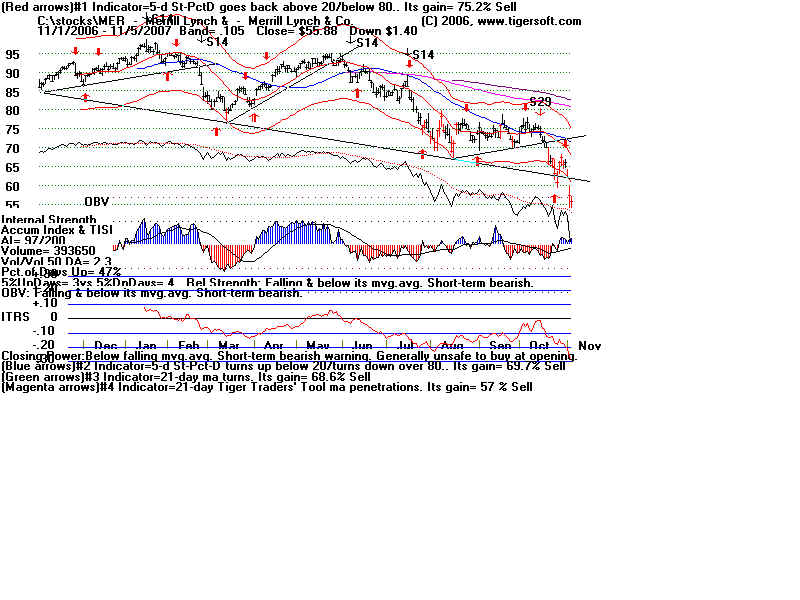
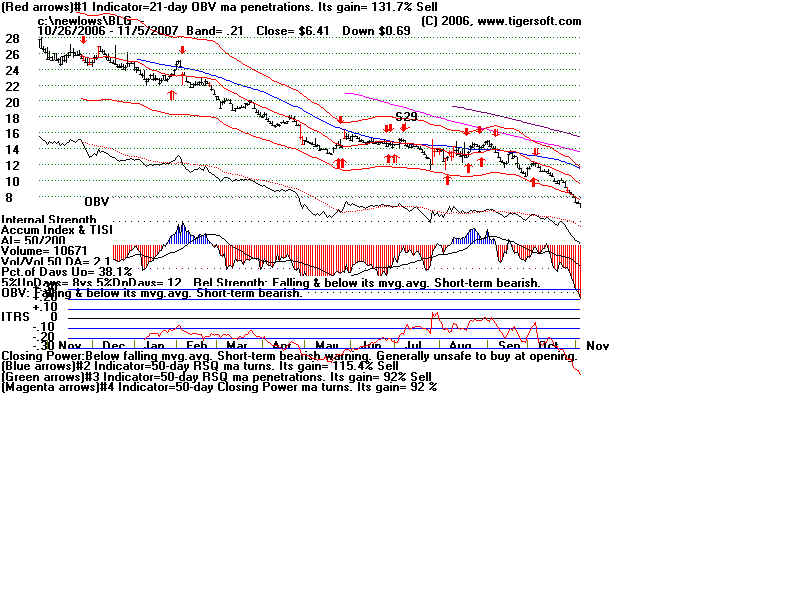
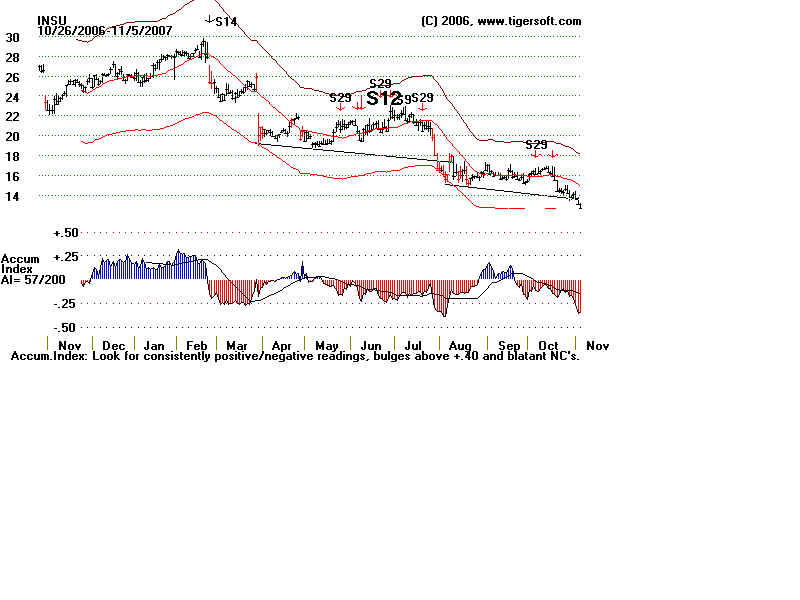
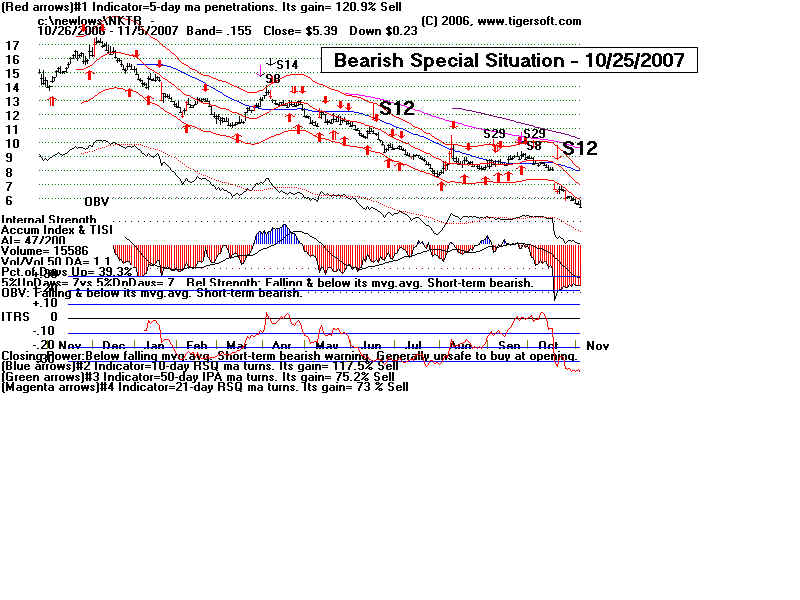
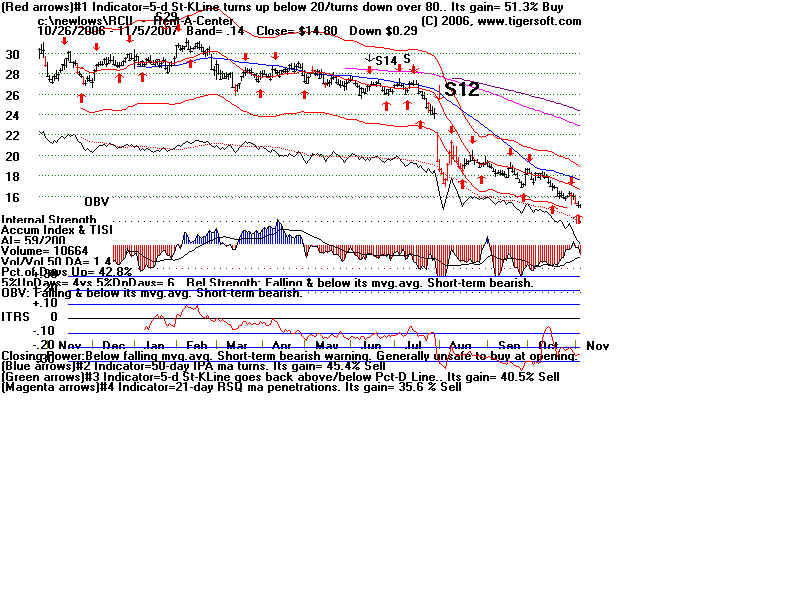
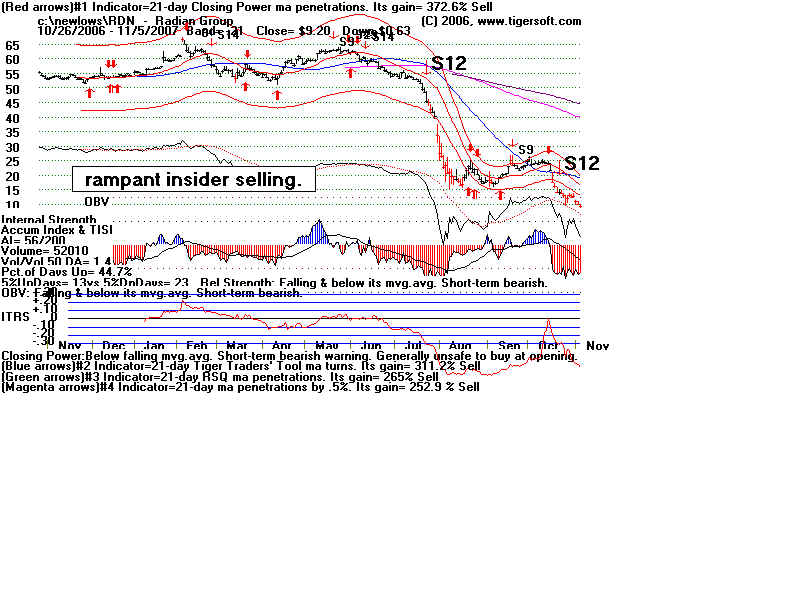
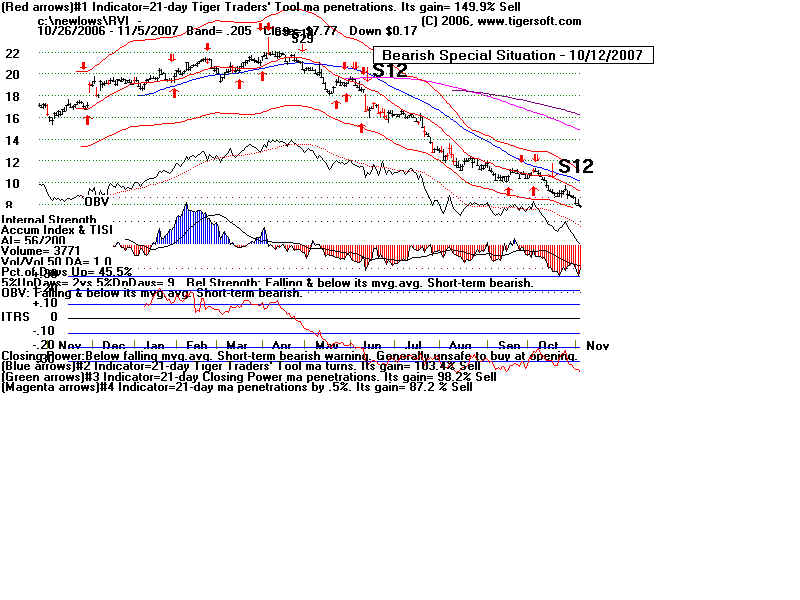
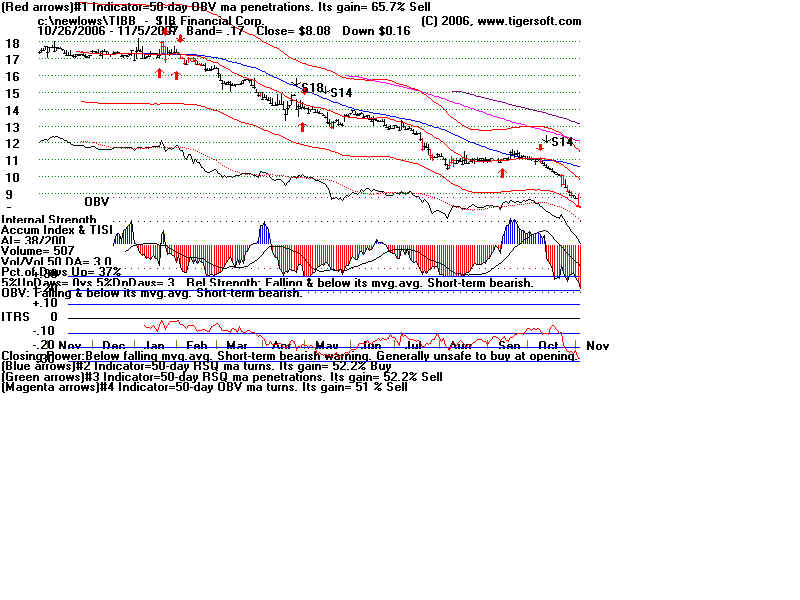
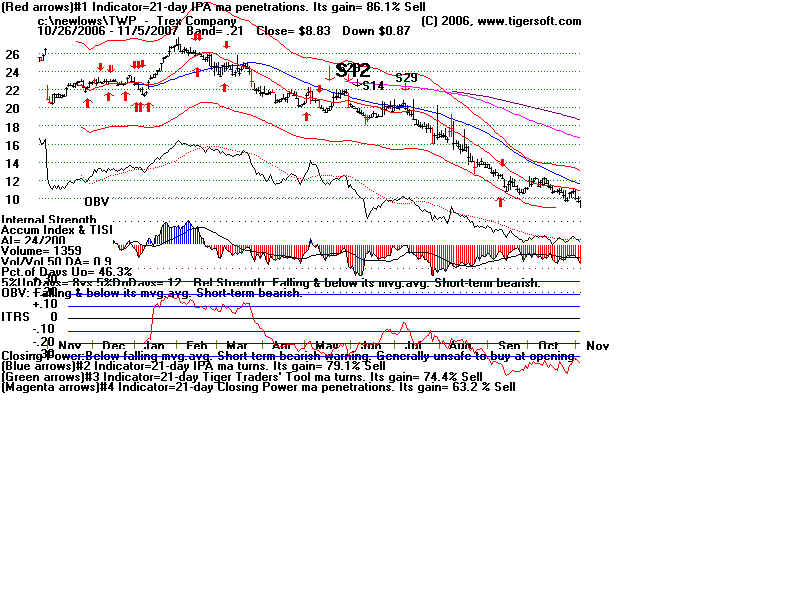
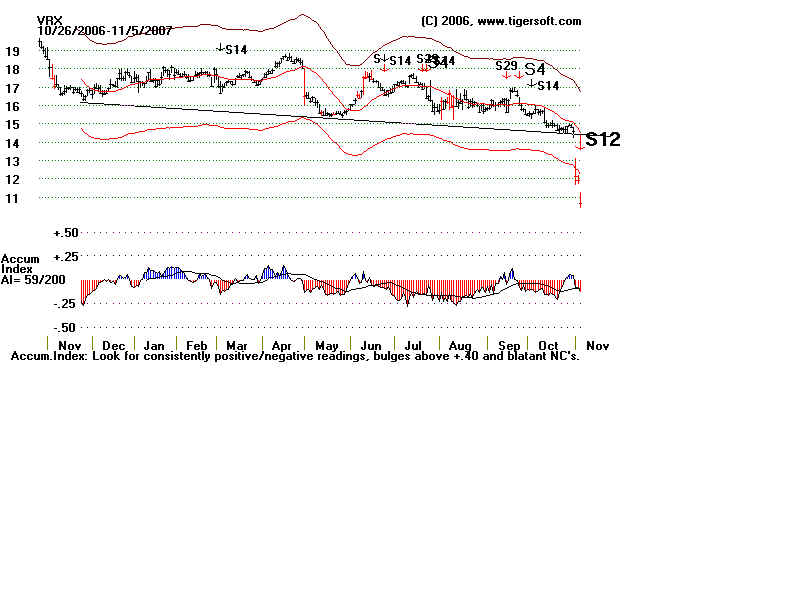
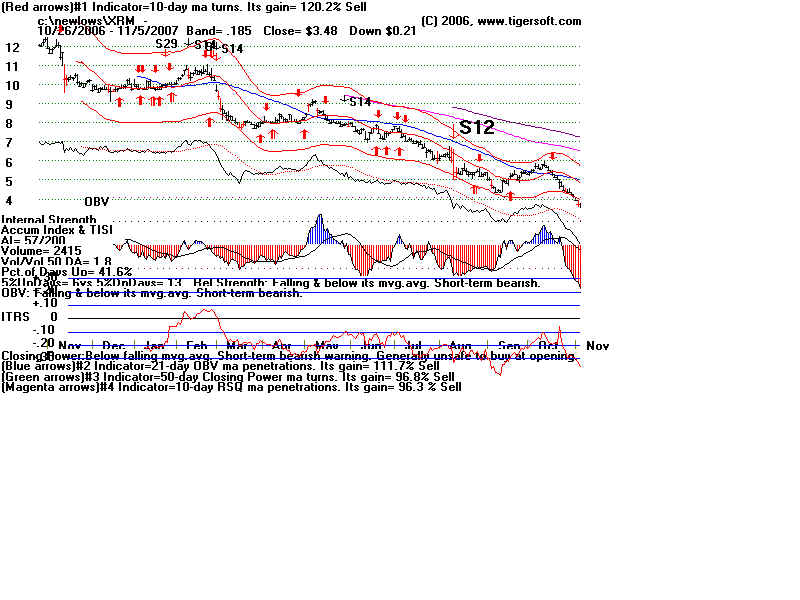
This Market Has Problems:   The Stocks below Look Awful!

            
Picking Great Short Sales As A Hedge


                           Our Hotline looks at NYSE New Lows every day, the total count and the individual stocks
                    on the list.   One of  the key ways to spot an intermediate term decline or a bear market is to
                    note how quickly NYSE new lows exceed new highs very soon after the DJI makes a new high.
                    I read this in an article in Barons many years ago, so I can't tell you whose idea this first was or
                    gives its historical pedigree.  But you can see it worked this summer.  As the DJI was making
                    a new all time high on 7/17/07 and we were getting a major Sell from Peerless,  we noted that
                    NYSE new lows were 80 and new highs were only 45.  This was a very bearish sign.

                          Another way to view new highs and lows is simply to go to:
                                    http://tal.marketgauge.com/dvMGPro/gauges/TodaysGauges.asp    The two charts
                    below are explained on-line.  A falling below 70 gave a fine sell signal at the most recent
                    peak, though the June Sell signal was premature.  This also tells you when it is safe to buy again.
                    A variation of this tool I used for many years when Harry Lankford published his little weekly
                    pocket charts.  I would simply look for the NH/NL ratio drop below 75 and stop chasing
                    breakouts.   At that point there was too little follow-through and too many false breakouts.
                    But the beauty of the indicator was that it kept us properly bullish for long periods of time
                    when a bull market made that appropriate. 

  -------------------------------- NYSE New highs and Lows -----------------------------------------


wpe12.jpg (41851 bytes)

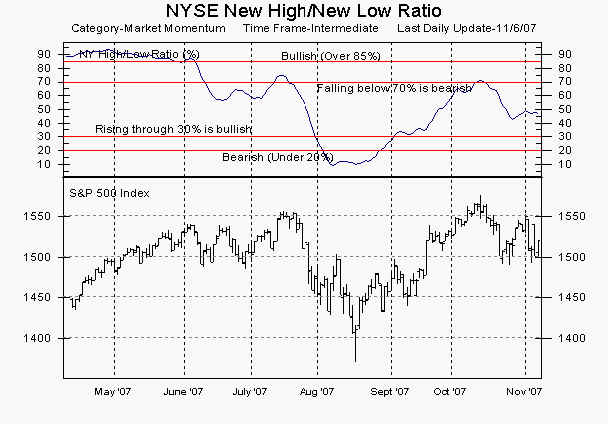
     -------------------------------- NASDAQ New highs and Lows -----------------------------------------

wpe13.jpg (50293 bytes)
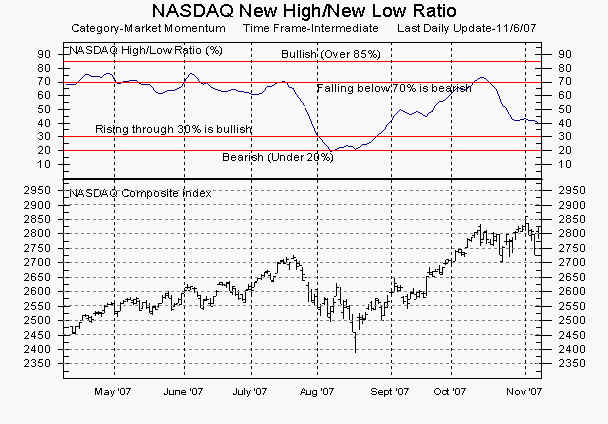
                       (Source: http://tal.marketgauge.com/dvMGPro/Charts/Charts.asp?chart=NYHILO )  


                                      New Highs Systems Abound. 

                               People have all sorts of systems for buying new highs and seeking gains from the
                   huge gainers.  This works superbly, of course in a bull market.  We have our Tiger Insider-Buying
                   system using augmented Buy B24s and holding automatically a year, but using a stop loss of
                   10% below the first augmented B24.  That system is now explained in the back of my Explosive
                   Super Stocks book.

                          Just to get you thinking I set forth one such system.  It is called Haller's 200 Profit Strategy.
                   A goal of 200% is sought when buying a stock making a new high.  A stop loss is used 20% below
                   the purchase price and as the stock trend upward, one uses a stop loss 26% below the highest
                   intra-day price achieved.   Buying strong stocks on 15% pullbacks from their highs is part of this system.
                   In that case, use a 15% stop loss.  The stop losses are on a closing basis.  Investors Daily has
                   publicized the notion of buying strength, namely buying new highs and using a 7% stop loss.  William
                   O'Neill should give more credit to his source of this trading approach, Nicholas Darvas who wrote
                   two books:   You can see something about this icon of technical trading immediately below. 

                                              New Lows Trading Systems

                          I appreciate that short selling is not something some of you do much of.   But I think it is timely.
                   More and more stocks are  making new lows.  You can see some of the more bearish charts below
                   the section on Darvas.  Since bear market seems unavoidable given the dramatic fall of the dollar, I think
                   a study of  new lows will be helpful.  This extends what I have written in my book on Short Selling using
                   Tiger's Accumulation Index.  For the materials on new lows, please skip the section on Nicholas Darvas
                   just below..
              

====================================================================================
       NICHOLAS DARVAS - Author of A Very Influential System for Trading New Highs
                           wpe14.jpg (24872 bytes)
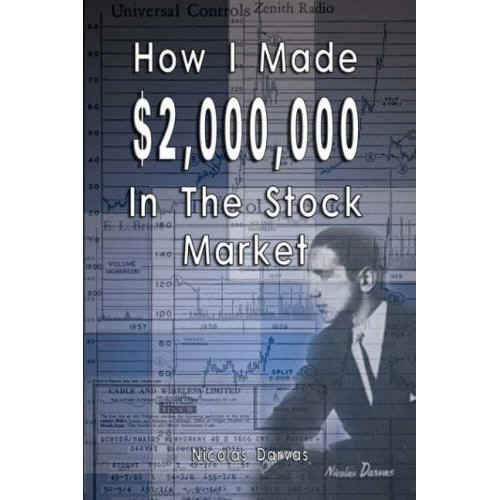
                           Nicholas Darvas    How I made $2,000,000 in the stock market , 1964
                          and revised and updated 1975.   Also:  Wall Street The Other Las Vegas.

                               Before Darvas came to America he studied economics at the University of Budapest.
                         In1951, he immigrated to the United States, where he trained with his half-sister, Julia, to be a
                         ballroom dancer. And he was a very good dancer, touring the world by 1956.   He started investing
                         in 1952, a ballroom dancer who had never invested in the stock market. But a Toronto nightclub
                         couldn't pay him in cash, so they paid him with three thousand shares of a Canadian mining company
                         called Brilund. Two months later, the stock tripled and Darvas made a tidy profit. An investor was born.
                        Like anyone beginning to trade on the stock market, Darvas made his mistakes. When he started out,
                        many of his trades were gambles. He would pick companies that were the next big thing, or that came
                        recommended by other traders. Many of his first large trades resulted in a huge losses. But cheered
                        on by whatever small profits he did make, Darvas began asking questions about why stocks behaved
                        the way they did.   Realizing that even experts couldn't predict the market, Darvas decided that he needed
                        to acquire his own understanding. He began devouring newsletters, books, tip sheets, “hot tips”, and
                        so-called insider information, in his quest to understand the market.

                            Yet, despite his arsenal of knowledge   Darvas continued to lose money. In 1955, he purchased
                       over fifty thousand dollars worth of a company called Jones and Laughlin. Jones and Laughlin had an
                       excellent price to earnings ratio, high dividends, and was in a strong industry group. He was so
                       confident in his analysis, that he bought most of this stock on margin. Then Jones and Laughlin began to
                       fall.   Jones and Laughlin`s price fell far enough to account for a $9,000 loss. In a desperate attempt to
                       recoup his losses Darvas bought a stock he knew virtually nothing about. Soon it had risen to a point
                       where he regained about half of his losses.

                              At this point in his career, Darvas was frustrated with his attempts at analyzing stocks. With
                      Jones and Laughlin, he had put a value on the stock and expected the price of the stock to behave
                      as he expected. When the stock price fell instead of climbing as expected, Darvas finally accepted that
                      his method wasn't working. He decided there wasn't much worth in analyzing stocks by trying to assess
                      their value. Annoyed with information from tip sheets, friends, so called experts, and even Wall Street
                      maxims, he decided to shun most of these common sources.

                              In 1956 Darvas embarked on a two-year tour of the world to showcase his ballroom dancing.
                     During this time he developed his famed Darvas Box method of screening stocks. Wanting to keep up
                     on his holdings in stock he already owned and always on the lookout for new stocks, Darvas looked for
                     ways to get American stock quotes while he traveled. This was a daunting task, but arrangements were
                     made to obtain a copy of Barons or the Wall Street Journal through United States Embassies, and
                     Brokers wired time sensitive information when needed.

                             Without brokers, friends, or other investors to influence him, Darvas developed a method of picking
                     stocks based solely on the stock's price and volume. It was based on stocks rising above a previous
                     set of highs and letting the stock rise afterwards, using a stop sell below earlier lows.   By the time he
                     returned to New York in 1959 he had made about $500,000. After Darvas returned to New York,
                    people who were amazed with his success began to give him “hot tips” and stock advice again. Darvas
                    listened to them, and took huge losses on the fortune he had made.  This was also a period of time
                    when the overall market was weak.

                             Realizing that it was the human element in stock trading that was his downfall, Darvas sequestered
                   himself in Paris in February of 1959. He made arrangements with his brokers to make all his trades via wire
                   and get the day's highs, lows and closing prices. Using very little data, and a lot of intelligence and discipline,
                   Darvas perfected his Box method of picking stocks. Within six months, he had turned a profit of two
                   million dollars. 

===================================================================================
                                   

                     New Lows Trading Systems        
         
         How to Trade Using Fibonacci Retracements 
                                        Leonardo Fibonacci was a 13th century mathematician who, among other things, noted
                               that there are certain ratios that tend to reoccur in nature.   The common ones that he identified
                               were 38.2%, 50%, and 61.8%.  For example, the distance from your fingertips to your wrist
                               is 38.2% of the distance from your fingertips to your elbow.  There is overwhelming evidence
                               of Fibonacci ratios operating throughout nature.

                                       We can us these naturally recurring ratios to help us anticipate stock market activity. 
                              What we can do is watch for retracements to these levels.  For example if a stock has just completed
                              a 10 point run, say from $90 to $100 and is now pulling back.  We would expect the stock to
                              retrace to $96.18 (38.2% retracement from $100) if it does not turn there we would next watch
                              at $95 (50% retracement from $100) and the next level would be $93.82 (61.8% retracement from
                              $100).

                                       Short sellers would notice when a stock retraces more than 67% of its gain.  That would suggest
                              a test of the lows.   The Tiger charts let you produce these retracement levels.    After a chart is on the
                              screen, chose Operations and  Likely Retracement Levels.  Then point the mouse at the most recent
                              lows and click.  Do the same with the most recent highs.  The resulting chart shows where a simple
                              33%, a 50% and a 67% retracemetn level would be,  The 50% retracemetn is probably used
                              more than any other by professionals. 
                             wpe15.jpg (50104 bytes)

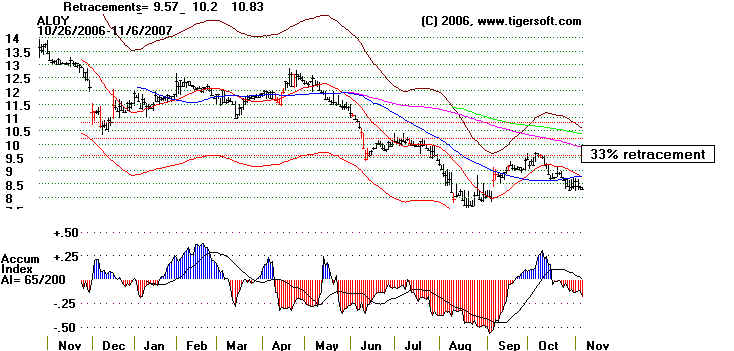
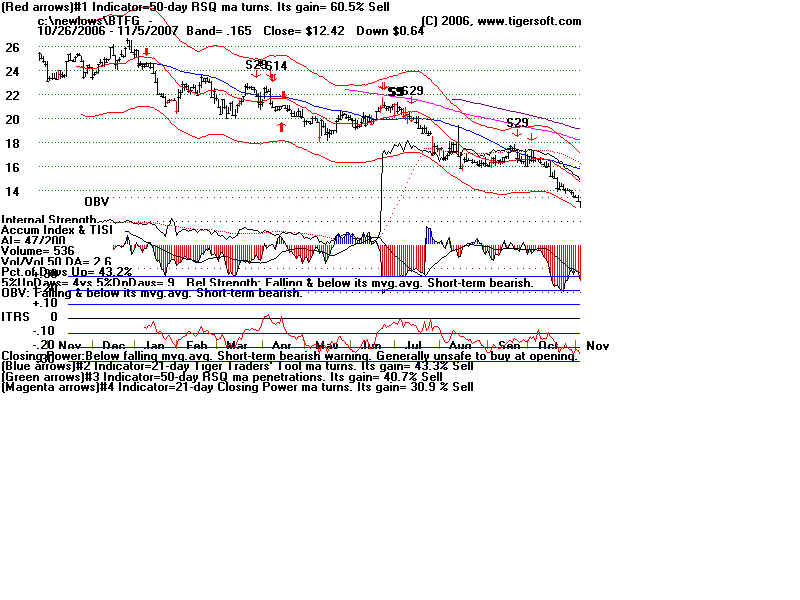
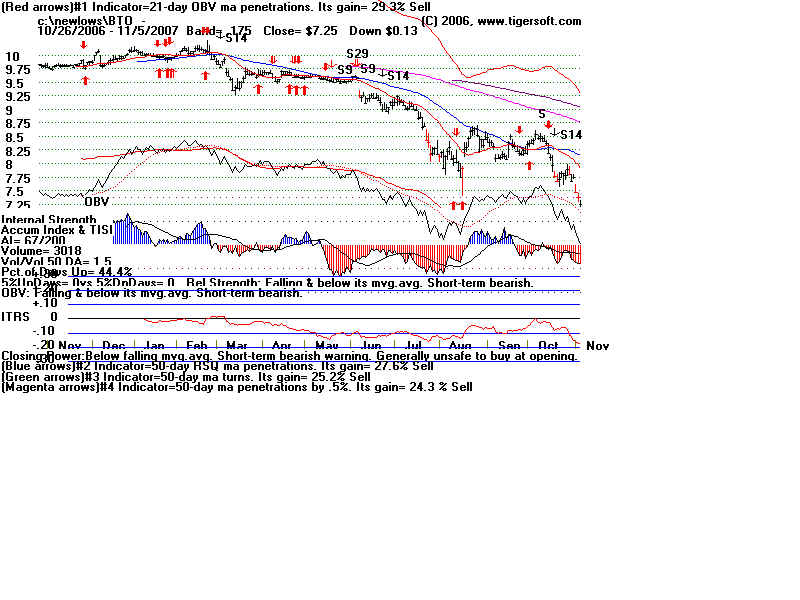
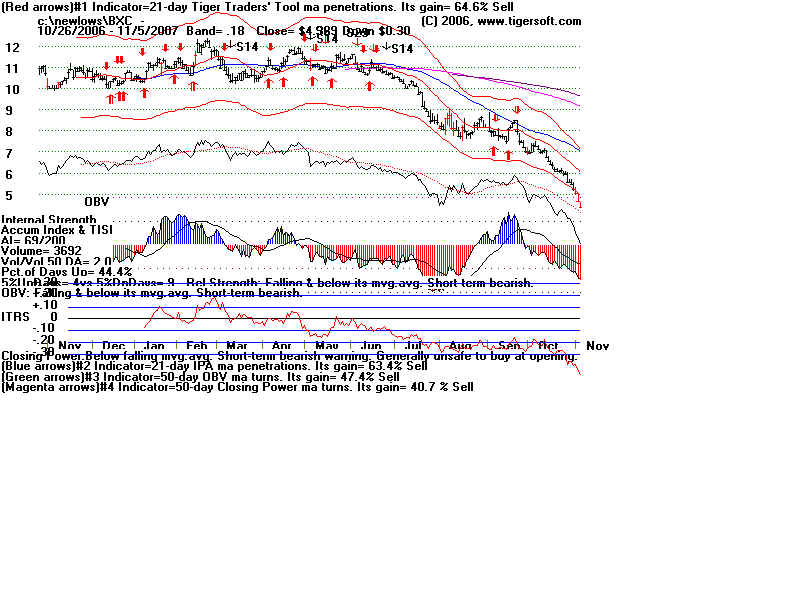
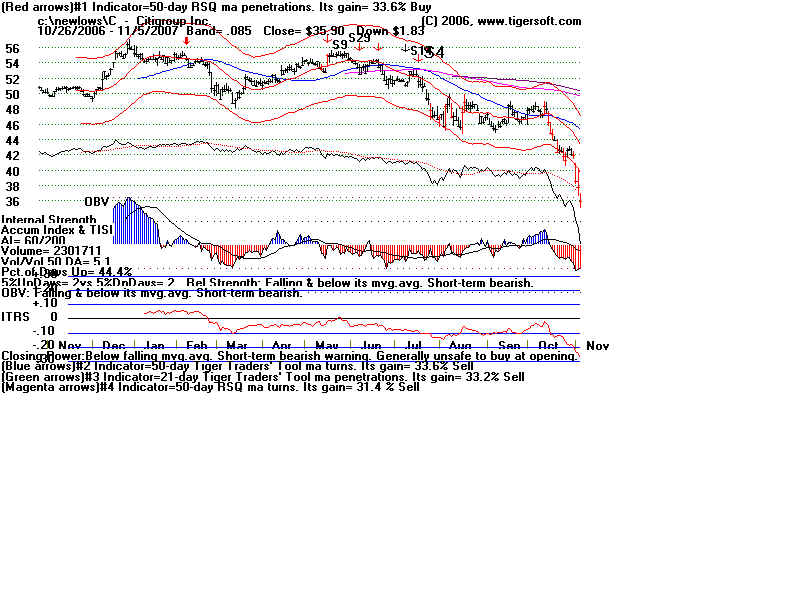
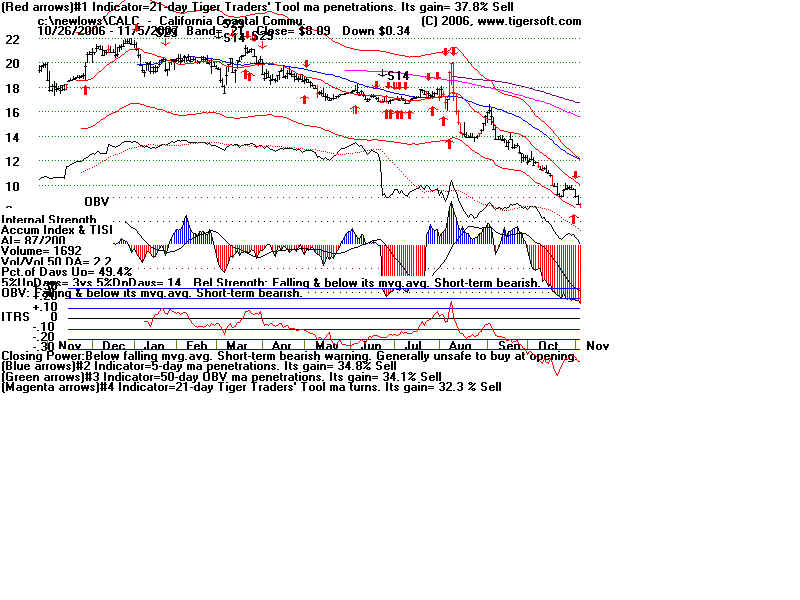
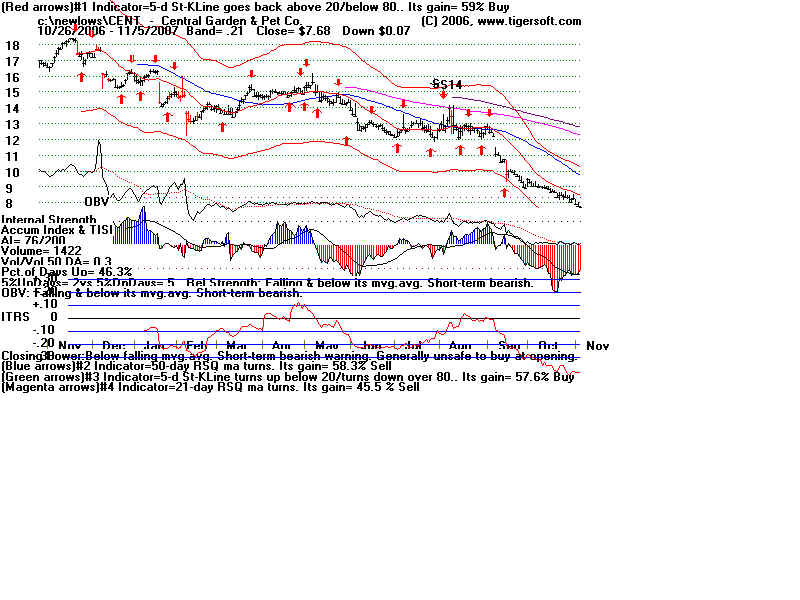
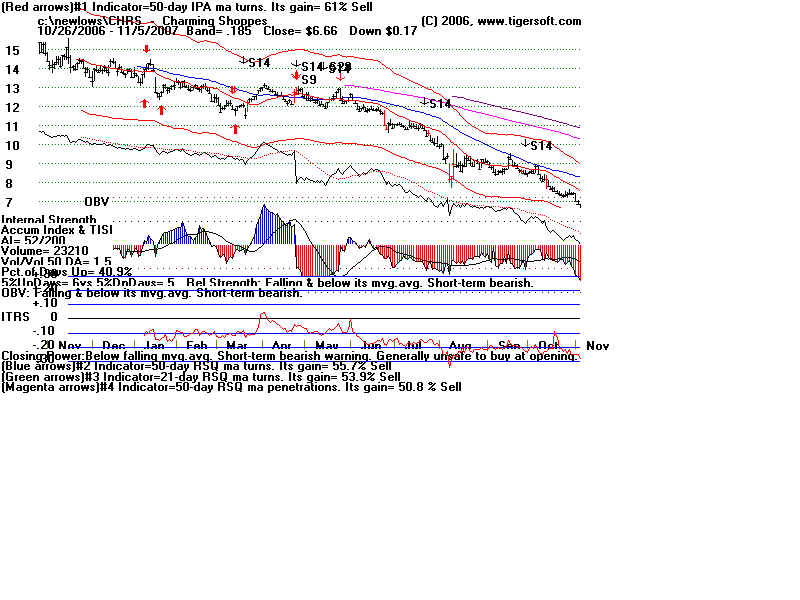
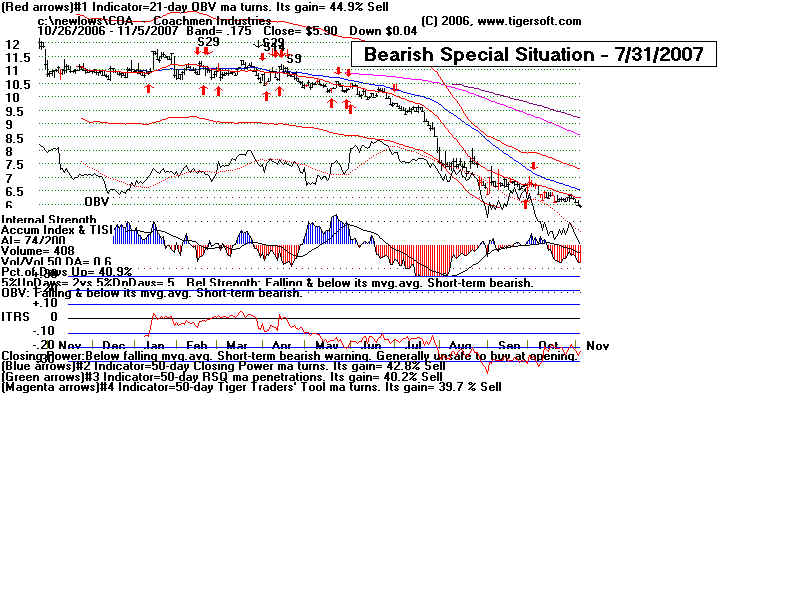
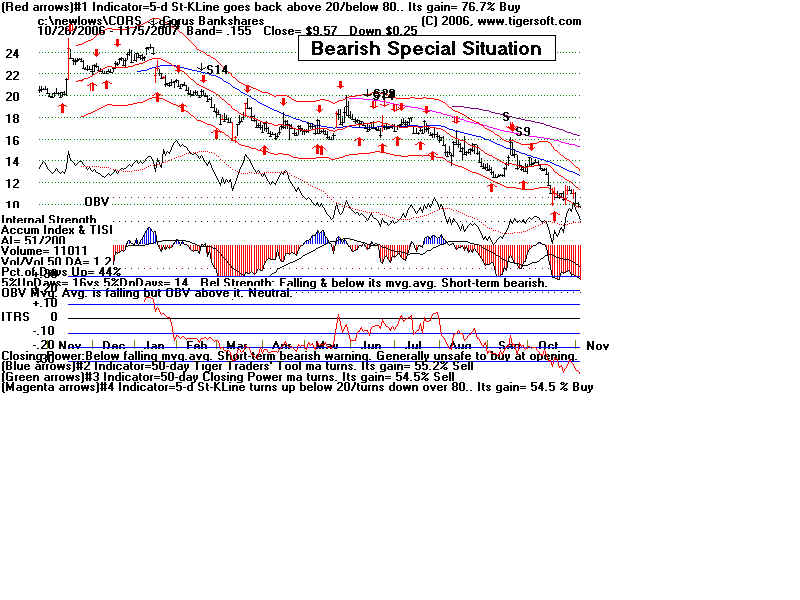
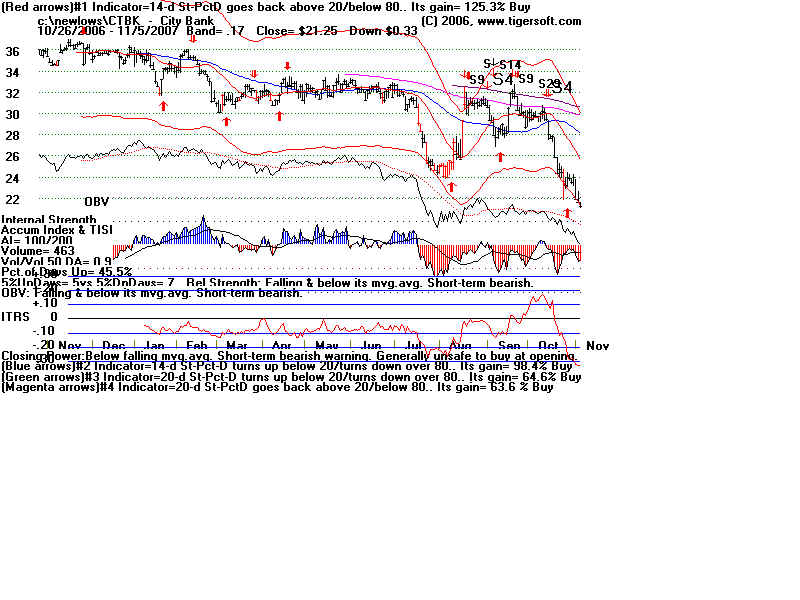
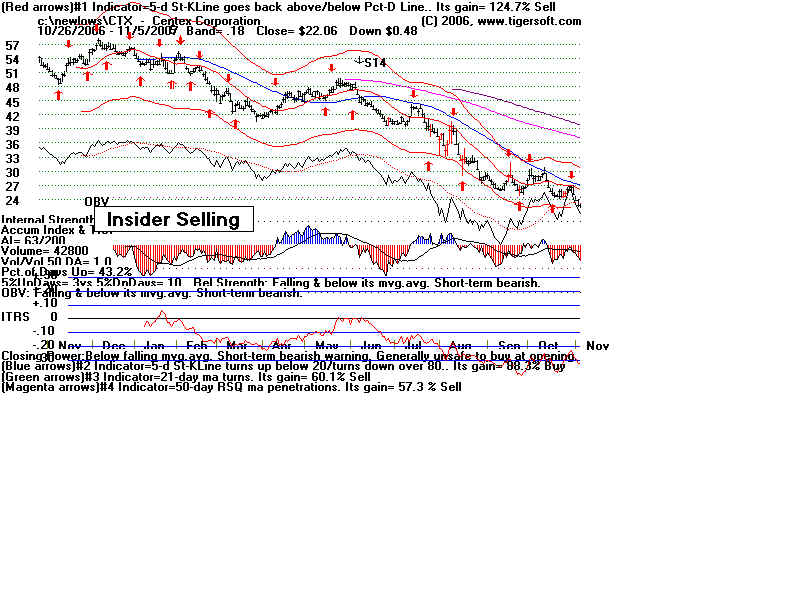
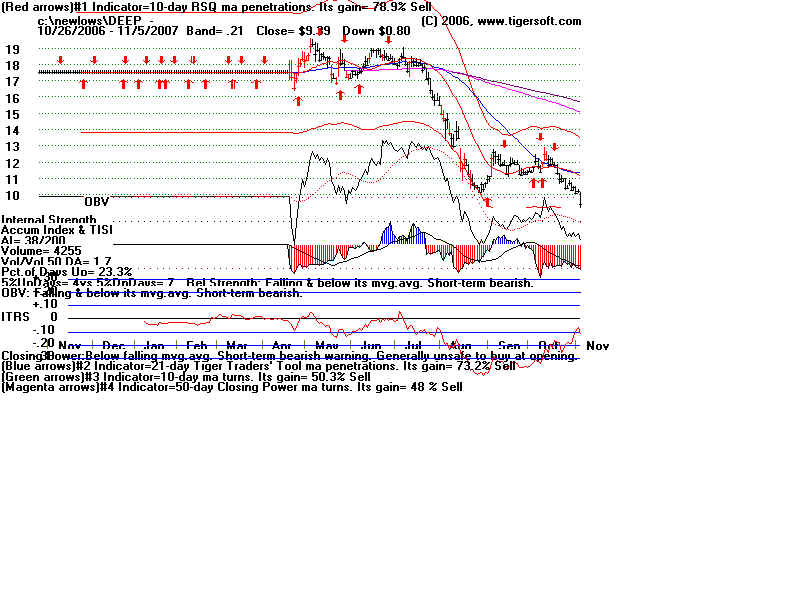
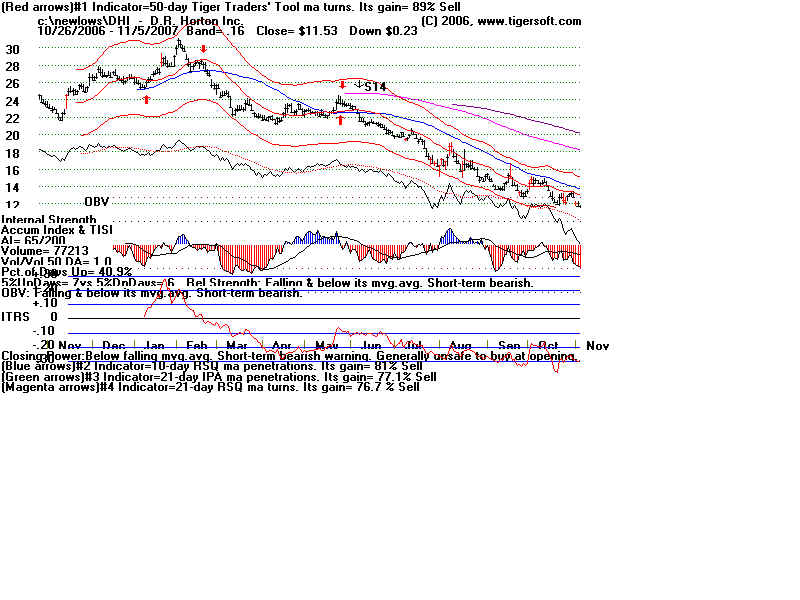
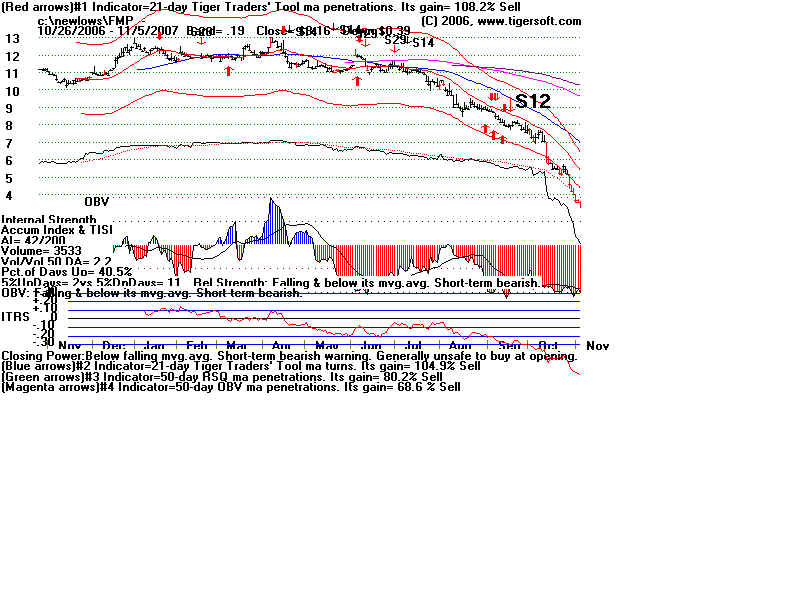
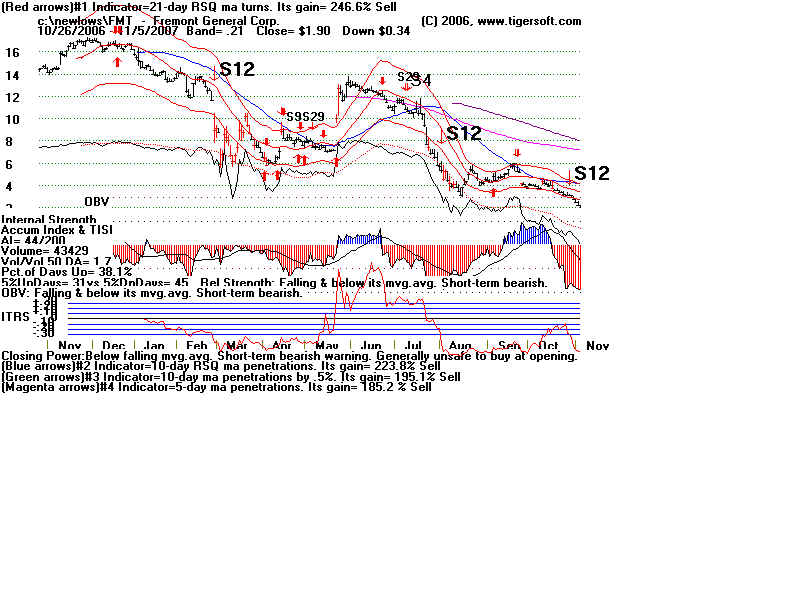
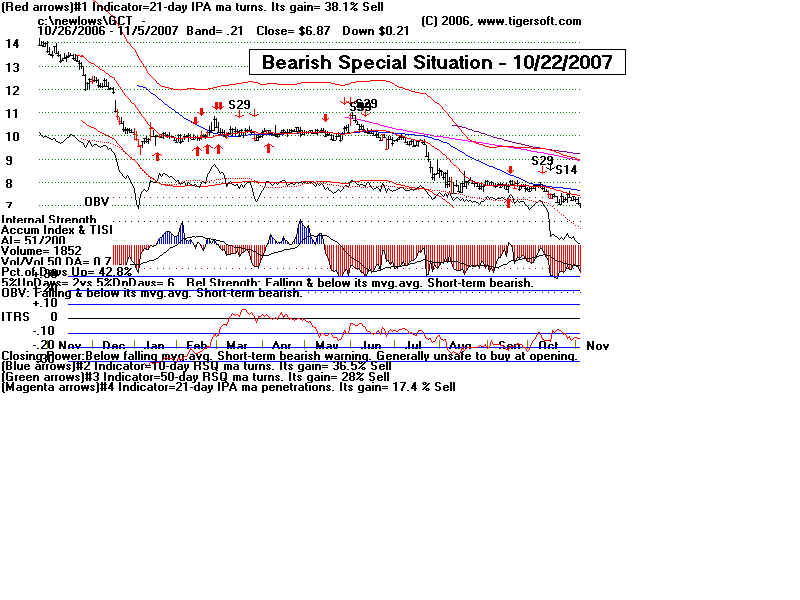
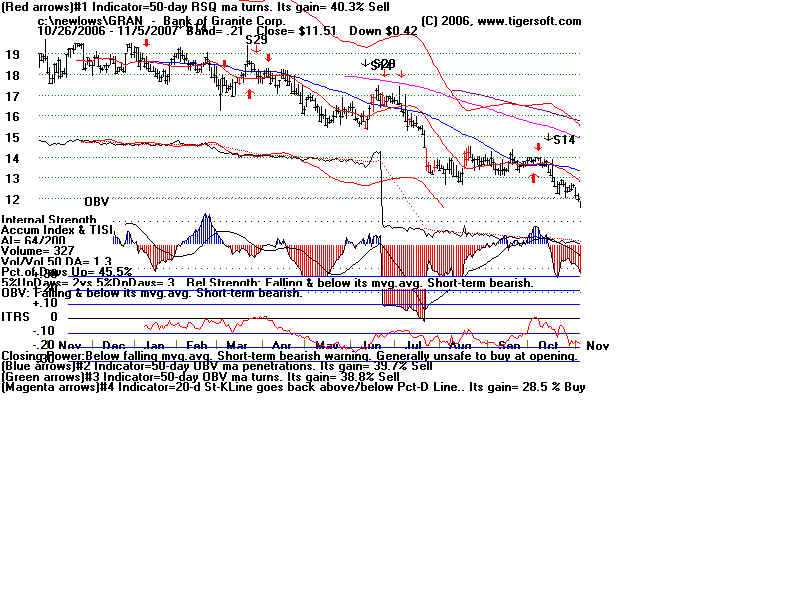
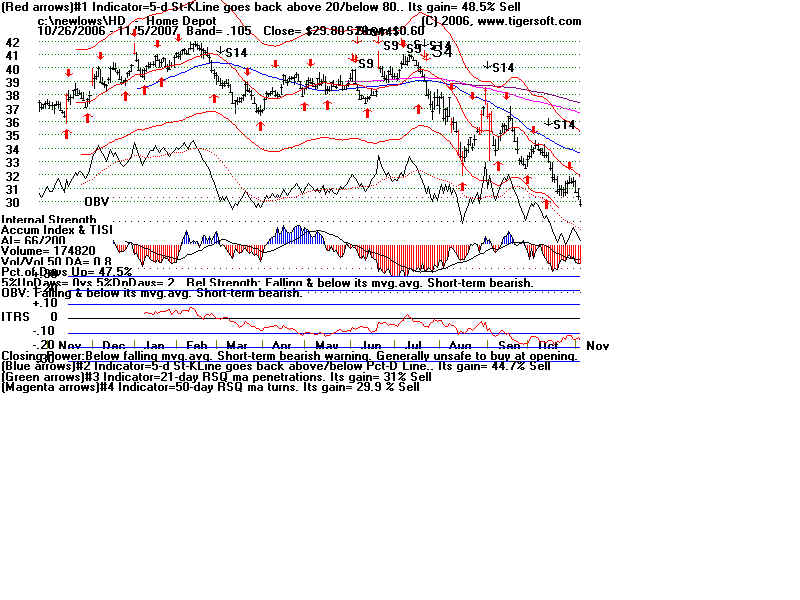
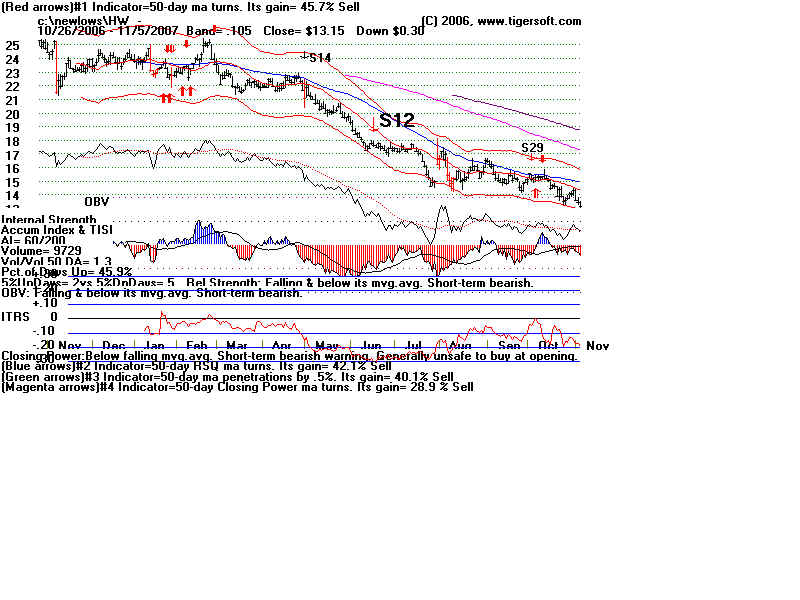
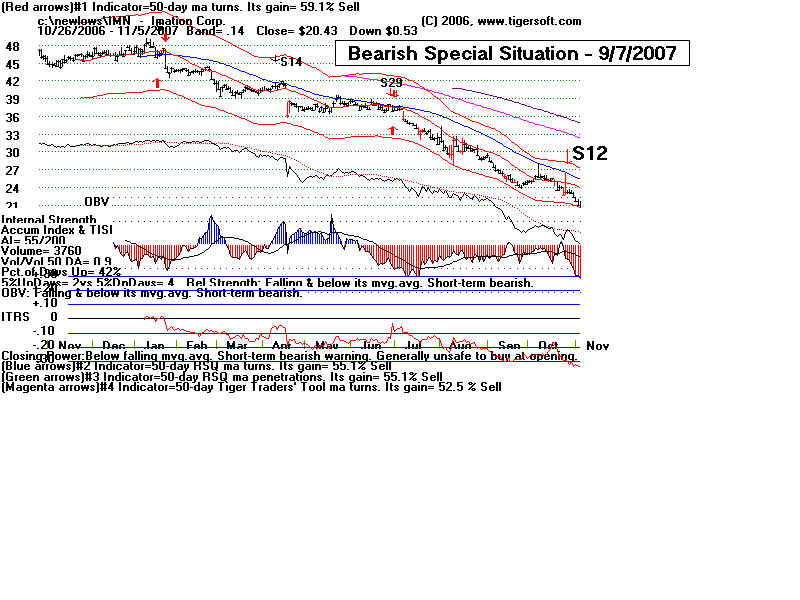
                                             Short sellers will often pounce on a weak stock that makes a 33%
                            recovery of what it has lost.  See this in the chart of ALOY.  As it turned out
                            9.5 was a good point to sell short and that was on a 33% retracement of its
                            decline from 12.7 to 7.7.

                           wpe16.jpg (53102 bytes)


              In the charts below, consider a reverse Darvas System.    Sell  short on a
               Tiger confirmed new low and hold short so long as stock does not make a
               6 week closing high and intra-day high.

                                      MER short at 75 now 55.
                                      BLG short at 20 now 8.
                                      to be continued...


MER.BMP (1920054 bytes)


          Sell Short An Internally Weak Stock on A Tiger Automatic Sell or
          when it crosses back below its falling 50-day ma with a negative
          Accumulation Index.    Hold It Short so long as it does not rise above
          its blue 50-day ma  with the Accumulation Index positive.  
          This is demonstrated below. 

          When the market looks dangerous, I pick short sales among stocks
          that are making new lows for 12 months with a current Accumulation
          Index below -.15 and with the OBV confirming the new lows.  Consider
          relative strength.  The first stocks making new lows are the most
          vulnerable.  And pick stocks in weak groups.
         
          Other materials are available in my book on Short Selling and its supplemental
          materials.


BLG.BMP (1920054 bytes)

BTFG.BMP (1920054 bytes)

BTO.BMP (1920054 bytes)

BXC.BMP (1920054 bytes)

C.BMP (1920054 bytes)

CALC.BMP (1920054 bytes)

CENT.BMP (1920054 bytes)

CHRS.BMP (1920054 bytes)

COA.BMP (1920054 bytes)

CORS.BMP (1920054 bytes)

CTBK.BMP (1920054 bytes)

CTX.BMP (1920054 bytes)

DEEP.BMP (1920054 bytes)

DHI.BMP (1920054 bytes)

FMP.BMP (1920054 bytes)

FMT.BMP (1920054 bytes)


GCT.BMP (1920054 bytes)

GRAN.BMP (1920054 bytes)

HD.BMP (1920054 bytes)

HW.BMP (1920054 bytes)

IMN.BMP (1920054 bytes)

INSU.BMP (1920054 bytes)

NKTR.BMP (1920054 bytes)

RCII.BMP (1920054 bytes)

RDN.BMP (1920054 bytes)

RVI.BMP (1920054 bytes)

TIBB.BMP (1920054 bytes)

TWP.BMP (1920054 bytes)

VRX.BMP (1920054 bytes)

XRM.BMP (1920054 bytes)


Hit Counter