|
PEERLESS
AUTOMATIC BUYS and SELLS ON EWQ (ETF for France): 1998-2011 +26.2% Average Annual Profit
+26,2%
avg le gain annuel qui applique PEERLEESS à EWQ (France) |

 |
Daily Blog - Tiger Software Send any comments or questions
|
How To Boost Your Retirement Account
Suggestions:
Peerless Stock Market Timing: 1928-1966 Track Record of Major Peerless Signals
Earlier Peerless-DJIA charts 7 Paths To Making 25+%/Yr. Using TigerSoft
Index Options FOREX trading Investing Longer-Term Mutual Funds
Speculative Stocks Swing Trading Day Trading Stock Options Commodity Trading
EWQ was first traded for a full year in 1998. When we super-impose the Peerless DJI-based
Buys and Sells on EWQ by year we get an average return of 26.2% per year. Only the bear
market year would have produced a loss. Here we assume the trades are all taken at the
opening the day after the Buy or Sell signal. The software does these calculations on any
investment, and assumes $10000 is full invested at the start and all profits are used to remain
fully invested. For each trade, it is assumed that the cost of commissions and slippage is $20.
The charts for each year are shown below.
EWQ a été premièrement échangé pour un complet an en 1998. Quand nous super-impose les Achats
et Ventes DJI-bases hors pair sur EWQ par l'an nous obtenons un retour moyen de 26,2% par an.
Seulement l'an de marché à la baisse aurait produit une perte. Ici nous supposons que les commerces
sont tout pris à l'ouverture le lendemain le signal d'Achat ou Vente. Le logiciel fait ces calculs sur n'importe
quel investissement, et suppose que $10000 sont pleins investis au début et tous les profits sont utilisés pour
rester entièrement investi. Pour chaque commerce, il est supposé que le coût de commissions et de retard
est $20. Les graphiques pour chaque an sont montrés ci-dessous.
1998 + 26.0%
1999 + 21.0%
2000 -1.0%
2001 +18.8%
2002 +8.0%
2003 +41.3%
2004 + 20.2%
2005 +7.8%
2006 +50.0%
2007 +38.1%
2008 +16.4%
2009 + 67.8%
2010 + 26.7%
2011 + 25.4%
-------------------
Avg, 26.2%
1998 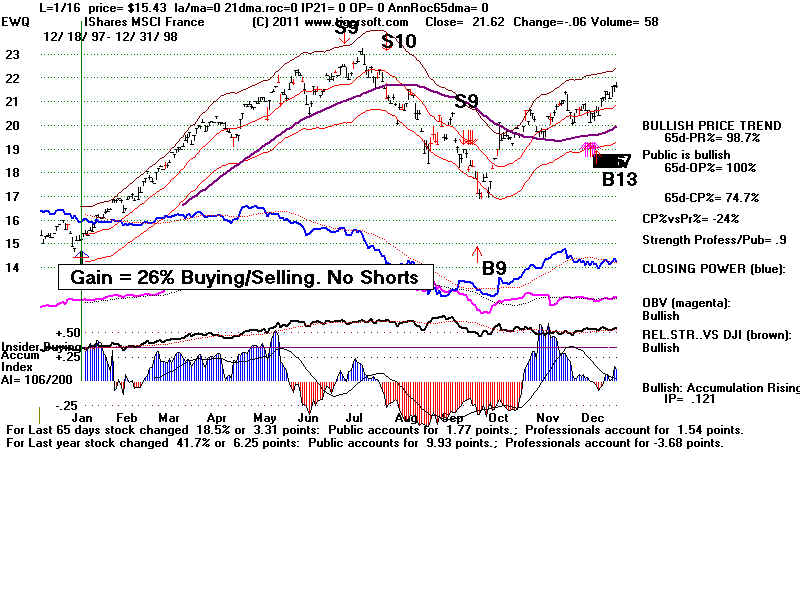 |
1999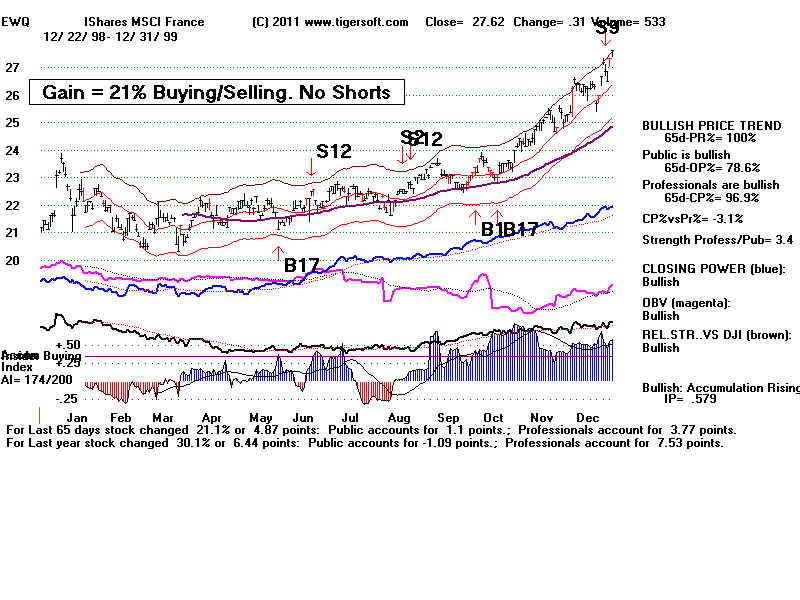 |
2000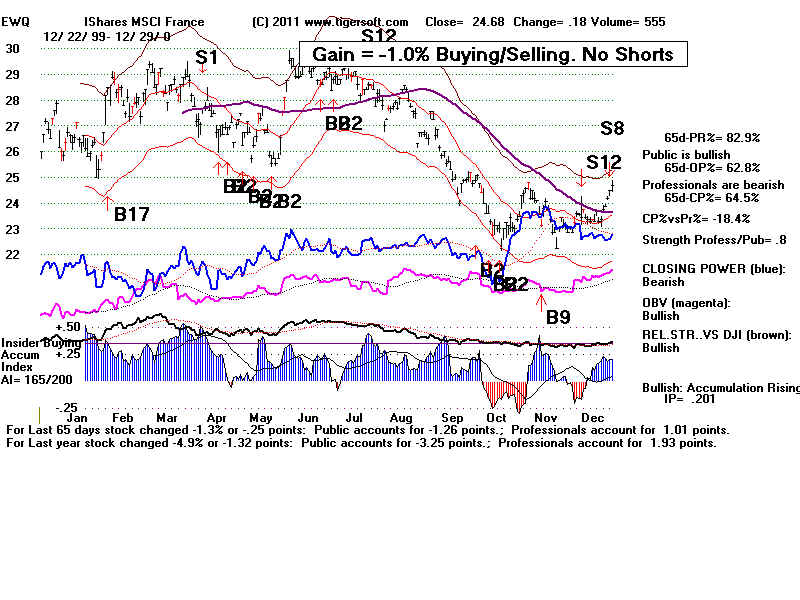 |
2001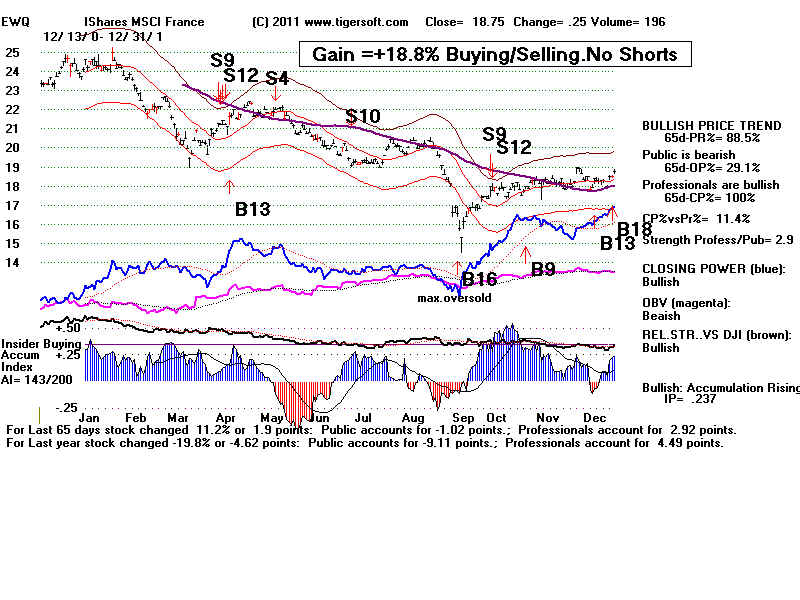 |
2002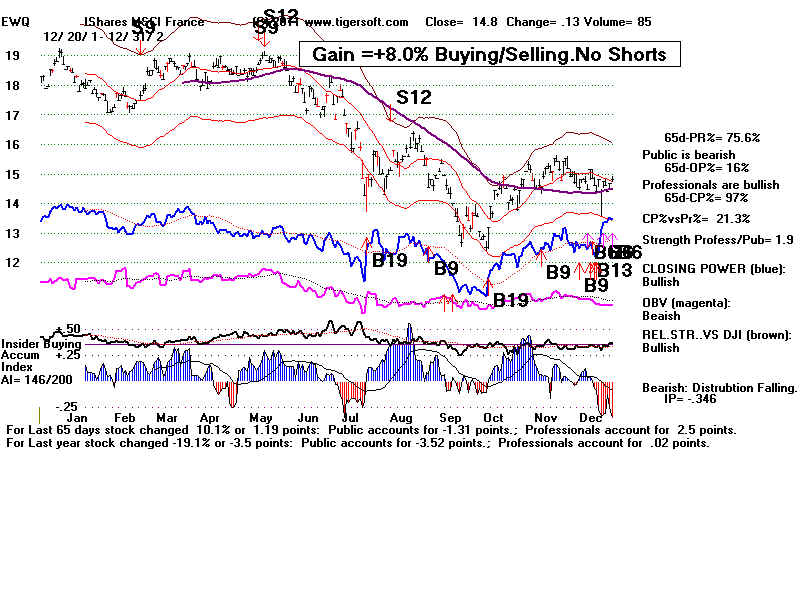 |
2003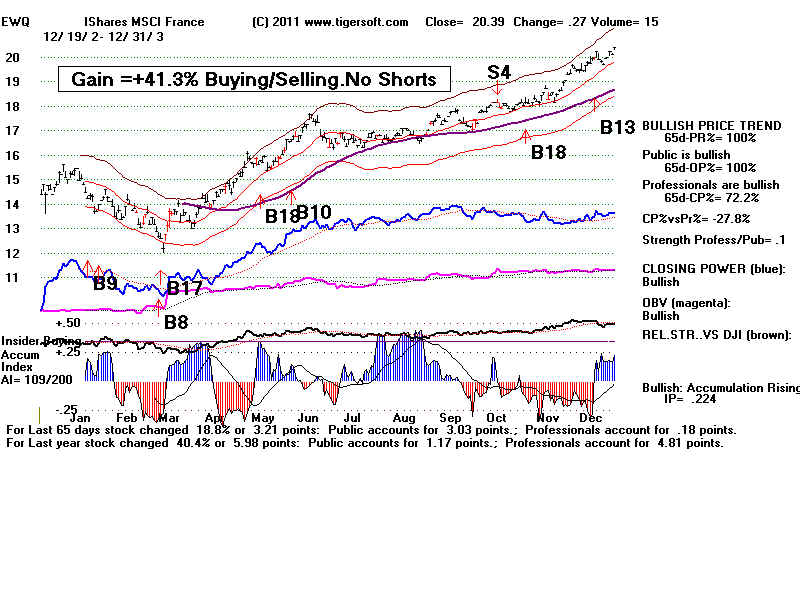 |
2004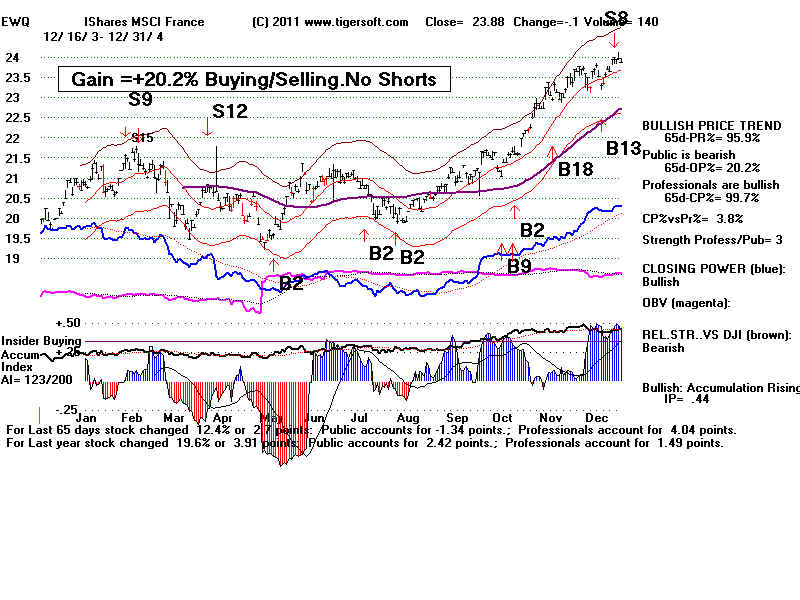 |
2005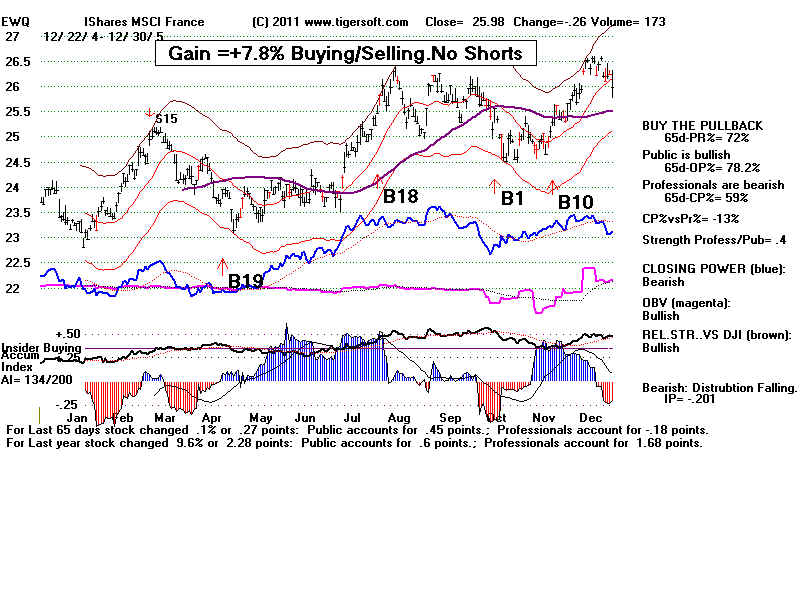 |
2006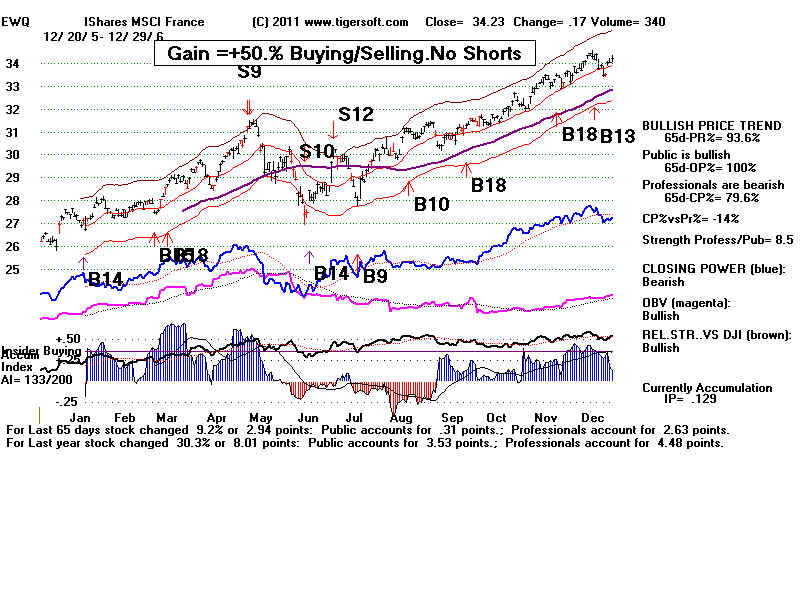 |
2007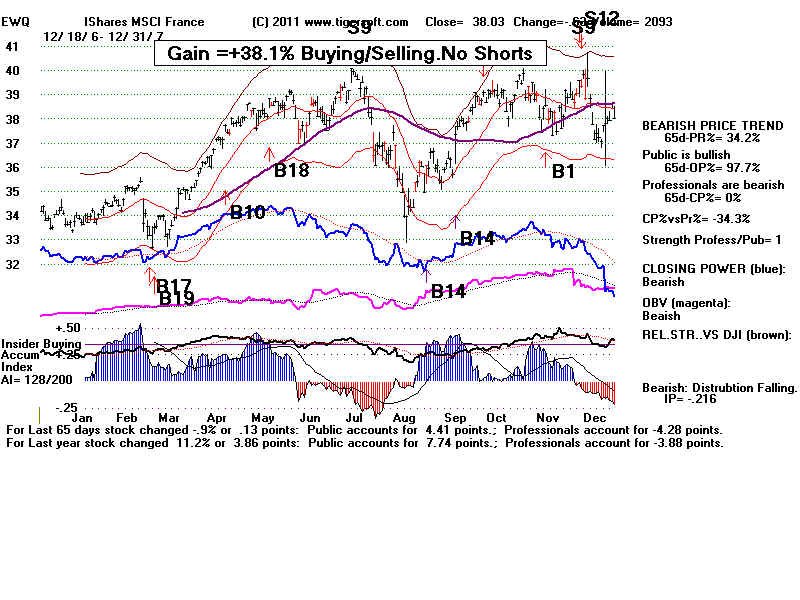 |
2008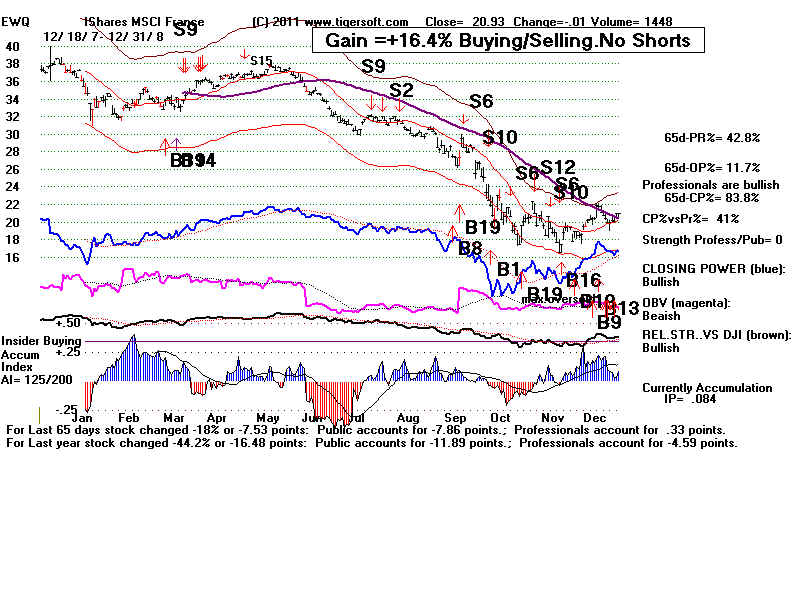 |
2009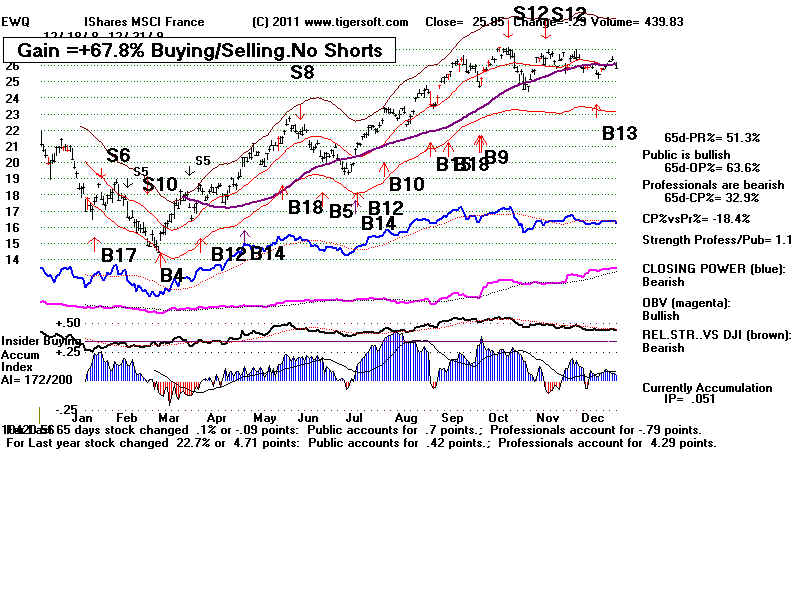 |
2010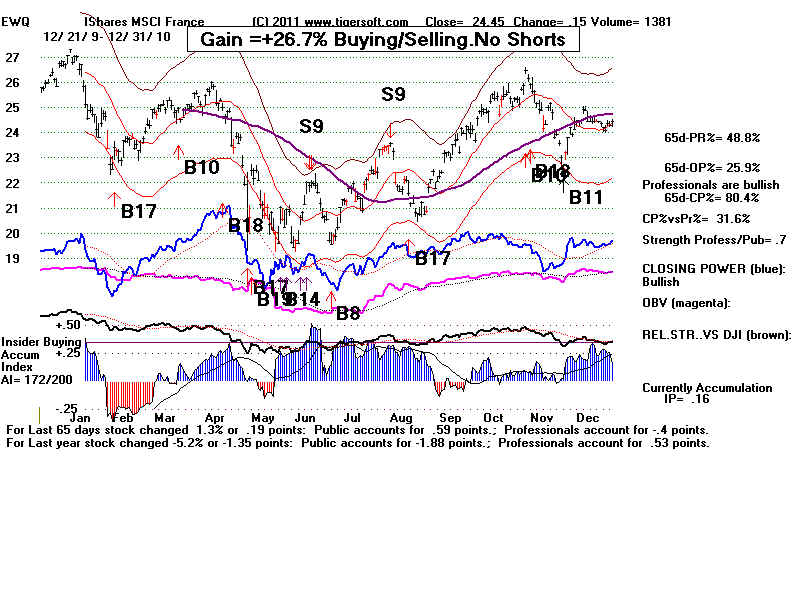 |
2011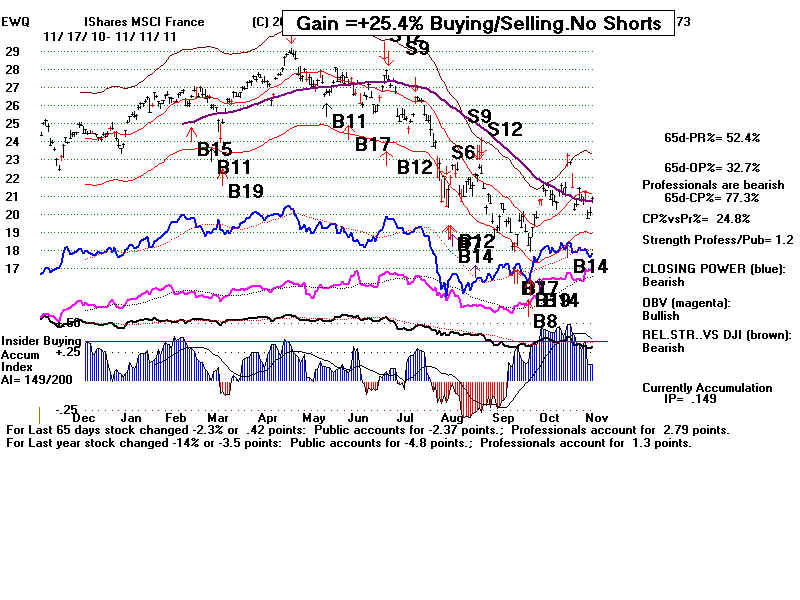 |