History Repeats with A Rhyme
Compare
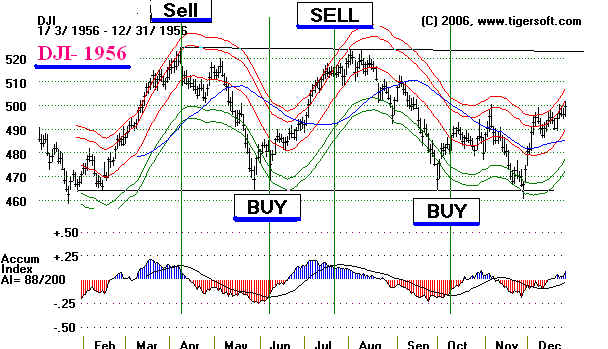
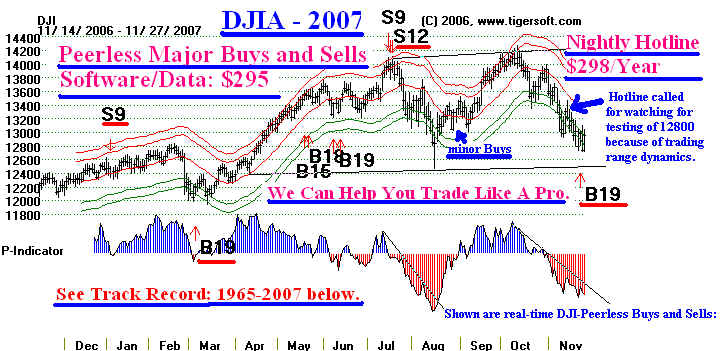
the broad trading ranges shown in the Peerless charts of 1956, 1986 and 2007.
Trading
ranges have their own dynamics Peerless has studied them closely. It can
teach you
a
lot..
Why
not get Peerless Stock Market Timing Software today for $295 and/or our Hotline
for
a year for $298.
Special Offer
Get
both and we'll throw in our TigerSoft individual stock / commodity program for free
until
December 10th, 2007. Call us at 858-273-5900 or email us at
william_schmidt@hotmail.com.
------------------------------------ DJI-30 ---1956
-------------------------------------------
------------------------------------
DJI-30 ---1986 -------------------------------------------
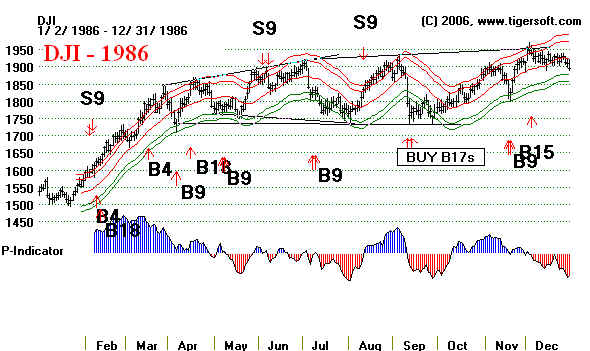
------------------------------------ DJI-30 ---1986
-------------------------------------------
How
Peerless Lets You Profit from
Stock Market Trading Ranges: 1965-2007
In trading ranges you see prices move back and forth between
mostly horizontal,
reasonably parallel
support and resistance lines. Usually the DJI-30 trading ranges are
4% to 7% apart, but
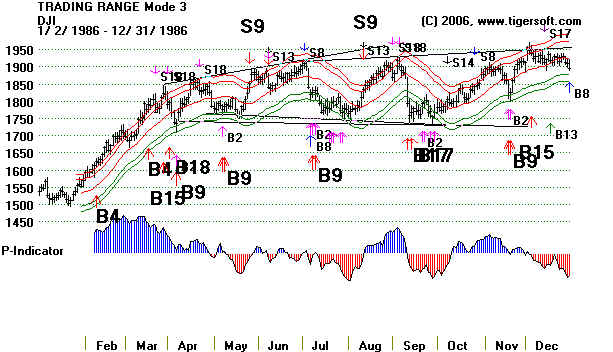
there are cases like in 1986 when the bottoms and tops that line up are
10% from each other.
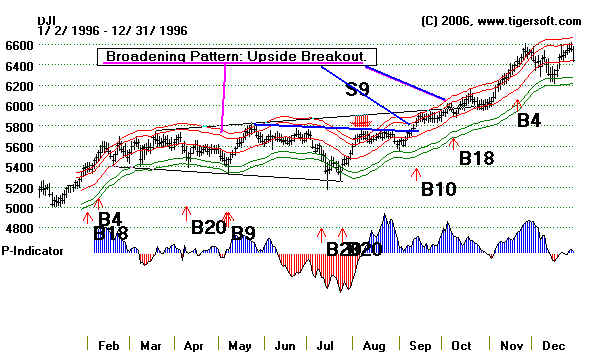
The current DJI chart, so far, looks like
a broadening pattern, not a
trading range.
But if the Fed succeeds in stabalizing the market, I would think trading range
characteristics will
present themselves. This, as you can see below, is often a phenemomenon
seen in Presidential
Election years. (If you like this point, get Peerless. There's are lots original insights
in it. And it has been thoroughly time-tested back to 1915)
Much of the time the DJI-30 is locked in a trading range. Within it, the moves are
often scary.
They are designed to scare the unwary out of their positions at the bottom and
get those who do
not heed charts to buy at the top. Without many bids on the way down
prices scarily
fall from the top of a trading range to the bottom of it. There they probe for
support.
Once it's found and confidence comes back, prices easily rally to the top of the
trading channel
and test the resistance there. These trading ranges can last 6-9 months.
Trading patterns
more often than not continue higher when they follow on an upward course.
In a declining
market, they are as apt to represent a bottom as a top. In both cases, Peerless
Buy and Sell signals, coupled with our charts' internal
strength readings, give us special
insights into
their next price movements.
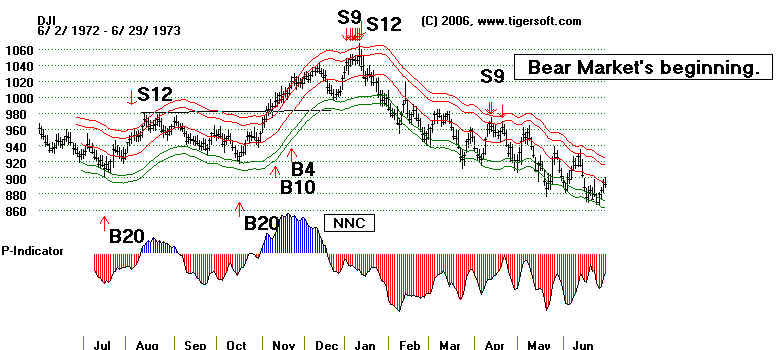
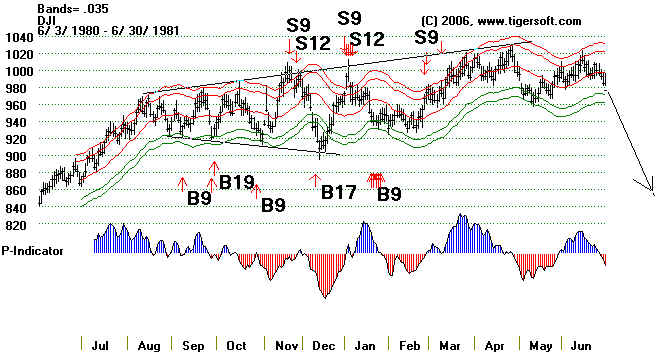
Breakouts from trading ranges are important. Some are authentic and prices move higher,
but some are not.
The failed breakouts show major Peerless Sell signals on the false breakouts.
Look at the chart
for 1972-1973 and 1981 for example.
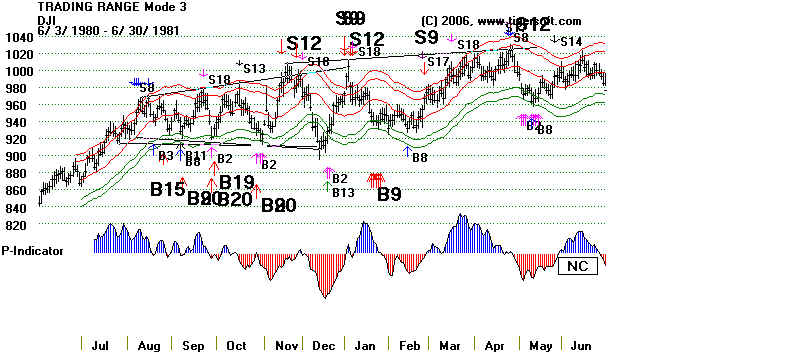
------------------------------------- Nixon Re-Election Breakout failed in January 1973.
--------------------------------
------------------------------------- Failed Breakout Rally in Spring
1981, after Reagan's Election in 1980. -------------------------------------
Here were are interested in trading ranges that last at least 4 or 5 months and last up to
a year.
These will help
the intermediate-term, mutual fund and ETF investor the most. But you should be
aware of longer
term ones, such as the DJI was locked in from 1966 to 1982. Lots of shorter term
trading ranges
can be seen in the charts below. They are of interest to quick traders, but they
can serve to
mislead the longer term investor unless a broader perspective is taken.
16-year DJI-30 Trading Range
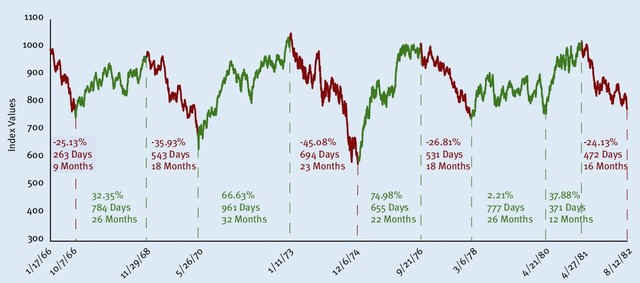
Rydex Funds produced this chart.
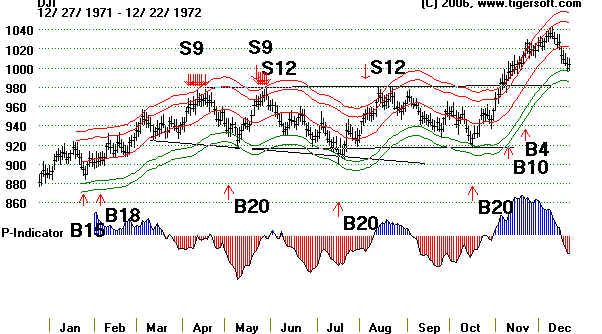
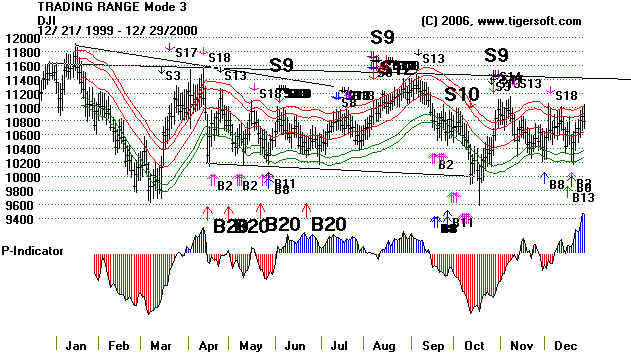
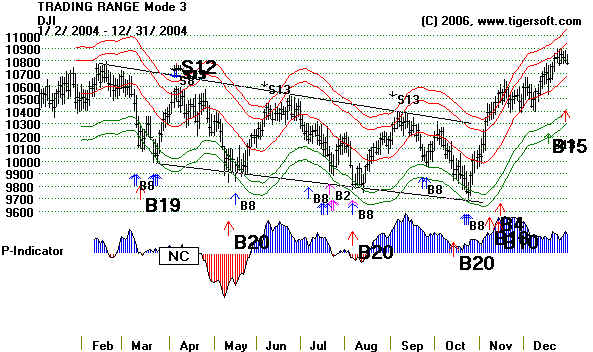
The DJI-30 forms these trading ranges about every two to four years. Look at the
examples: 1972, 1976, 1980-1981, 1984-1985, 1986, 1988,
1989-1990, 1992, 1994, 1996, 2000, 2004 and
now 2007. Our Peerless automatic Peerless signals will
help you understand the way prices
swing back and
forth at these times and prompt you to buy at or near the bottom and sell
at or near the
top. Here are the charts. The automatic Buy and Sell signals on individual
stock charts work
the same way. Look for a study here about them in a few days.
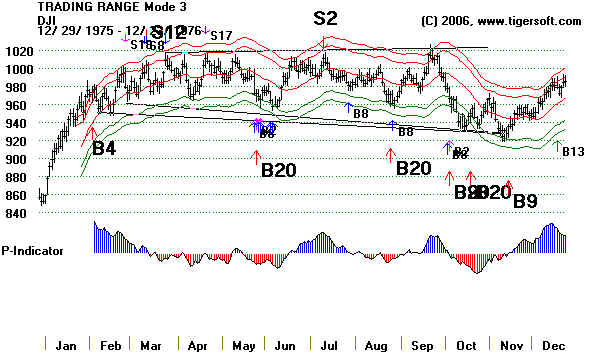
-------------------------------------------- DJI-30 1972
---------------------------------------------------------------------------
-------------------------------------------- DJI-30 1976
---------------------------------------------------------------------------
-------------------------------------------- DJI-30 1980-81
---------------------------------------------------------------------------
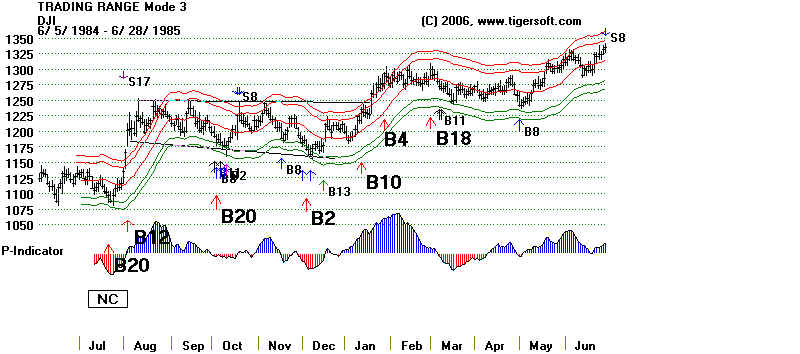
-------------------------------------------- DJI-30 1984
---------------------------------------------------------------------------
--------------------------------------------
DJI-30 1986
---------------------------------------------------------------------------
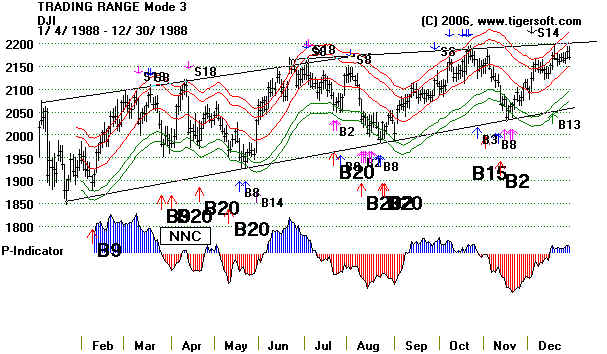
-------------------------------------------- DJI-30 1988
---------------------------------------------------------------------------
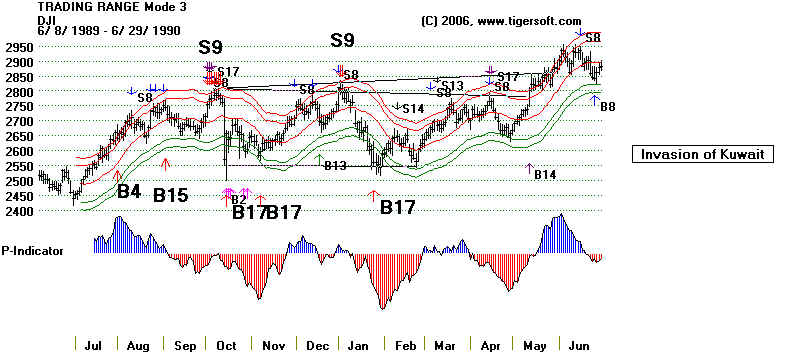
-------------------------------------------- DJI-30 1989-90
---------------------------------------------------------------------------
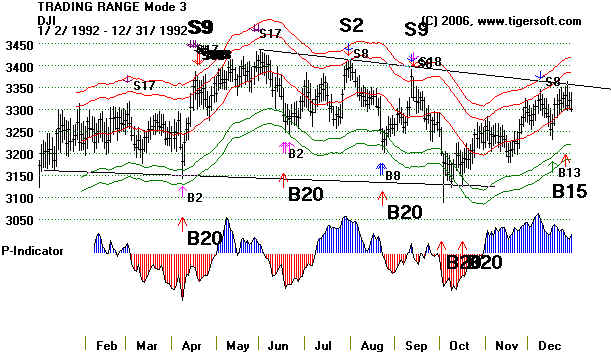
-------------------------------------------- DJI-30 1992
---------------------------------------------------------------------------
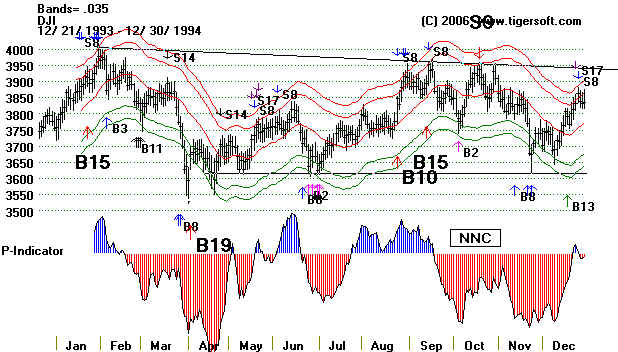
-------------------------------------------- DJI-30 1994
---------------------------------------------------------------------------
--------------------------------------------
DJI-30 1972
---------------------------------------------------------------------------
-------------------------------------------- DJI-30 2000
---------------------------------------------------------------------------
-------------------------------------------- DJI-30 2004
---------------------------------------------------------------------------
-------------------------------------------- DJI-30 2007
---------------------------------------------------------------------------
--
|