Tiger Software Can Make Your Retirement Nest Egg Grow and Grow.
 |
Key Money
Management Techniques: The Importance of Maximizing Returns in Your Retirement Account using Peerless Stock Market Timing, the Tiger "Tahiti System" and the Tiger "Insider-Watch System". Return to Main Tiger Soft Page |
"Buying and Holding" is now a risky
proposition. The DJI
has not had a 10% correction
in 50 months at the
time of this writing. Losses hurt your nest-egg's growth more than you
may realize. It
takes a 25% profit to make up for a 20% loss. It takes a 100% gain
to make up for a 50%
loss. But if you sell out and can then buy back when prices come
down, you will turn
things around nicely.
Declines like the 34% crash in 1987 are avoidable. We told subscribers in early October
1987 to get out of the market immediately. The bearish "Sell S9" had just appeared on
our Peerless Stock Market Timing charts. This was no accident. We had studied the
bear markets and steep drops of 1966, 1967, 1969-1970, 1971, 1973-1974, 1977, 1978, 1979, 1980,
1981-1982, 1983-1984, 1987, 1989-1990, 1990, 1997, 1998, 1999, 2000-2001 and 2002-2003.
The markets just before the sell-offs in these shares shared many common characteristics.
Of the 23 DJI declines of 10% or more between 1965 and 2007, Peerless called
21 of the 23 sell-offs just before they began. One exception was the 1977 bear market,
which Peerless gave a major Sell after the DJI-30 had fallen 10%, but most stocks had not yet
started to fall. In the other case the DJI fell exactly 10% and then reversed strongly after a new
major Peerless Buy signal called the bottom
 .
.Past performance is no guarantee of future success. But wouldn't it be a mistake to
disregard 42 years of market history (1965-2007)? Especially since it is confirmed by the
forty years (1915-1965) prior to that? The fact is that Peerless beat "buying and holding"
the DJI-30 by a factor of 58:1 over the 42 years from June 1965 to June 2007.
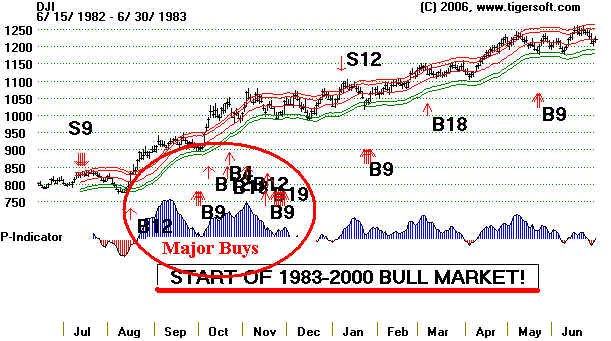
Major Peerless Buy signals announce the start of a bull market and tell you when to buy
again. Here is the Peerless chart for August 1982, the start of the Great Bull Market.
Note the multiple major Buys. It was clear this was the time to Buy. Bull markets always
start with similar characteristics and Peerless major Buys signals. Look at 1966-1967, 1970-1971,
1974-1975, 1978, 1980, 1982-1983 (show below), 1984, 1987-1988 (shown below), 1991,
1995, 1997, 1998, 1999, 2001, 2003 and 2006.
Using Tiger's Peerless Stock Market Timing would have greatly boosted someone's
retirement account. And with Tiger Software, you can easily diversify. We would suggest
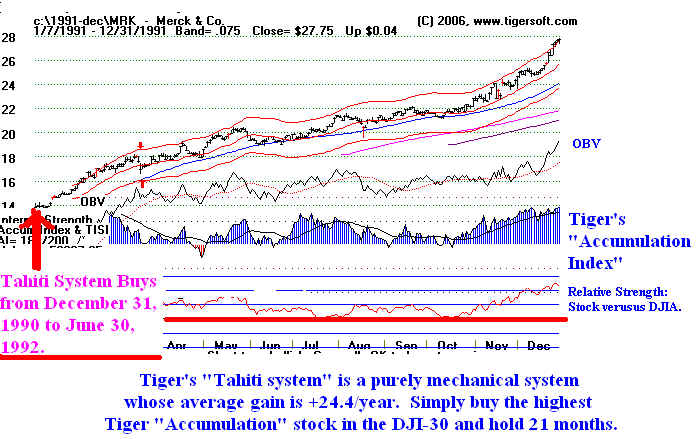
also using the other investment strategies we have back-tested. Tiger's "Tahiti System" of
investing in the highest "Accumulation" stocks in the DJI-30 and holding them 21
months, has averaged gains of almost 24.4% since 1970 in these much safer blue chips.
Some of you will also want to buy the stocks that meet our Insider-Watch criteria. These intensely
accumulated stocks have averaged a yearly gain of +36.5% since 1990. Of course, you may not
want to invest in more specualive stocks. But keep in mind, that the biggest risk comes from buying
such stocks when the over-all market is weak. this ur Peerless Stock Market Timing can help
you avoid.
What an Annualized + 20% Rate of Return will do for $10,000
5 years - $10,000 becomes $24,900
10 year - $10,000 becomes $62,000
10 years - $10,000 becomes $154,070
20 years - $10,000 becomes $383,300
25 years - $10,000 becomes $950,400
30 years - $10,000 becomes $2,370,000
35 years - $10,000 becomes $5,906,680
In the table below, it is assumed that you not only Sell on a major reversing Sell, but
that you also Buy a bearish fund, such as the URSA fund, and that this fund matches the
Dow Jones Average. Depending on which time period you use, "buying and holding"
produced annualized rates of return between +6.7% and +9.7%. Using Peerless the
annualized rates of return ranged from +21.9% to +28.5%.
Peerless Beats "Buying and Holding" over Any Significant Period.
(Calculated 5/29/07 when DJI was at 13521)
DJI Buy and Hold Pct.
Peerless
Pct.
----------------
------------------------------------
-------------------------------------------
--------------------------------- -------
2 1/2 years January 2005 to
June 2007 $10729 ---> $13521 +9.7%
$2177940 ---> $3660491
+23.1%
5 1/2 years January 2002 to
June 2007 $10197 ---> $13521 +5.3%
$ 930989 --->
$3660491 +28.3%
10 1/4 years April 1997
to June 2007 $6834 ---> $13521
+6.9% $
278760 ---> $3660491 +28.5%
20 1/4 years April 1987
to June 2007 $2390 ---> $13521
+8.9% $
23495 ---> $3660491 +28.3%
30 years
May 1977 to June 2007
$903
---> $13521 +9.5%
$ 1965 --->
$3660491 +28.5%
41 3/4 years September 1965
to June 2007 $929 ---> $13521 +6.7%
$ 929 --->
$3660491 +21.9%
These results are based on data shown in http://www.tigersoft.com/majorpeerless.htm
Why Should You Care Whether You Get +6.7%/year or +21.9%/year?
Because Peerless Can Make A Huge Difference to You:
Over 5 years, say, 6.7% will grow $200,000 into $276,600. On the other
hand, getting a return of +21.9%,
as Peerless has since 1965, would turn your $200,000 into $538,329
Over 12 years, 6.7% will grow $100,000 into $217,757. On the other
hand, getting a return of +21.9%,
as Peerless has since 1965, would turn your $100,000 into $1,076,575.
Over 20 years, 6.7% will grow $40,000 into $146,335. On the other hand, getting a return of +21.9%,
as Peerless has since 1965, would turn your $100,000 into $2,099,588.
Over 30 years, 6.7% will grow $5,000 into $34,987. On the other hand, getting a return of +21.9%, using
Peerless, would have turned $5,000 into $1,901,433.
Over 40 years, 6.7% will grow $3,000 into $40,151. On the other hand, getting a return of +21.9%, using
Peerless, would have turned $3,000 into $8,265,506.

What Happens to Your Retirement Account at X% compounded and in Y Years
The table below will let you do all sorts of valuable calculations.
First, estimate by what factor your money must grow, to meet your retirement needs.
For example, if you will need $1,000,000 and you now have $100,00 then you will need to make the
present sum in your retirement account grow by a factor of 10. In this case, if your compounded rate
of return is 7% or less, you will not reach this goal in 40 years.
Assume that you want to reach this goal in 12 years, you can see that you will need to have your
retirement fund grow at a rate of at least 22 % per year. Ths cell is shown in red.
You may also want to allow for inflation. Take the case above. Assume an inflation rate of 1.04.
In 12 years, inflation will reduce your gain by a factor of 1.48. So, to adjust for inflation the $100,000
that in 12 years has become $1,000,000, divide the one million by 1.48. Thus, in 12 years, your
$100,000 has grown to $675,675 in today's dollars, adjusted for a 4% annual rate of inflation.
If this acceptable, you will want to consider Tiger's Tahiti system. It has averaged 24%/year
since 1970.
Multiplier Factor for Varying Rates of Return and Years Held
Find the appropriate Factor and multiply it times your original investment.
Method:
First, find the number of years' column that you are interested in. Use 10 years in this example.
Next, using that column, find the annual rate of return that applies. Then multiply that factor
times the amount of money that you start with.
Example,
Let's assume that you hold an investment 10 years in a fixed income investment, like a Money Market,
and get 5.0% interest, you will find a Factor 1.63 in the appropriate cell in the table below
Assume you start with $1,000. After 5 years you will have $1630 ($1000 X 1.63)..
Now assume, you use Peerless Stock Market Timing, which has averaged +17.5% annualized rate of
return since 1965, doing no short-selling. Further assume, using this Tiger Software tool you actually
achieve for this period an annualized rate of return of +12.0%. The factor you would use in this case is 3.11.
This means you would have $3100 ($1000 X 1.311) using Peerless. This is nearly double what the
money market account would have produced.
Peerless only costs $295. with a charge of $150/year for data. So, it would cost a little less than
$900 to use Peerless for 5 years. Even with only a $1000 invested in the market, you would be
better off using Peerless.
Of course, you may actually have $10,000 or $100,000. With $10,000 in a money market, you would
after 5 years have $16,300. But with Peerless your original $10000 would grow to $31000 less the
$900 cost of using Peerless for five years. So, you would be about $14,000 ahead using Peerless in this case.
If you had $100,000 originally and used Peerless you would be ahead by nearly $140,000. Note that here
we are assuming not the +17.5% rate of return, but only a +12.0% annualized rate of return, to be
conservative.
FACTORS TO MULTIPLY YOUR ORIGINAL INVESTMENT BY
WHEN CONSIDERING RATES OF RETURN AND YEARS HELD.
| Years % Return |
1 year | 2 years | 3 years | 4 years | 5 years |
6 years | 7 years | 8 years | 9 years | 10 years | 12 years | 14 years | 16 years | 18 years | 20 years | 25 years | 30 years | 35 years | 40 years |
| +1% | 1.00 | 1.02 | 1.03 | 1.04 | 1.05 | 1.06 | 1.07 | 1.08 | 1.09 | 1.10 | 1.13 | 1.15 | 1.17 | 1.20 | 1.22 | 1.28 | 1.35 | 1.42 | 1.49 |
| +2% | 1.02 | 1.04 | 1.06 | 1.08 | 1.10 | 1.13 | 1.45 | 1.17 | 1.20 | 1.22 | 1.27 | 1.32 | 1.37 | 1.43 | 1.49 | 1.64 | 1.81 | 2.00 | 2.21 |
| +3% | 1.03 | 1.06 | 1.09 | 1.13 | 1.16 | 1.19 | 1.23 | 1.27 | 1.30 | 1.34 | 1.43 | 1.51 | 1.60 | 1.70 | 1.81 | 2.09 | 2.43 | 2.81 | 3.26 |
| +4% | 1.04 | 1.08 | 1.12 | 1.17 | 1.22 | 1.27 | 1.32 | 1.37 | 1.42 | 1.48 | 1.60 | 1.73 | 1.87 | 2.03 | 2.19 | 2.67 | 3.24 | 3.95 | 4.80 |
| +5% | 1.05 | 1.10 | 1.16 | 1.22 | 1.28 | 1.34 | 1.41 | 1.48 | 1.55 | 1.63 | 1.80 | 1.97 | 2.18 | 2.51 | 2.65 | 3.89 | 4.32 | 5.52 | 7.04 |
| +6% | 1.06 | 1.12 | 1.19 | 1.26 | 1.33 | 1.42 | 1.50 | 1.59 | 1.69 | 1.79 | 2.01 | 2.26 | 2.54 | 2.85 | 3.21 | 4.29 | 5.74 | 7.69 | 10.3 |
| +7% | 1.07 | 1.14 | 1.23 | 1.31 | 1.40 | 1.50 | 1.61 | 1.72 | 1.84 | 1.97 | 2.25 | 2.58 | 2.95 | 3.38 | 3.87 | 5.43 | 7.61 | 10.7 | 15.0 |
| +8% | 1.08 | 1.17 | 1.26 | 1.36 | 1.47 | 1.59 | 1.71 | 1.85 | 2.00 | 2.16 | 2.52 | 2.94 | 3.43 | 4.00 | 4.66 | 6.85 | 10.1 | 14.8 | 21.7 |
| +9% | 1.09 | 1.19 | 1.30 | 1.41 | 1.54 | 1.68 | 1.83 | 1.99 | 2.17 | 2.37 | 2.81 | 3.34 | 3.97 | 4.72 | 5.60 | 8.62 | 13.3 | 20.4 | 31.4 |
| +10% | 1.10 | 1.21 | 1.33 | 1.46 | 1.61 | 1.77 | 1.95 | 2.14 | 2.36 | 2.59 | 3.14 | 3.80 | 4.59 | 5.56 | 6.73 | 10.8 | 17.4 | 28.1 | 45.2 |
| +11% | 1.10 | 1.23 | 1.37 | 1.52 | 1.69 | 1.87 | 2.08 | 2.30 | 2.56 | 2.84 | 3.50 | 4.31 | 5.31 | 6.54 | 8.06 | 13.6 | 22.9 | 38.6 | 65.0 |
| +12% | 1.12 | 1.25 | 1.40 | 1.57 | 1.76 | 1.97 | 2.21 | 2.48 | 2.77 | 3.11 | 3.90 | 4.89 | 6.13 | 6.69 | 9.65 | 17 | 30.0 | 52.8 | 93.1 |
| +13% | 1.13 | 1.28 | 1.44 | 1.63 | 1.84 | 2.08 | 2.35 | 2.66 | 3.00 | 3.39 | 4.33 | 5.53 | 7.07 | 9.02 | 11.5 | 21.2 | 39.1 | 72.1 | 133 |
| +14% | 1.14 | 1.30 | 1.48 | 1.69 | 1.93 | 2.19 | 2.50 | 2.85 | 3.25 | 3.71 | 4.82 | 6.26 | 8.13 | 10.6 | 13.7 | 26.5 | 51.0 | 98.1 | 189 |
| +15% | 1.15 | 1.32 | 1.52 | 1.75 | 2.01 | 2.31 | 2.66 | 3.06 | 3.52 | 4.05 | 5.35 | 7.08 | 9.36 | 12.4 | 16.4 | 32.9 | 66.2 | 133 | 268 |
| +16% | 1.16 | 1.35 | 1.56 | 1.81 | 2.10 | 2.44 | 2.82 | 3.28 | 3.80 | 4.41 | 5.94 | 8.00 | 10.7 | 14.5 | 19.5 | 40.9 | 85.8 | 180 | 378 |
| +17% | 1.17 | 1.37 | 1.60 | 1.87 | 2.19 | 2.57 | 3.00 | 3.51 | 4.11 | 4.81 | 6.58 | 9.00 | 12.3 | 16.9 | 23.1 | 50.7 | 111 | 244 | 533 |
| +18% | 1.18 | 1.39 | 1.64 | 1.94 | 2.29 | 2.70 | 3.19 | 3.76 | 4.44 | 5.23 | 7.29 | 10.1 | 14.1 | 19.7 | 27.4 | 62.7 | 143 | 327 | 750 |
| Year % Return |
1 year | 2 years | 3 years | 4 years | 5 years | 6 years | 7 years | 8 years | 9 years | 10 years | 12 years | 14 years | 16 years | 18 years | 20 years | 25 years | 30 years | 35 years | 40 years |
| +20% | 1.2 | 1.44 | 1.73 | 2.07 | 2.49 | 2.99 | 3.58 | 4.30 | 5.16 | 6.19 | 8.19 | 12.8 | 18.5 | 26.6 | 38.3 | 95.4 | 237 | 591 | 1470 |
| +21% | 1.21 | 1.45 | 1.77 | 2.14 | 2.59 | 3.14 | 3.80 | 4.50 | 5.56 | 6.73 | 9.84 | 14.4 | 21.1 | 30.9 | 45.3 | 117 | 304 | 790 | 2048 |
| +22% | 1.22 | 1.49 | 1.82 | 2.22 | 2.70 | 3.30 | 4.02 | 4.91 | 5.99 | 7.30 | 10.87 | 16.2 | 24.1 | 35.8 | 53.3 | 144 | 390 | 1053 | 2847 |
| +23% | 1.23 | 1.51 | 1.86 | 2.29 | 2.82 | 3.46 | 4.26 | 5.23 | 6.44 | 7.9 | 12.0 | 18.1 | 27.4 | 41.5 | 62.8 | 177 | 498 | 1401 | 3946 |
| +24% | 1.24 | 1.54 | 1.91 | 2.36 | 2.93 | 3.64 | 4.51 | 5.56 | 6.93 | 8.59 | 13.2 | 20.3 | 31.2 | 48.0 | 73.9 | 217 | 634 | 1861 | 5456 |
| +25% | 1.25 | 1.56 | 1.95 | 2.44 | 3.05 | 3.81 | 4.77 | 5.96 | 7.45 | 9.31 | 14.6 | 22.7 | 35.5 | 55.5 | 86.7 | 265 | 808 | 2465 | 7523 |
| +26% | 1.26 | 1.59 | 2.00 | 2.52 | 3.18 | 4.00 | 5.04 | 6.35 | 8.00 | 10.1 | 16.0 | 25.4 | 40.4 | 64.1 | 102 | 323 | 1025 | 3258 | 10347 |
| +27% | 1.27 | 1.61 | 2.04 | 2.6 | 3.30 | 4.20 | 5.33 | 6.77 | 8.6 | 10.9 | 17.6 | 28.4 | 45.6 | 73.9 | 119 | 394 | 1301 | 4297 | 14195 |
| +28% | 1.28 | 1.64 | 2.10 | 2.69 | 3.44 | 4.40 | 5.62 | 7.21 | 9.22 | 11.8 | 19.3 | 31.7 | 51.9 | 85.1 | 139 | 479 | 1646 | 5654 | 19426 |
| +29% | 1.39 | 1.66 | 2.14 | 2.78 | 3.57 | 4.61 | 5.94 | 7.67 | 9.89 | 12.8 | 21.2 | 35.3 | 58.8 | 97.9 | 163 | 582 | 2078 | 7424 | 26521 |
| +30% | 1.30 | 1.69 | 2.20 | 2.86 | 3.71 | 4.83 | 6.27 | 8.15 | 10.6 | 13.9 | 23.3 | 39.4 | 66.5 | 112.5 | 190 | 706 | 2620 | 9728 | 36118 |
| +31% | 1.31 | 1.72 | 2.25 | 2.94 | 3.86 | 5.05 | 6.62 | 8.67 | 11.4 | 14.9 | 25.5 | 43.8 | 75.2 | 129.1 | 221 | 855 | 3297 | 12720 | 49074 |
| +32% | 1.31 | 1.74 | 2.30 | 3.04 | 4.01 | 5.29 | 6.98 | 9.22 | 12.2 | 16.1 | 28.0 | 48.8 | 85.0 | 148.0 | 258 | 1034 | 4142 | 16599 | 66520 |
| +34% | 1.34 | 1.80 | 2.41 | 3.22 | 4.32 | 5.79 | 7.76 | 10.4 | 13.9 | 18.7 | 33.2 | 60.1 | 108 | 194.0 | 348 | 1505 | 6503 | 28098 | 121392 |
| +36% | 1.36 | 1.85 | 2.52 | 3.42 | 4.66 | 6.33 | 8.61 | 11.7 | 15.9 | 21.6 | 40.0 | 74.1 | 137 | 253 | 469 | 2180 | 10143 | 47191 | 219561 |
| +38% | 1.38 | 1.90 | 2.63 | 3.63 | 5.0 | 6.91 | 9.53 | 13.2 | 18.2 | 25.0 | 47.7 | 90.8 | 173 | 329 | 627 | 3140 | 15717 | 78662 | 393698 |
| +40% | 1.40 | 1.96 | 2.74 | 3.84 | 5.38 | 7.53 | 10.5 | 14.8 | 20.7 | 28.9 | 56.7 | 111 | 218 | 427 | 8376 | 4500 | 24201 | 130161 | 700037 |
| Year % Return |
1 year | 2 years | 3 years | 4 years | 5 years | 6 years | 7 years | 8 years | 9 years | 10 years | 12 years | 14 years | 16 years | 18 years | 20 years | 25 years | 30 years | 35 years | 40 years |