-------------------------------------------------------------------------------------------
Use the NASDAQ-100 Tahiti System:
It Has Gained +43.8%/Year, 2003-2005 and
has been back-tested with DJI-30 from 1970 to 2000.
Tiger's "TAHITI SYSTEM"
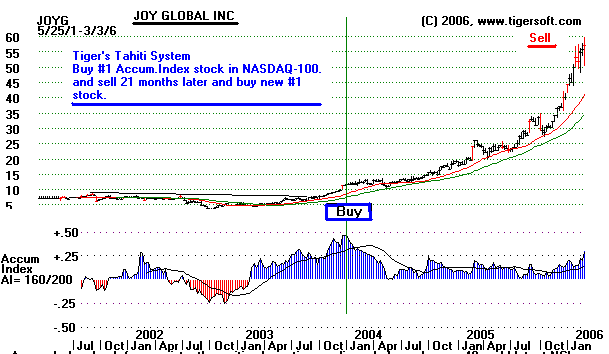
This is by far, the simplest of the 7 strategies we offer for making 25% per year. You could easily run your portfolio from Tahiti. At the end of every Quarter, you buy the highest Accumulated stock in DJI-30, or now the NASDAQ-100, and hold it for 21 months. That is the optimum hold period. Seven postitions are taken, in staggered fashion over 21 months. After a stock has been held for 21 months, it is sold and replaced by the new #1 - most Accumulated stock in the NASDAQ-100.
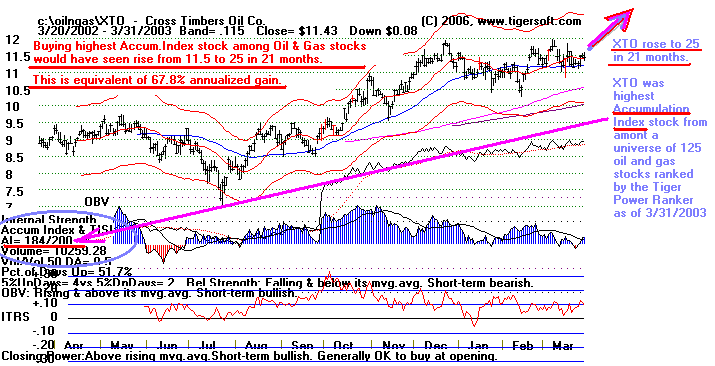
Here we study the results buying the most Accumulated NASDAQ-100 stock. But, our larger finding is that an investor could also have gotten superb results buying each quarter the Most Accumulated oil/gas stock, or the most accumulated gold/silver stock, or the most accumlated biotech stock, etc. Thus, for example, the top oil and gas stock on March 31, 2003 was XTO. It subsequently rose more than 100% in 21 months. It is the circled Accumulation Index value that we use. Buying the Top Accumulation oil and gas stock quarter
by quarter after 2002 would have gained the investor more than 40% per year. (Look for more studies here
that demonstrate the much wider applicability and profitablity of our Tahiti system's principle.)

Accumulation is a measure of patient big money buying (accumulating) that was invented and originated by William Schmidt, Ph.D. in 1981. It is the centerpiece in Tiger's analysis of a stock's safety and potential. Over the years, it has been copied and used widely in the securities' industry by many well-known individuals and companies. That it is so widely appreciated should suggest its awesome power. As our creation, no one else has studied it so closely. We have had 25 years' experience with it. It is the centerpiece of Tiger's system of technical anaysis and the 7 Paths discussed here.
Applied to the DJI-30 between 1970 and 2000, the average annual gain was about 25%. This is documented in The Tiger Tahiti System: Using Tiger's Power-Stock-Ranker To Invest in Only Safer DJI-30 Blue Chips. (2000, $55) The book suggests avoiding buying in a bear market, as defined by our system as 3 or 4 major Sells (S9s and S12s) and a key support failure. In 2000 we had many more major Sell signals. Only in early 2003 did it appear that the general market had bottomed.
Conclusion based on Results Shown below:
So how has the Tahiti system done since? Consider the results from March 31, 2003 to June 30, 2005. (The selections since mid-2005 are mentioned, but not included because not enough time has elapsed to let them mature. Their preliminary results are in keeping with those seen earlier.)
Why do we start on March 31st, 2003? By then, the bear market of 2001-2002 had clearly ended. Our Peerless system has given multiple major Buys. A triple bottom had been formed. And the SP-500 coming off its last bottom with noteworthy volume and new accumulation.
The Results from 2003-2005:
Applying the Tahiti rules to the DJI-30 stocks in this period would have brought the investor a modest +10.9% annualized gain. This is down considerably from the 25% per year that the system had brought between 1970 and 2000.
However, the concept of buying the #1 most Accumulated stock in a large universe of stocks had been proven conclusively in the earlier study. So, we next applied this system to the stocks now in the NASDAQ-100. The results are impressive. Buying the highest Accumulation stock in the NASDAQ-100 at the end of every quarter and holding it automatically for 21 months, would have brought an average annualized gain of 43.8%.
The Tiger software necessary to produce Automatic reports showing the highest Accumulation stocks is $590. This also gives automatic Buy and Sell signals on stocks, flags many more bullish and bearish conditions and lets you get the major signals of the general market. And it includes a 3 months' subscription to the Tiger data services, which will let you examine more than 1000 different stocks. Ample instructions are offered On-Line, in the software and at regular Tiger Software seminars held in San Diego and Las Vegas. We also make the same report each night On-Line. A subscription to it is $575 for a year. You can get all the Tiger and Peerless software, all updates for a year, all our books and a year's subscription to the Hotline Services for $995.

Actual Tahiti Trades: 2003-2005:
Highest Accumulation Stocks in DJI-30 and NASDAQ-100
Holding Trades and Outcomes
Period (First the DJI-30 stock and then the NASDAQ-100)
-------- --------------------------------------------------------------
21 mo. Buy on March 31, 2003 ... Sell on December 31, 2004
PG (Proctor&Gamble) 44.53 (175) sold at 55.08 +23.7%
46-47 was immediate barrier. Annualized Gain=+13.5%
EBAY (Top Accum, Stock in NASDAQ-100) 21.33
Strong. Back to rising 21-day ma sold at 58.17 +172.7%
Annualized Gain=+98.7%
..................................................................................................................................
21
mo.
Buy on June 30, 2003 ... Sell on March 31, 2005
PG (Proctor&Gamble) 44.59 sold at 53.00
+18.9%
46-47 was still barrier.
Annualized Gain=+10.8%
EBAY (Top Accum, Stock in NASDAQ-100 24.59
Strong trying to breakout over 26. sold at 37.26 +43.3%
Annualized Gain=+24.7%
...................................................................................................................................
21.
mo
Buy on September 30, 2003 ... Sell on June 30, 2005
CAT (Caterpillar - 167) 34.42 sold at 47.66
+38.5%
Annualized Gain=+24.7%
APOL (181) 66.03 sold at 78.22
+18.5%
Annualized Gain=+10.6%
..................................................................................................................................
21
mo.
Buy on December 31, 2003 ... Sell on September 31, 2005
BA (Boeing - 174) 42.14 sold at 67.95
+61.2%
Annualized Gain=+35.0%
JOYG (191 - uptrending )11.62 sold at 33.64
+189.5%
Annualized Gain=+108.3%
NTLI (191 - uptrending) 69.75 sold at 66.80 -4.2%
Annualized Gain= -2.4%
SIAL (191 - uptrending) 57.18 sold at 64.06
+12.0%
Annualized Gain=+6.9%
Avg for 3 that were tied for #1 = Annualized
Gain=+37.0%
..................................................................................................................................
21
mo.
Buy on March 31, 2004 ... Sell on December 31, 2005
KO (Coca-Cola -149)<1> 50.30 sold at 40.31
-19.9%
Annualized Gain= -11.4%
JOYG (183) 12.47 sold at 40.00
+220.8%
..........
Annualized Gain=+126.2%
also
APOL (176) 86.16 sold at 60.46
-29.8%
ADSK (173) 15.76 sold at 42.93
+172.4%
............. Trades below have not been closed out because holding
period is 21 months.
===========================================================
Results below are based on prices as of 2/28/2006
20 mo.
Buy on June 30, 2004 ... To Be Sold on March 31, 2006
KO (Coca Cola - 166) 50.48
2/28/2006 41.97 -16.9%
Annualized Gain= -10.1%
ADSK 21.41
2/28/2006 37.65 +
75.9%
Annualized Gain=+45.5%
..................................................................................................................................
17
mo.
Buy on September 30, 2004 ... To Be Sold on June 30, 2006
GE (General Electric) 33.50
2/28/2006 32.87 -1.9%
Annualized Gain= -1.3%
APOL 73.37
2/28/2006 49.38 -32.7%
Annualized Gain= -23.1%
..................................................................................................................................
14 mo.
Buy on December 31, 2004 ... To Be Sold on September
30, 2006
GE (171-General Electric) 36.50 2/28/2006
32.87 -9.9%
Annualized Gain= -8.5%
EBAY (186) 58.17
2/28/2006 40.06 -30.1%
.
Annualized Gain= -25.8%
..................................................................................................................................
11
mo.
Buy on March 31, 2005 ... To Be Sold on December 31, 2006
XOM (167 - Exxon) 59.60
2/28/2006 59.37 -3.9%
Annualized Gain= -4.3%
CTSH (170 - Cognizant Techn.) 46.20 2/28/2006
57.61 +24.7%
Annualized Gain=+26.9%
also
EPP (171-IShares Pacific ex Japan) 90.09 2/28/06
103.70 +15.1%
WFMI
(165 - Whole Foods) 51.07 2/28/2006
63.88 +25.1%
URBN (165 - Urban Outfitters) 23.99 2/28/2006
28.10 +17.1%
..................................................................................................................................
8 mo.
Buy on June 30, 2005 ... To Be Sold on March 31, 2007
HPQ (135) 23.51
2/28/2006
28.10 +19.5%
Annualized Gain=+29.3%
UHAL (183) 53.55
2/28/2006 88.84 +65.9%
Annualized Gain=+98.9%
also
EPP (176 - IShares Pacific ex Japan) 94.14 2/28/2006
103.70
+10.1%
Conclusion:
Avg Annualized Rate of Return for Highest Accum DJI-30
Stocks is +10.9%
Avg Annualized Rate of Return for Highest Accum NASDAQ-100
Stocks is +43.8%
..................................................................................................................................
These are skipped in computations because not enough time has
been given them to mature.
5 mo.
Buy on September 30, 2005 ... To Be Sold on
June 30, 2007
HPQ (164) 29.20
2/28/2006 28.10 -3.8%
URBN (186 - Urban Outfitters) 29.40 2/28/2006
28.10 -4.4%
also
CDNS (185) 16.16
2/28/2006 17.75 +9.8%
2 mo.
Buy on December 30, 2005 ... To Be Sold on
September 30, 2007
HPQ (177) 28.63
2/28/2006 28.10 -1.9%
CDNS (184) 16.92
2/28/2006 17.75 +4.9%
also
ESRX (180) 83.8
2/28/2006
87.27 +4.1%