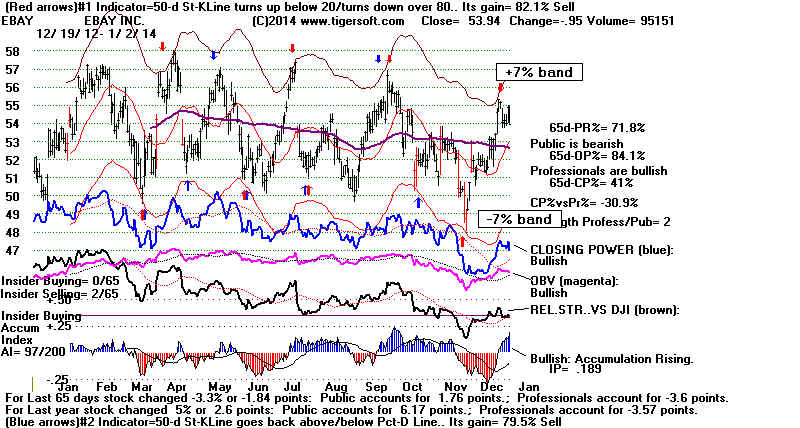
TigerSoft invented Bands around a Moving Average back in 1981. They are
now used widely. Our bands are fixed interval bands. The upper and lower bands
are the same width away from the moving average. Optimized, they bracket 93%
of the close for a year. Some stocks bounce up and down between their bands
for a year or more, EBAY did below. But that is unusual.
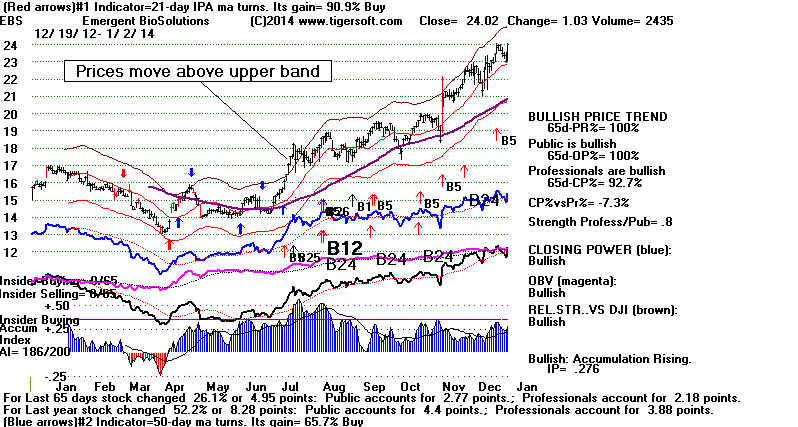
When prices move past the bands, the stock is either accelerating up or
accelerating down. Usually this is a break-away move if the TigerSoft Accumulation
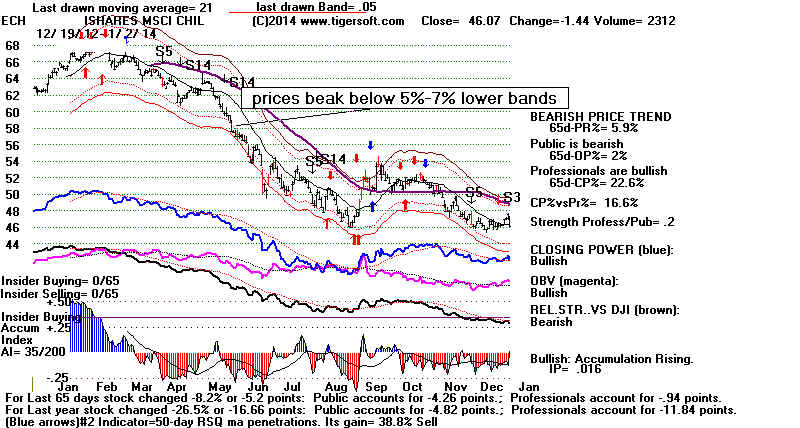
Index confirms it. When they break below their lower band, prices are usually
accelerating down.
UPPER BAND VIOLATION
LOWER BAND VIOLATION
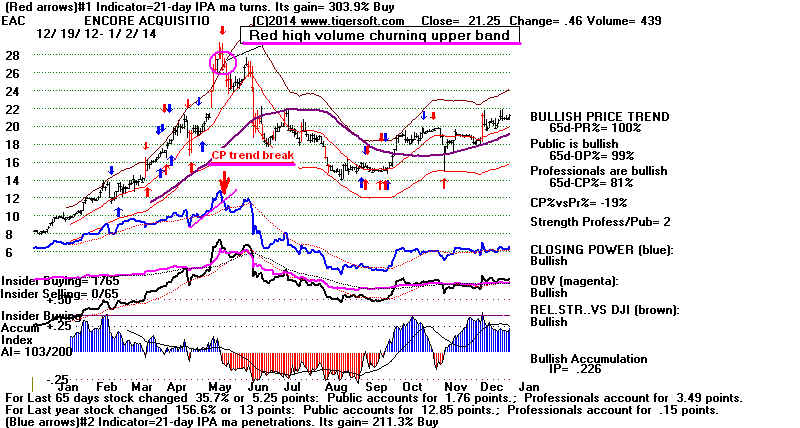
When prices churn on red high volume at the upper band, they tend to turn down
and vice verse. In these cases, we usually wait for the blue Closing Power Line
beneath the price chart to break its uptrendline to sell or, if internals are very poor,
to sell short.
When prices reach the upper band and our internal strength indicators are declining
or negative a reversal downward is likely and vice verse. Most of the Tiger and
Peerless automatic signals are derived from where the index, stock, ETF or commodity
is in relation to its price bands and how strong the P-I is for the DJI and how strong
the Accumulation Index is for stocks and ETFS. The internal strength indicators.
Closing Power, OBV, Relative Strength Quotient and Accumulation Index are at the
bottom of the Tigersoft and Peerless charts. We constantly compare their strength
witht the price action. Thus we simultaneously employ both momentum and divergence
analysis in generating automatic signals. Besides Accumulation Index warnings, we alse
watch for Closing Power and Relative Strength divergences as the upper band is reached.
More on all these below.
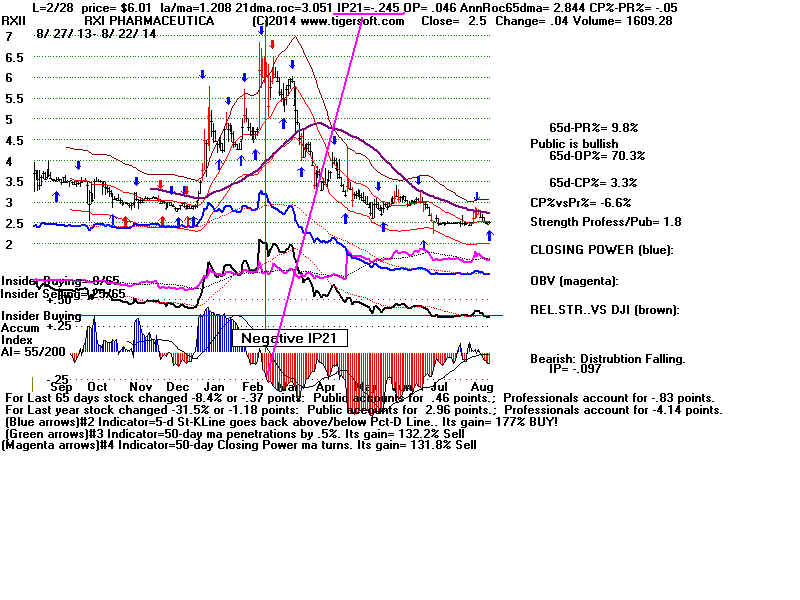
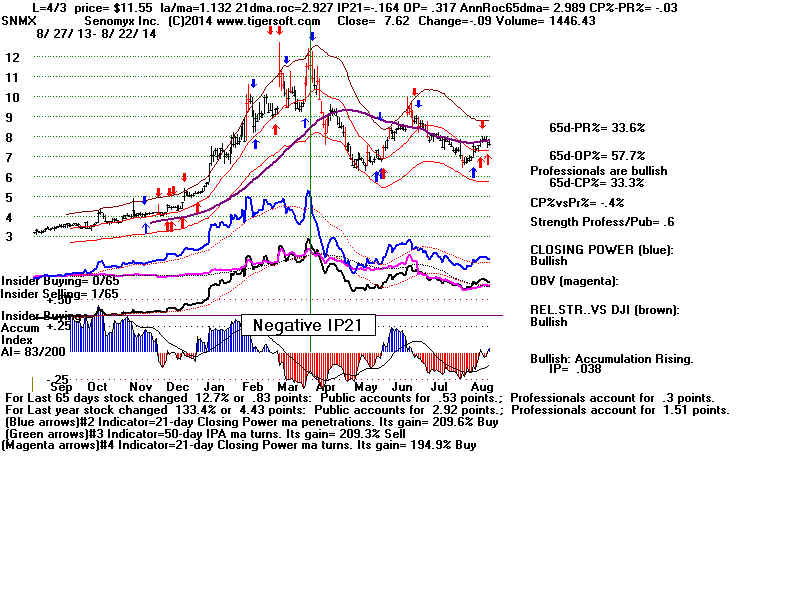
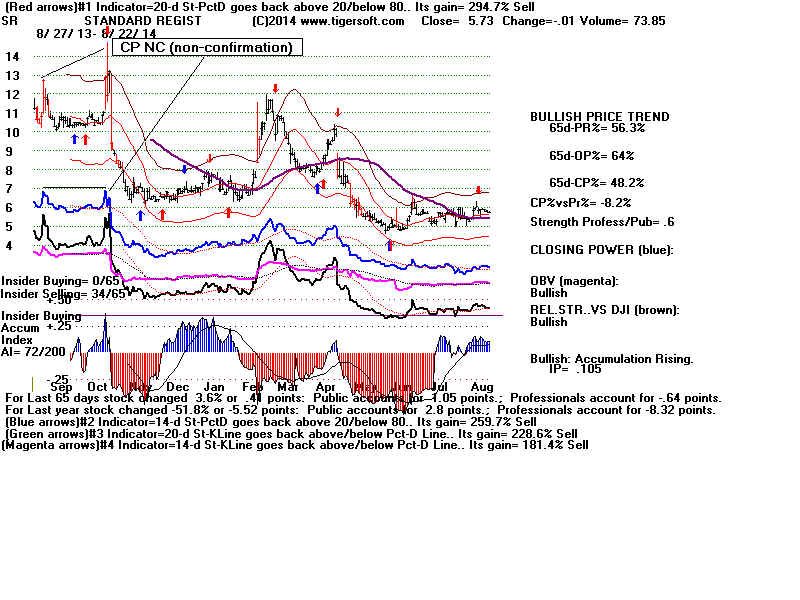
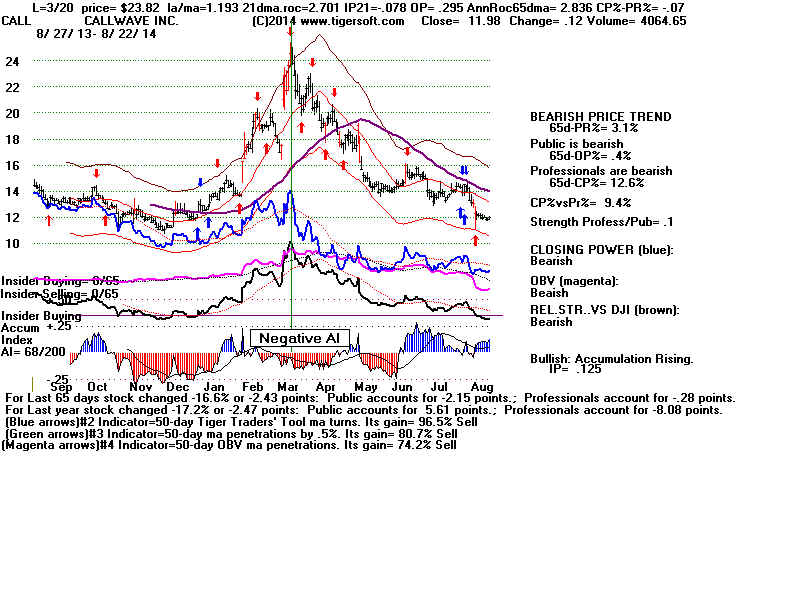
Here are some cases of big declines in 2014 where the Accumulation Index was
negative at the upper band as the stocks made major tops. By itself, this is not
sufficient reason to sell short. We would also want the Blue Closing Power to break
its uptrend and, it would be great, too, if Peerless gave a Sell Signal on the overall
market.
for the Accumulation Index
