AAPL from 2008-2010
(C) 2010 www.tigersoft.com
Use Peerless.
Choose: PEERCOMM + Peerless-2008/9 + Peerless-Daily DJI + Data +
Operations + DJI Chart and PI - ADL(A/D Line) and Accum. Index
OK (Use 21) + OK (Use 21) + Super-Impose DJIA Saved Signals

What To Look for?
1) What is latest Buy or Sell? B12
2) What is track record of this signal? Go to Peerless Links provided for track record since 1929 and comments. See Hotline's comments and studies, too.
Very bullish. But a few big draw-downs if there
is no completion of basing at bottom.
3) What is direction of heavy direcion of 65-day ma. FALLING. This shows you momentum. Rising is Bullish. Falling is Bearish.
4) Is DJI above or below the 65-DMA Above - Bullish Below - Bearish
At the 65-dma - Neutral -Watch. -
5) Is NYSE A/D Line in uptrend (Bullish) or downtrend (bearish)
6) Is P-Indicator positive (Bullish) or negative (Bearish)
7) Is Accumulation Index positive (Bullish) or negative (Bearish)
Use TigerSoft with ETF that matches most closely your stock:
DIA or SPY for bigger capitalization stocks
QQQQ for high techs
PEERCOMM + Select + Stocks OK + Peerless-2008/9 + Daily Stocks + QQQQ
+ Signals-1 + -->Signals Compatible with 65-DMA

What To Look for?
1) What is direction of heavy direcion of 65-day ma. FALLING. This shows you momentum. Rising is Bullish. Falling is Bearish.
2) What is direction of (blue) Closing Power. Very important.
RISING and above its 21-day ma This shows you momentum of professionals' Buying
or Selling. Rising is Bullish. Falling is Bearish. See comments to the right.
3) What is direction of (magenta) OBV. This shows aggressive buying or selling.
See comments to the right. Mixed-Neutral
4) What is direction of (magenta) OBV. This shows aggressive buying or selling.
See comments to the right. Mixed-Neutral
5) What is direction and sign (positive or negative) of Accumulation Index at the bottom. This shows patient buying or selling, most often done by insiders. RISING and above its 21-day ma See comments to the right.
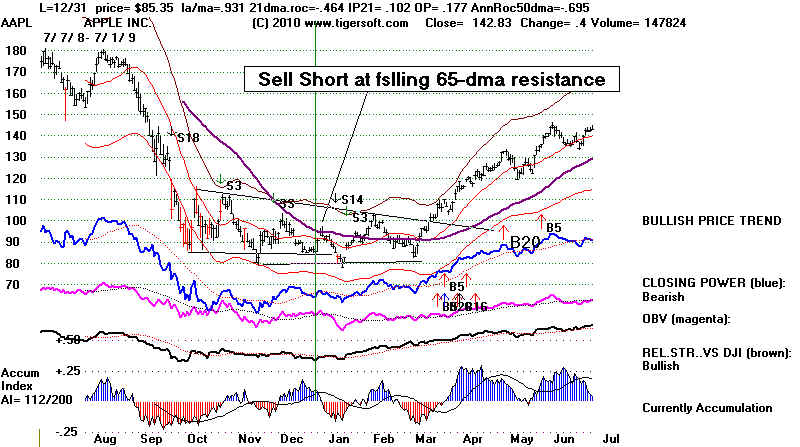
Is It in A Tradimg Range awaiting A Breakout or Breakdown?
PEERCOMM + Select + Stocks OK + Peerless-2008/9 + Daily Stocks + QQQQ
+ Signals-1 + -->Signals Compatible with 65-DMA

What To Look for?
1) What is direction of heavy direcion of 65-day ma. FALLING. This shows you momentum. Rising is Bullish. Falling is Bearish.
2) What is direction of (blue) Closing Power. Very important.
Neutral without trend This shows you momentum of professionals' Buying
or Selling. Rising is Bullish. Falling is Bearish. See comments to the right.
3) What is direction of (magenta) OBV. This shows aggressive buying or selling.
See comments to the right. Mixed-Neutral-without trend
4) What is direction of (brown) Relative Strength. This shows aggressive buying or selling.
See comments to the right. Mixed-Neutral
5) What is direction and sign (positive or negative) of Accumulation Index at the bottom. This shows patient buying or selling, most often done by insiders. RISING and above its 21-day ma See comments to the right.
Outcome? - Stock needed more basing.
But in March, also when Peerless gave a major BUY, all indicators
turned bullish.
What would you do in July 2009?
Note the bullish conclusions to the right of the chart.

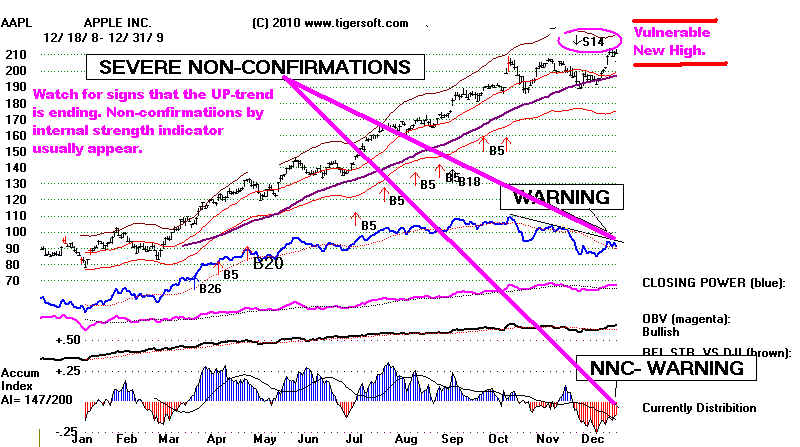
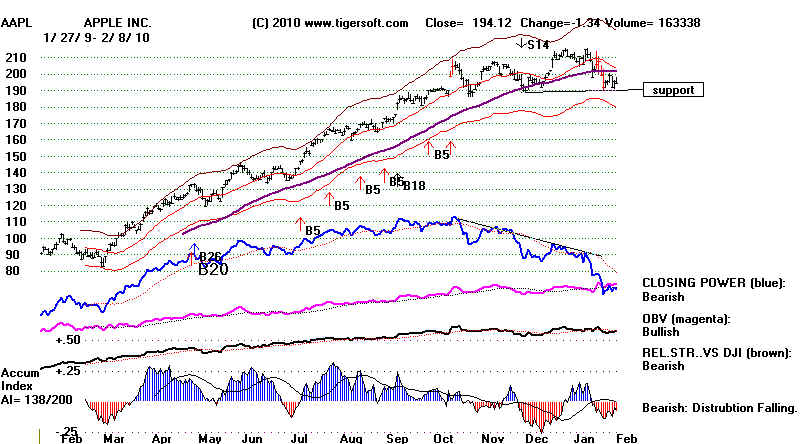
There were signs of an impending reversal of trend:
- The Closing Power was in a downtrend and did not confirm the new high at the end of 2009.
- The Accumulation Index was negative on the new high. This is a sign of insider selling.

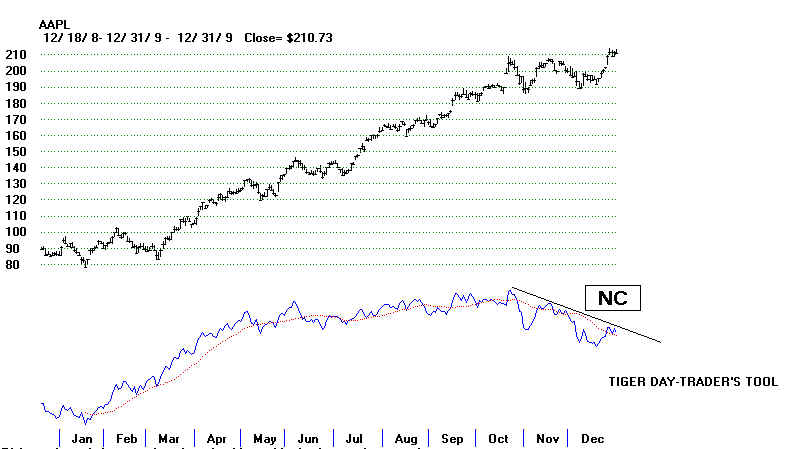
The new high is not confirmed by the day traders' tool. The stock has become
profitable for traders to sell short at the opening. That will weaken the stock.


