Either use our weekly charts or the longer term charts provided by yahoo.com or bigcharts.com
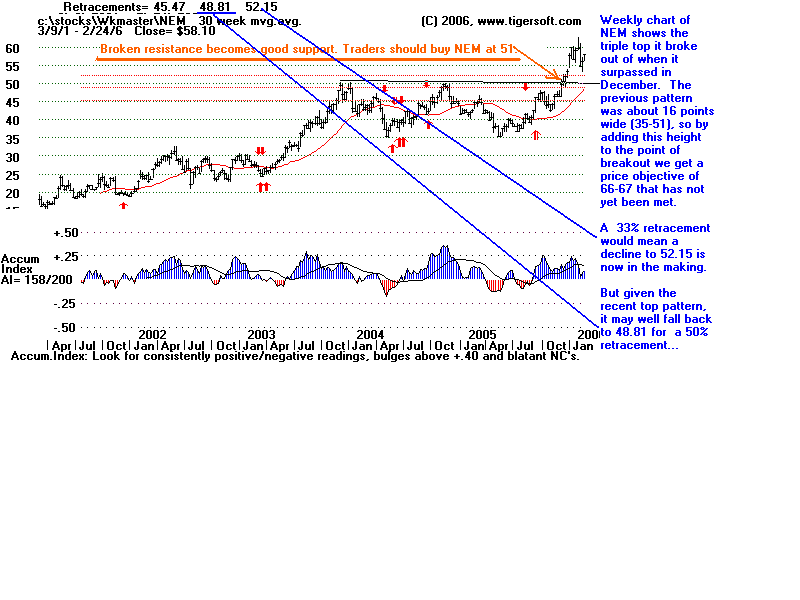
Below is NEM. The weekly chart shows the breakout above a triple top just above 50.
"Broken resistance becomes good support". That is an axiom of technical analysis.
So, the next decline to 51 should bring a playable rally.
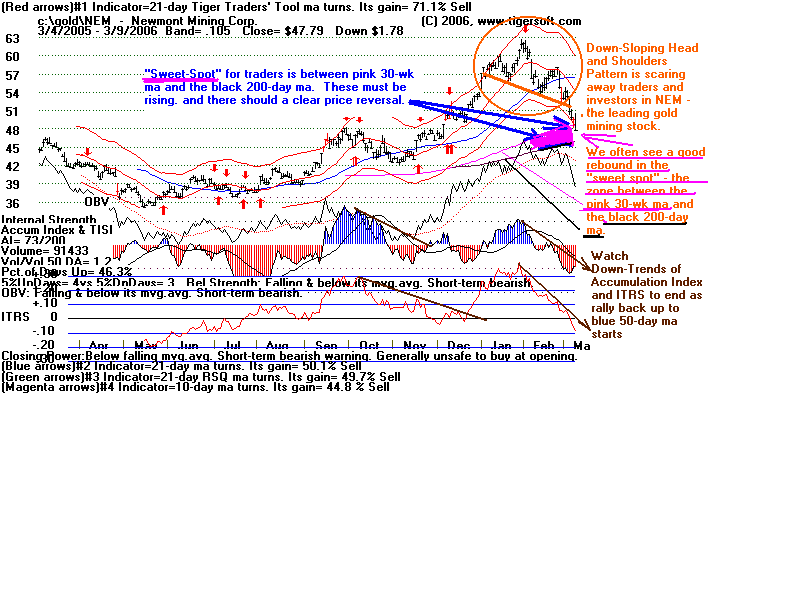
But the picture is not clear-cut. The daily chart shown at the bottom argues caution:
the stock will have completed a bearish head and shoulders pattern and be below
its 50-day ma. The weekly charts take precedence over the daily charts, but it is usually
better to have them both in agreement.

