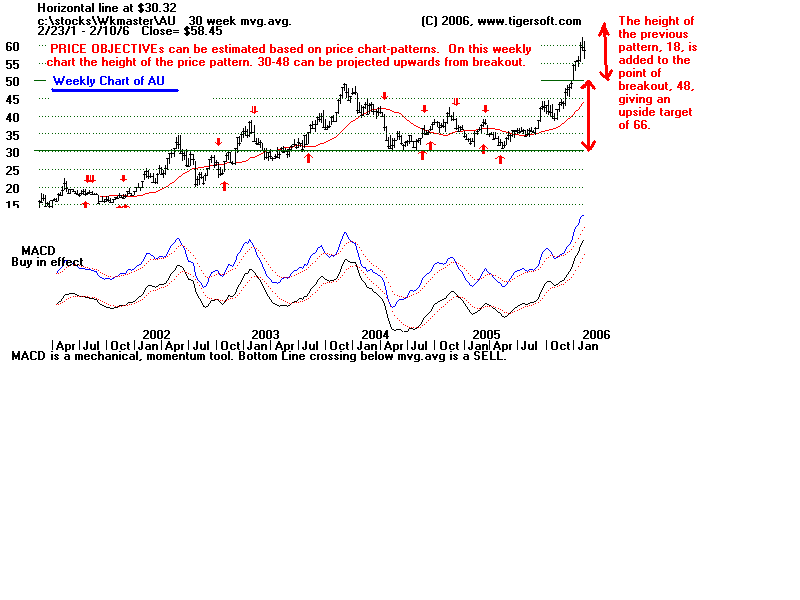
Use The Height of A Chart Pattern To Give A Minimum Price Objective
After A Price Breakout Occurs.
Weekly chart patterns let you see the bigger picture. Here AU made a breakout at about 48.
The previous pattenr was approcimately 18 points highs. That sets up a minimum objective
of 66. After current slide in oil is over, I suspect that AU - being a leader in the group and
running in all-time high territory where there is less resistance - will rise to that level and beyond.
