PO Box 9491
San Diego, CA 92169
(858)-273-5900
When To Take
Profits
in High Accumulation, Ballistic Stocks
Selling high accumulation stocks as
well as any others
are done using six TIGER guidelines:
by William Schmidt, Ph.D. - Tiger Software -
San Diego, CA
(Editor's note: This was written in mid-90's.
You will see how timely this information was in the Bear Market of 2001-2003.)
When should we sell?
(1) We seldom choose to fight a bear market-trend by holding speculative or high tech
stocks once our Peerless Stock Market Timing Software has given three or more
"S9" sell signals in the course of a year.
Such an automatic signal tells us when to sell out because the ice
underneath the market is too thin. The Peerless Stock
Market Timing Software's famous killer "S9"s, are discussed elsewhere in
these articles.
Look at the way the steep 1990 decline hit three typical computer stocks. You will see the
PEERLESS "S9"'s in August super-imposed on the charts of AAPL (Apple), CPQ
(Compaq) and DEC (Digital Equipment). (Much worse declines could be shown for the October
1987 Crash, which PEERLESS also perfectly predicted on a fourth "S9". In fact,
you can see any stock charts back to 1985 with Tiger's Power-Stock-Ranker
Software and the a TC-2000 Historical Data CD-ROM.)
![]() Click to see chart of Apple's top in July 1990 at the time of
our PEERLESS Major Sell Based on DJI.
Click to see chart of Apple's top in July 1990 at the time of
our PEERLESS Major Sell Based on DJI.
.
![]() Click to see chart of Compaq's top in July 1990 at the time of our PEERLESS
Major Sell Based on DJI.
Click to see chart of Compaq's top in July 1990 at the time of our PEERLESS
Major Sell Based on DJI.
. ![]() Click to see chart of Digital Equipment's top in July 1990 at the
time of our PEERLESS Major Sell Based on DJI.
Click to see chart of Digital Equipment's top in July 1990 at the
time of our PEERLESS Major Sell Based on DJI.
Similar charts showing even more dramatic declines were seen in October 1987, another
major top signaled by the Peerless Stock Market Timing
Software.
(2) We have learned use Tiger's Power-Stock-Ranker Software to watch for price head and shoulders patterns with our Accumulation Index dipping into negative territory while the right shoulder is being made. You can see an example of this just above in the case of DEC. By way of illustration, look at CUBE and CARN.
![]() Click to see chart of C-Cube's massive head and shoulders top in
mid 1996.
Click to see chart of C-Cube's massive head and shoulders top in
mid 1996.
Lesser known Carrington Labs is proof that small companies often reverse and decline
dramatically after completing a quick head and shoulders top. Profits are won by the ever
-vigilant.
![]() Click to see chart of CARNs top in mid-1996.
Click to see chart of CARNs top in mid-1996.
Serious deterioration of the TIGER Accumulation Index is very common among stocks that form major tops. Its appearance with a vast majority of high tech stocks in April and May 1996 warned of the coming 20% NASDAQ decline in June-July 1996.
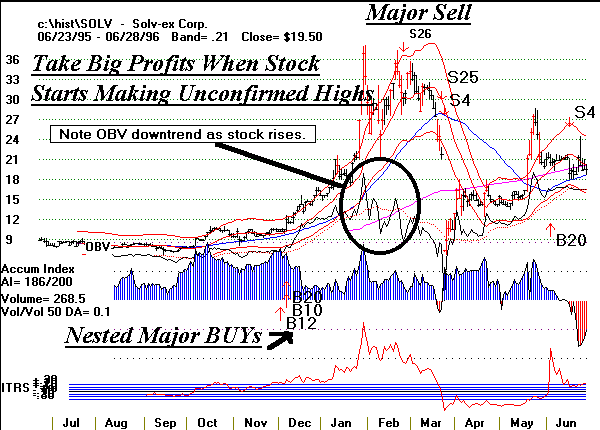
(3) We sell our favorite high-tech high accumulation stocks when they start making new highs which are unconfirmed the On-Balance-Volume Line (OBV) not making new highs. Two recent examples, SOLV and ZOLT, show the dangers of not heeding the warnings of "false new highs".
