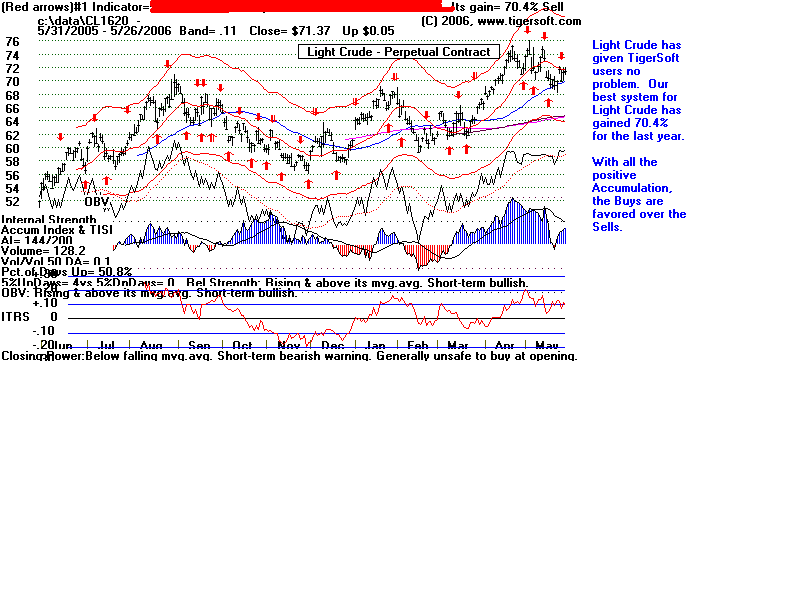
Light Crude, Sugar and Live Cattle
The US stock markets will not go up much if Light Crude rises above 76. TigerSoft still
shows high Accumulation on the Light Crude chart. The OBV Line (which shows aggressive
buying) is hovering near its yearly highs. The rising 50-day ma is bullish. But it has stalled out
at its falling 21-day ma and it is on a short-term Sell. (We have covered up the basis for the
best system.)
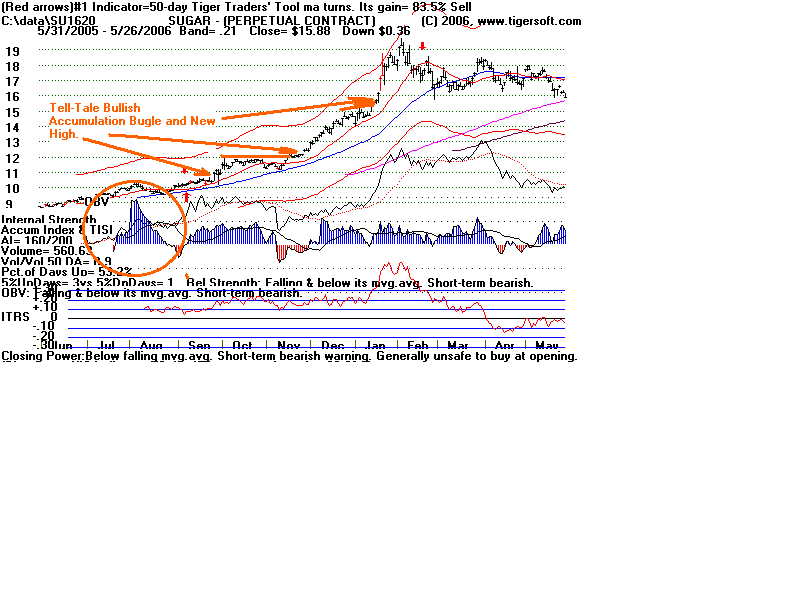
Look at the Sugar chart, See the bulge of Accumulation and subsequent new high. This is
usually a perfect setup for a Buy. Tiger users can flag these bullish setups each night.
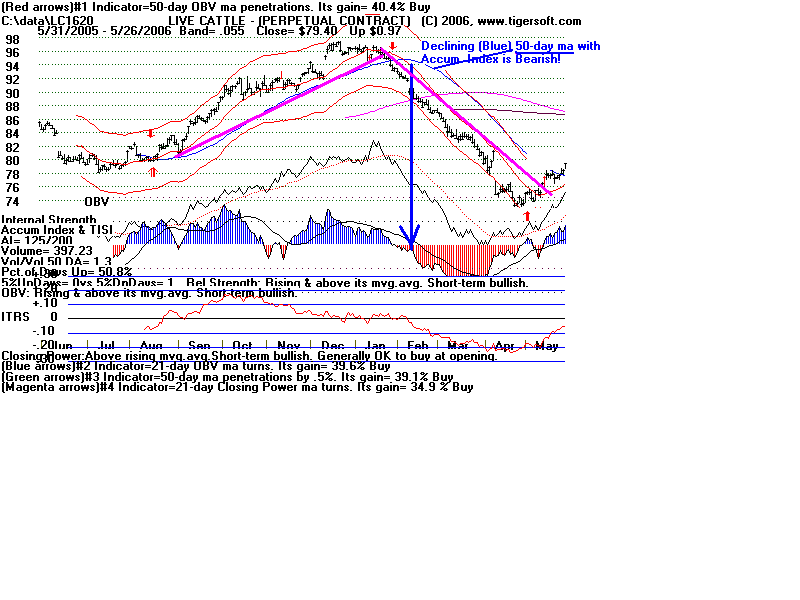
But don't fight the trend. A declining 50-day ma with an Accumulation index below 0 must be
heeded. Look at the Live Cattle decline below.