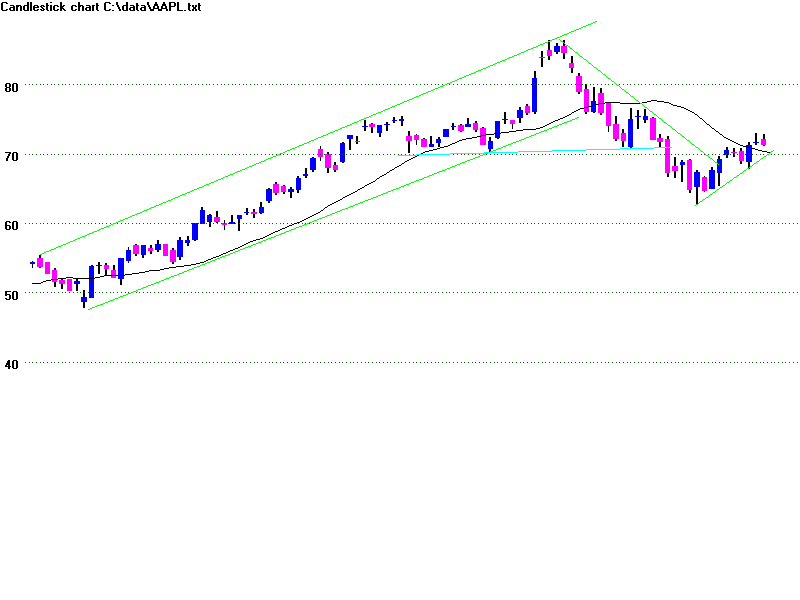
They compress key price information into the charts. They show only
a half year's data. But they let you look at it closely. When the chart turns
to a significant amount of blue, the short term becomes bullish. When it
turns to a signicianct amount of magenta, it turns bearish. What amount
of color change is considered significant? Candlestick devotees judge
this by the bullishness or bearish of the daily formations.
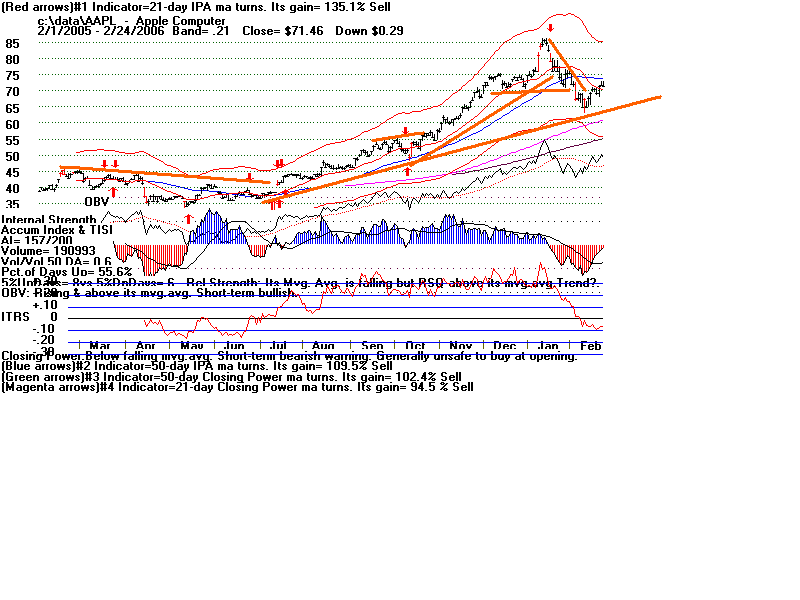
The chart at the bottom is the standard Tiger chart. 2/24/2006

