8/15/2009 Tiger Software Home-Page www.tigersoft.com
TigerSoft &
Peerless
Preview
Since 1981, we have been helping Professionals and the Public
around the World to Maximize Stock Profits and Avoid Devastating Declines.
Tiger Software Charts Make Analysis of Stocks Simple, Easy and Profitable!
 Next San Diego TigerSoft User Group Meeting July
11th
Next San Diego TigerSoft User Group Meeting July
11th

Call or write us today.
(C) 2009 www.tigersoft.com 858-273-5900
william_schmidt@hotmail.com PO Box 9491, San Diego,
CA 92169
Tiger Software offers
(1)
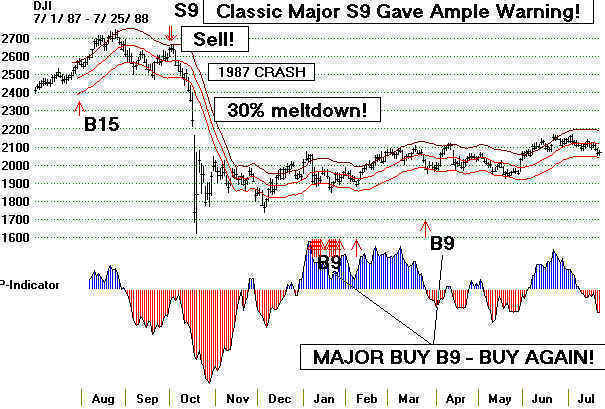
Peerless Stock Market Timing: 1915-2009
Automatic Buys and Sell Signals
back-tested to 1915
Peerless Means Bigger Profits and
More Safety
Peerless Is A Great
Way To Trade DIA, QQQQ, SPY or IWM,
Peerless Made More
than 200% in 2008-2009 Trading ETFs for Russia, Brazil and Mexico.
Peerless and Major
ETFs: 1996-2009
Peerless Buys and Sells Brought Whopping Gains
in Brokerage
Stocks, Gold Stocks and Volatile Tech Stocks.
http://www.tigersoft.com/--1--/PEERLESSindex.html
>>> ORDER $395
PEERLESS STOCK MARKET TIMING HERE. <<<
(2)
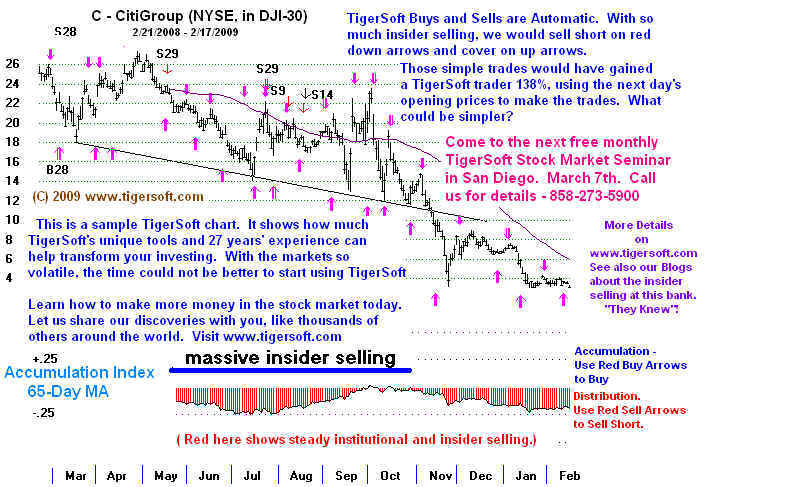
TigerSoft's Trading Advantage Tools
for Spotting Insider Buying and Selling
TIgerSoft is "Game
Changer! Separate Optimized Buys/Sells.
Trade with Tiger's Unique
Accumulation Index, Closing Power
and Very Profitable
Automatic Buys and Sells
Insider Trading Is The Mother's Milk of
Wall Street.
Now TigerSoft Lets You Legally Trade
As Though You Were An Insider.
Spot The Difference.
Use TigerSoft's Unique Tools To Spot Insider
Trading
"Accumulation Index" and "Closing Power".
Insider Buying
Insider Selling.
Insider Selling in 1929 versus Bunker Hunt's Buying Silver in 1979.
Different Trading Applications of
TigerSoft
TigerSoft Insights into Key Insider
Trading
===> Order
TigerSoft Here ...$295.
===> TigerSoft/Peerless/Data
for 7 months, Hotline - 3 mo $495
(3) Tiger Power
Ranker To Scan 7000 Stocks
with One Command To Find Most Bullish
and Most Bearish Stocks
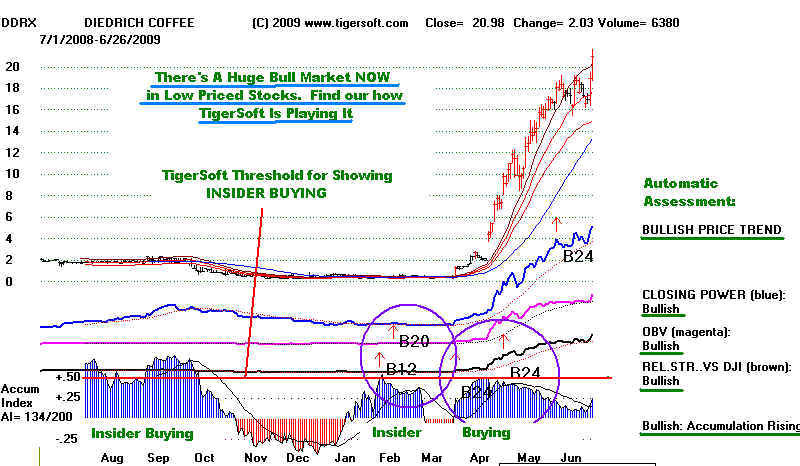
2009's Fabulous BULL
MARKET among Low Priced Stocks
TigerSoft's POWER STOCK RANKER
$395, after Purchase of
Peerless Stock Market Timing and
TigerSoft
(4) Nightly
On-Line Hotline for Market Timing
Nightly Hotline ($298/yr).
===> Order Here
$298
Total
Package -
Everything! Includes Peerless, TigerSoft and Tiger
Power-Ranker, 3 2Books,
Research, Data, Bullish and Bearish Special Situations....
plus Errkly Elite Stock Professional (ESP) Report and ALL Software Updates for a Year!
===> Order Here
....
$995.
====================================================================================
Examples:
(1) Peerless Stock Market Timing: 1915-2009
(2) TigerSoft's Trading Advantage
Tools
for Spotting Insider Buying and Selling
(3) Tiger Power Ranker To Scan
7000 Stocks
with One Command To Find Most Bullish
and Most Bearish Stocks
(4) Sample Nightly Hotline -
7/1/2009
7/1/2009
7/1/2009
Peerless Buy B5 Operates ...
Resistance Levels Are Being Challenged.
DJI 8504 +0.68%
SP-500 923.33 +4.01
NASDAQ 1846 +10.68 +0.68%
USO 37.46 -1.24% GLD
92.39 +1.33%
SLV 13.55
+1.27%
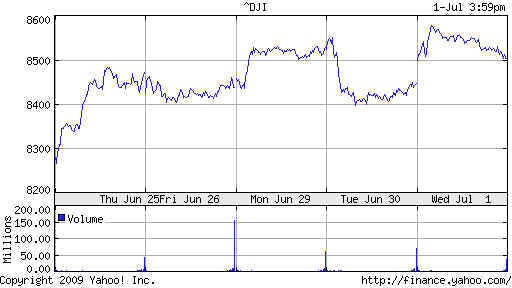
DJIA AND SUPER-IMPOSED PEERLESS
SIGNALS STOCKS
7/1/2009 la/ma= .992 21dma roc=-.328 P= 30 IP21=
-.08 V=-148 OP = -.243
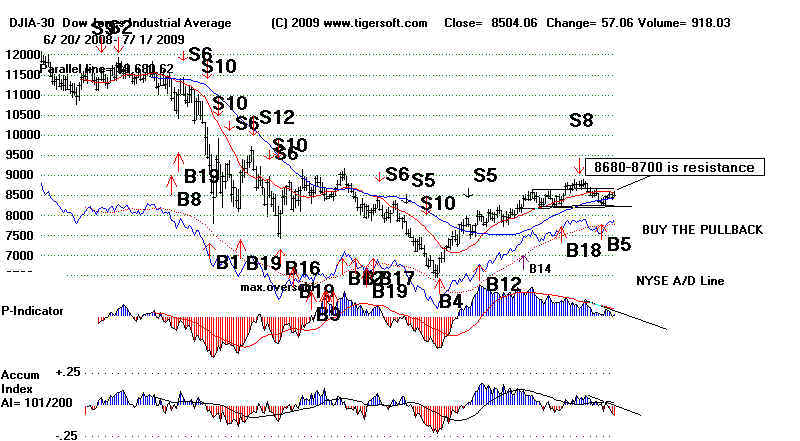

DIA - ETF for DJIA
Chart
Note the bearish head and shoulders pattern
that is developing with DIA's Closing Power. The DIA's price pattern shows such
a pattern is emerging. The DIA's red Buy is based on its
upside penetration of 50-dma.
The DIA's Closing Power's downtrend has been penetrated for a trading Buy.
The Closing Power is bearishly below its falling mvg avg. Expect resistance at
86-87
as the DJI tests the right shoulder in a potential head and shoulders pattern. Support
is at 82. Wednesday'-Fridays are each up 50.9% to 52.9% for the last year.
It's
Mondays (22.4%) and Tuesdays (48.1%) that longs have to be worry about.
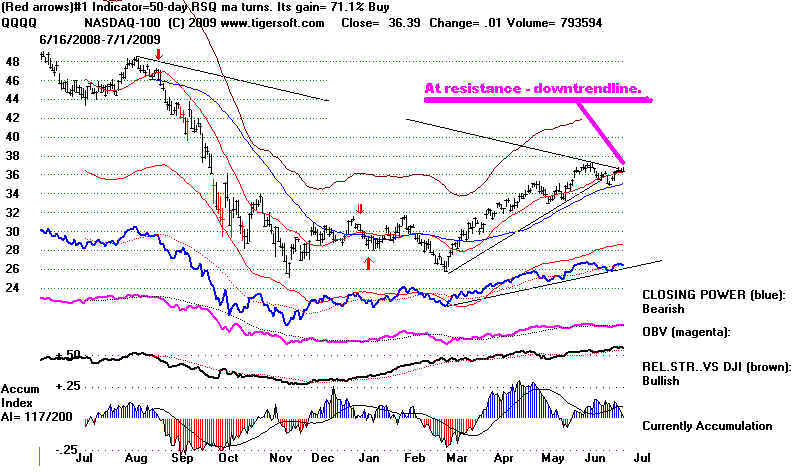
QQQQ Chart
The QQQQ is
rebounding from its rising 50-day ma. Its internal strength readings are
rated "bullish". 38 is a reasonable target based on the height of its
earlier trading
range, 26-32 and its breakout at 32 plus the height of the base pattern. The
exceeded
April
high at 35 did act as support. That is bullish. The QQQQ has been
outperforming
the
DJI for 5 months when one looks back 50 days and 7% over the last 50 trading days.
Mondays for the last year have brought a QQQQ gain only 33% of the time.
Wednesday, Thursday and Friday show a probability between 49% and 51%. It's
Accum. Index is still considered "bullish".
SPY Chart Note the emerging head and shoulders pattern. the neckline crosses
at 89.5. The Closing Power could not get past past its falling 21-day ma.
TheCP is also
forming what may become a head and shoulders top pattern.
The SPY is now
above its now rising 50-day ma and falling 200 day ma. Mondays
for the last year have brought an SPY gain only 33% of the time. Tuesdays and
Wednesdays rise 51.8% of the time. Thursday's are up 60% and Fridays 57%.
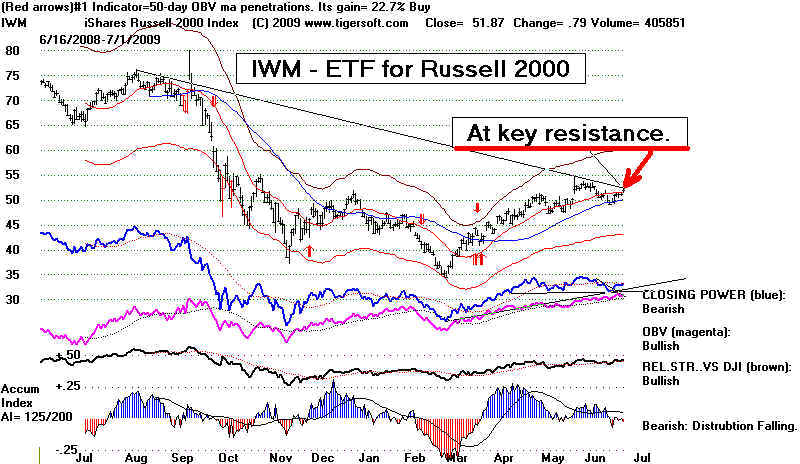
IWM - Chart
IWM has turned up from its rising 50-day ma. It now faces the resistance of its
price downtrendline. A breakout would be bullish. Its Closing Power
downtrend
has been violated giving traders a Buy. Wednesday's are
up 57% of the time, Thursday's
50% and Fridays 67%. Mondays - 32.6% and Tuesday's 51.8%.
Tiger Index of Low Priced Stocks
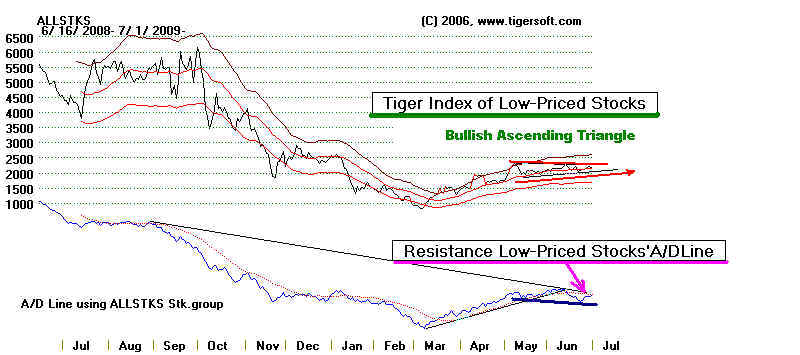
7/1/2009 Buy B5 ... Resistance Levels Are Being Challenged
The period just before the July 4th weekend rallies more than 70% of the time.
A move above the H&S apexes of the SPY and DIA coupled with breaks in the 12 month
down-trendlines of the QQQQ and IWM under the normally bullish influence of
trading before July 4th may cause a short-term jump in prices. Look at how often
markets take off after prices exceed the resistance of the apex of right shoulders
in these patterns.
The resistance of the downtrending A/D Line for speculative low priced stocks
has also been reached. The operative Buy B5 and rising Closing Powers suggest
an upside breakout. Even if it does not occur, the head and shoulders pattern will
still
not be bearishly completed until the necklines' supports are taken out.
Many high accumulation low priced stocks seem indifferent to the techincal
significance of trading the next few days. Look at how strong are BORL, GPX, ATSI,
DRCO, TRCR, HWKN, AIXG, BKYF, CRAY, LAD and STEC.
Surely, it is bullish that the market can rally when the biggest state in the Union
cannot pay its bills and when so many low priced stocks can double and double again
in 4 months without Wall Steet heralding or hawking them to private investors.
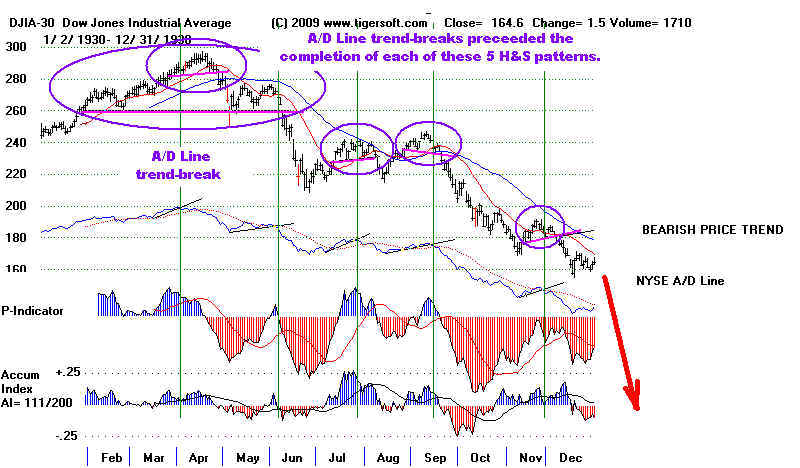
The NYSE A/D Line now is still uptrending. Typically, there
first is a break in the
NYSE A/D Line uptrend before a DJI head and shoulders pattern is completed.
That was true in each of the five head and shoulders patterns in the period 1930.
Five Head and Shoulder Patterns in the DJI in 1930
The A/D Line Uptrend in Each Was First Violated.
