Daily Blog
- Tiger SoftwareShort-Term Trading Using TigerSoft
A DEMONSTRATION
2/5/2009
Recommended Stocks' prices updated for 2/10/2009
William Schmidt, - Tiger Software's Creator
(C) 2009 William Schmidt, Ph. D. - All Rights Reserved.
www.tigersoft.com
No reproductions of this blog or quoting from it
without explicit written consent by its author is permitted.

TIGER BLOG
Short-Term Trading
Using TigerSoft
A DEMONSTRATION
2/5/2009 Prices Updated 2/9/2009
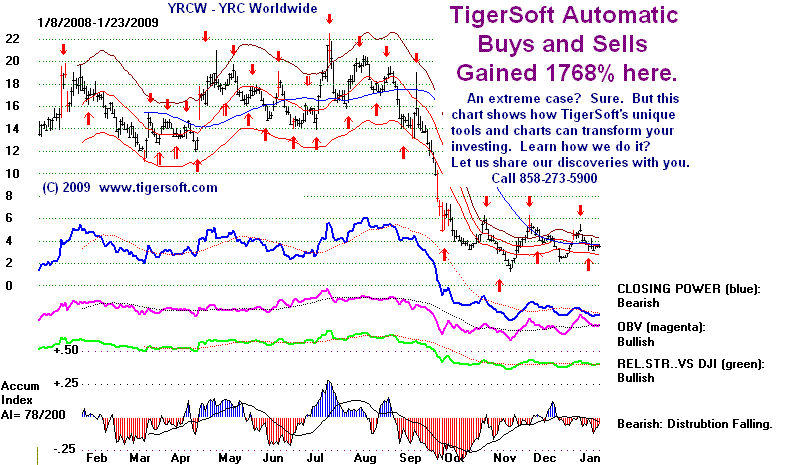
Sample Chart
Look at the chart of YRCW above. It is a a sample TigerSoft chart. The red Buys and Sells are
optimized, meaning the computer, before it even puts a chart on the screen, in a flash calculates what the
best trading system is for a stock and then displays its red Buys and Sells. The TigerSoft chart then displays
the gains achieved had one traded the signals, buying, selling and selling short; or if someone likes, what the
gains were only buying and selling. The indicators below the year's price history are automatically interpretated.
History Does Repeat over and over.
There is no guarantee that the future will work out like the past, of course, but stocks do have personalities,
because each stock attracts a certain type of person, trader or investor. And so the trading patterns are likely
to continue. In many cases, the best trading system continue to work for years, known only to professionals
controlling the stock and to.TigerSoft users. How can anyone seriously understanding how to trade any
given stock, not want to know what TigerSoft can teach.
Professionals Make Certain Trading Systems Work Repeatedly
We have discovered that professional traders, such as those that make markets in options
on a stock,
commonly use one particular indicator to
control and trade those stocks that are particularly amenable to
their control. The best trading system for YRCW
or any stock is shown at the top of the ordinary chart.
along with the percent gain obtained for the
last year when trading it with a starting capital of $10,000.
Use TigerSoft's Power Ranker To Find The Best Trading System
TigerSoft users can readily find stocks that are controlled in this fashion by noting what
is the basis of the
best trading system for these stocks.
To make this search easy, TIgerSoft's Power-Ranker lists all stocks'
best trading systems and gains. We
especially like one particular system used for very short-term trading,
but you could easily pick another system
and quickly see the stocks traded best with it. This allows you
to find the stocks that are best traded
over various time periods, from very short-term to three or more months.
The Preferred Trading System of Professionals
When we do
a frequency distribution of what is the best trading system for all stocks, we commonly
find
that one particular system occurs 3 or 4
times more often than would be expected by chance. This we call the
the traders' most preferred system. That is the
basis of the superb trading with YRCW. To make
it easy for traders starting out with
TigerSoft to use our tools most effectively, I have built a group of about
150 stocks that trade exceptionally well
with this particular system. Their yearly gains are over well over
+100% for the year using the Red buy and
Sell arrows. Users can quickly download the data for these
stocks and scan them for new Buys and
Sells. Look at the high performance achieved in trading the stocks
for buys below:
Performance of TigerSoft's Best Trading System
-Buy on Red Buys and Selling Short on Red Sells.
-Close out position on Opposite Signal.
-Reinvest Gains, Start with $10,000, $40 trade/slippage.
NEM Newmont Gold
+126.1%
DGIT DG FastChannel
+328.1%
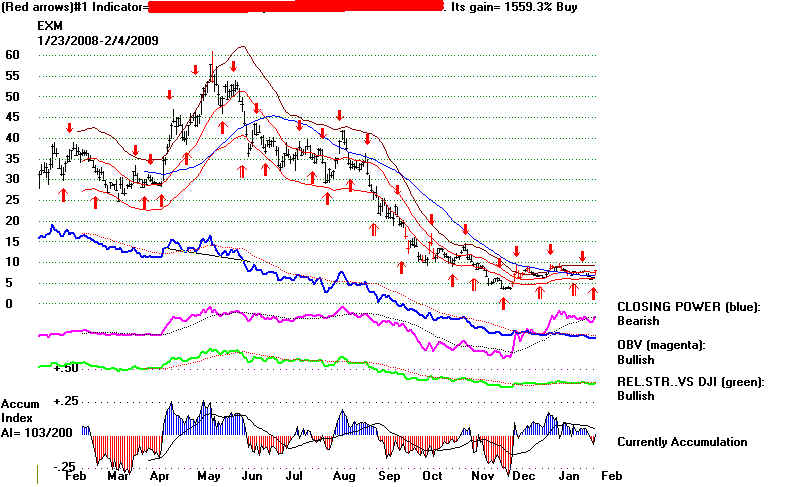
EXM Excel Maritime Carriers
+1559.3%
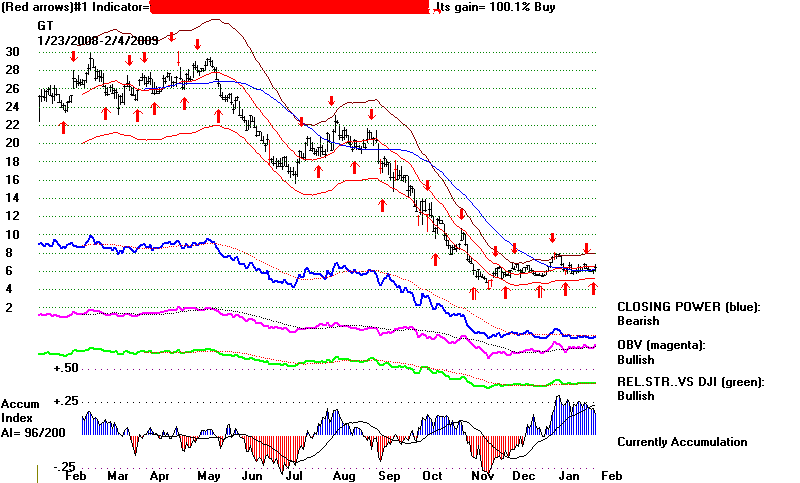
GT GoodYear Tire
+100.1%
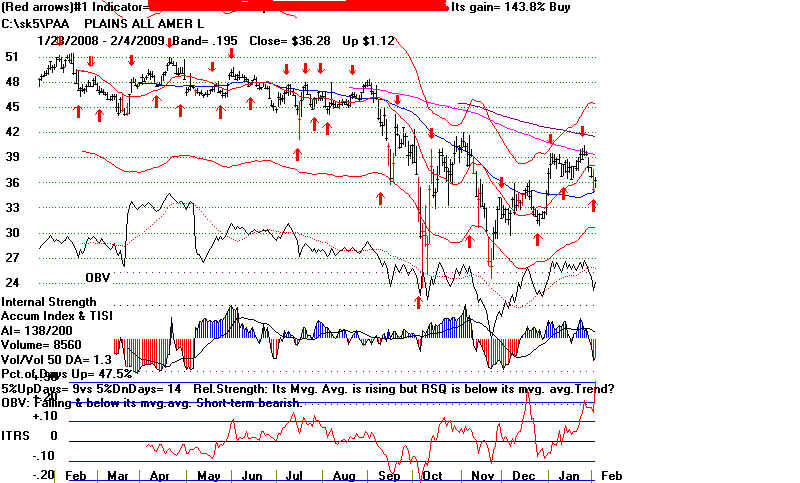
PAA Plains All American Pipeline +143.8%
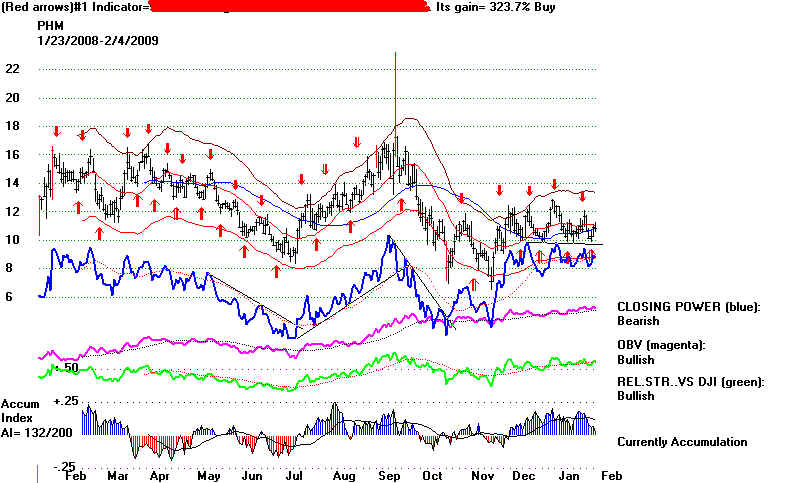
PHM Pulte Homes
+327.7%
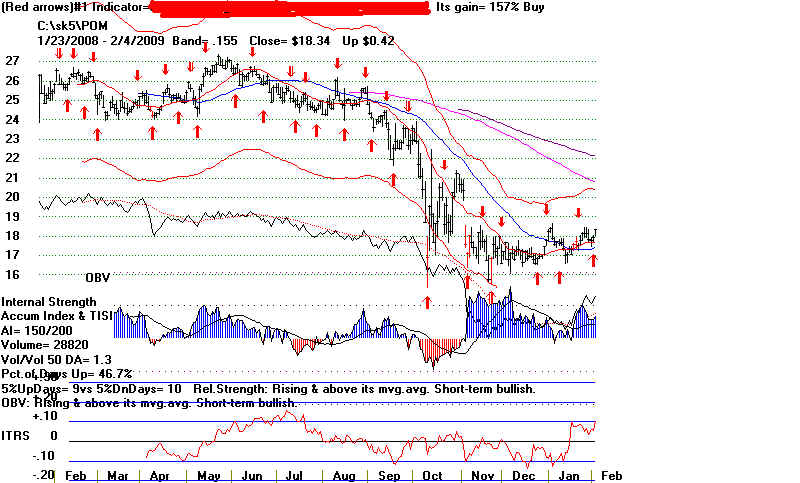
POM Perco Holding
+157.0%
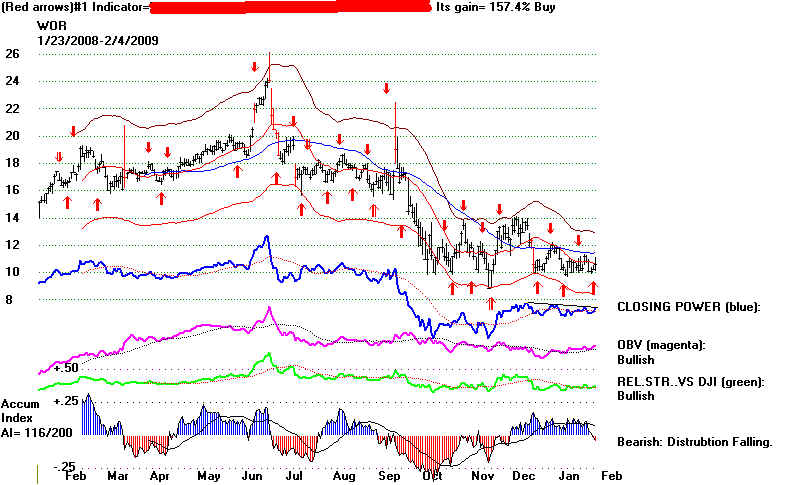
WOR Worthington Ind
+157.4%
Short-Term Trading Buys Now
Morning,
February 5th, 2009: The market turned up strongly after a week opening. Out
Hotline has
said to wait for this to do some
buying. What stocks might have been bought today? I list below
some attractive Buys among the
"preferred trading stocks.: In picking these stocks, we would want
also to assess support and
resistance levels and chart patterns. But this takes some experience.
It is better for new users simply
to see:
1) how many of the key internal strength readings are rated "Bullish".
Four is best.
2) if the TigerSoft chart shows the 2nd, 3rd and 4th best trading systems are also on
Buys.
The NEM (Newmont Gold) illustrates
a new red Buy with both other factors also rated bullish.
Summary of Buys from 2/4/2009:
Red = Red Sell on stock
Red
= short-term Sell from SP-500 and QQQQ
2/4
2/5
2/6
2/9
NEM Newmont Gold
39.99
40.91 41.53
40.36
DGIT DG FastChannel
13.92 14.57
15.00 14.90
EXM Excel Maritime Carriers 7.98
7.60 8.09
8.74
GT GoodYear Tire
6.40 6.93
7.17
7.24
PAA Plains All American Pipeline 36.28
37.50
38.10
38.25
PHM Pulte Homes
10.83 11.28
12.34
11.36
POM Perco Holding
18.34 18.31
18.58
18.59
WOR Worthington Ind
10.56 10.62
11.32
11.17


