TIGERSOFT
BLOG
www.tigersoftware.com
Views the mainstream media eschew.

SELL SHORT BOND FUNDS
Bond
Funds Now Look More Bearish Than
Housing
Stocks Did at Their Peak in 2005.
3-8-2013
www.tigersoft.com
(C) 2013 Wm. Schmidt, Ph.D.
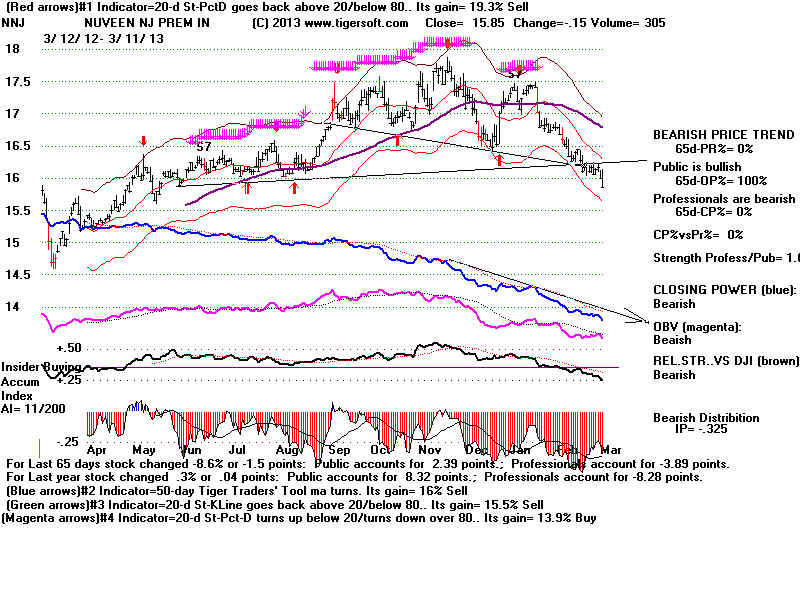
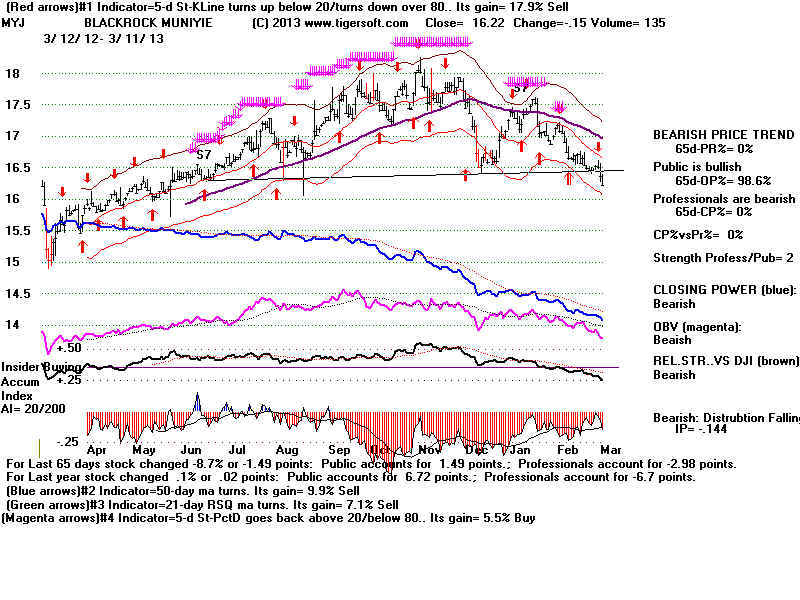
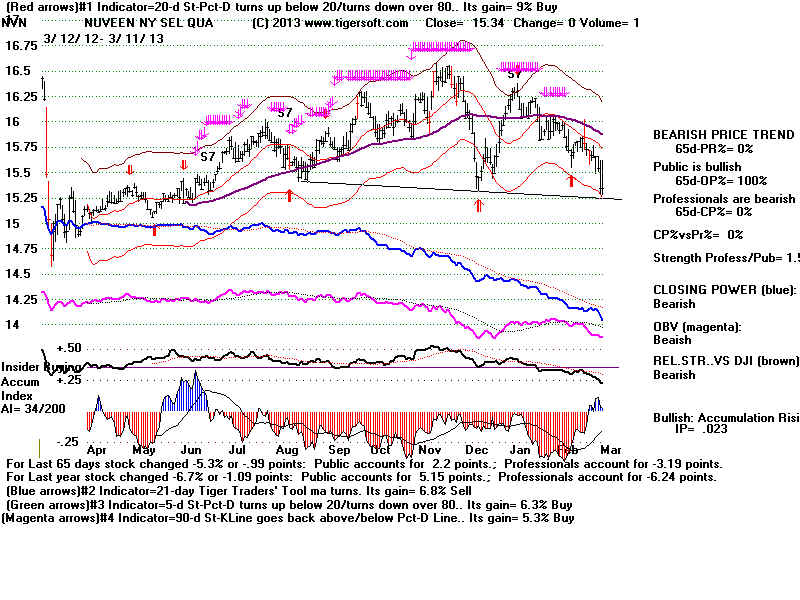
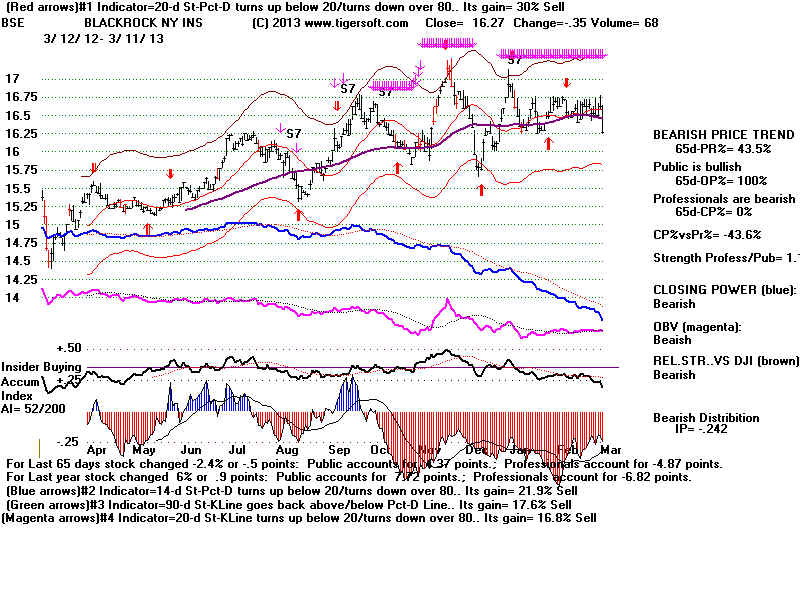
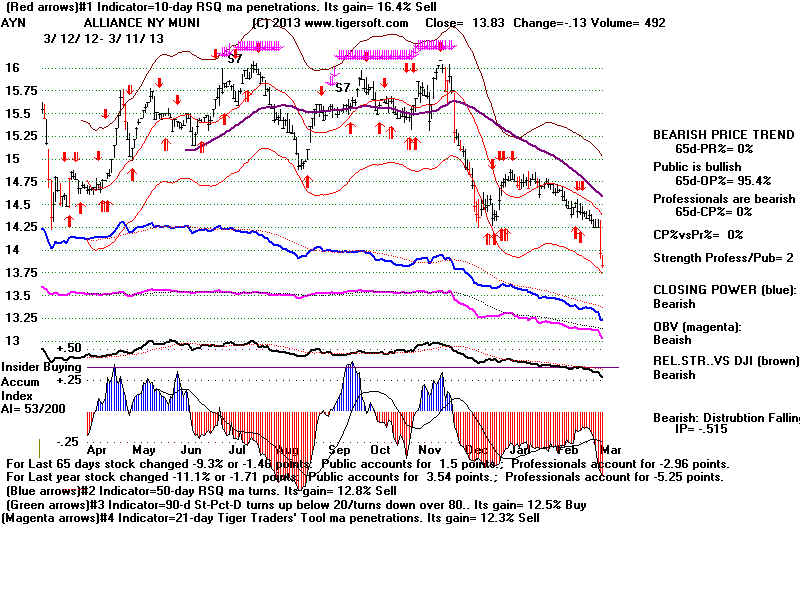
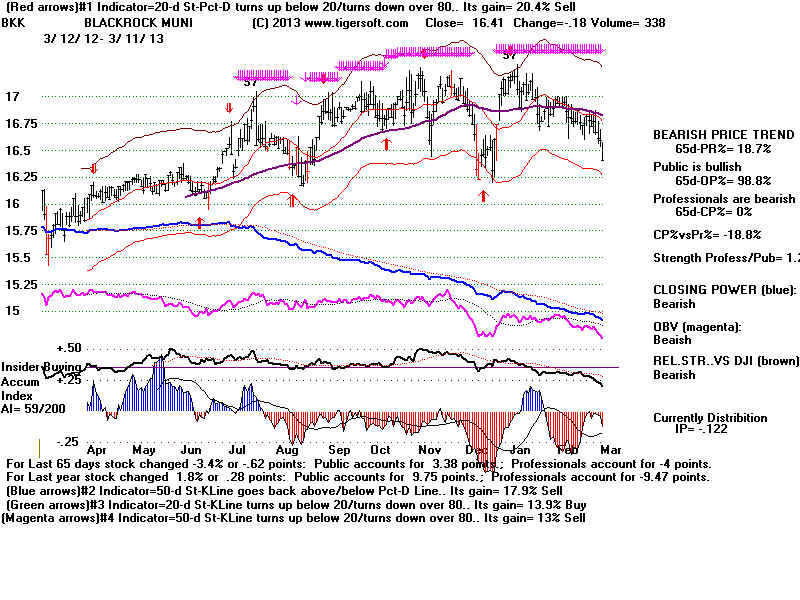
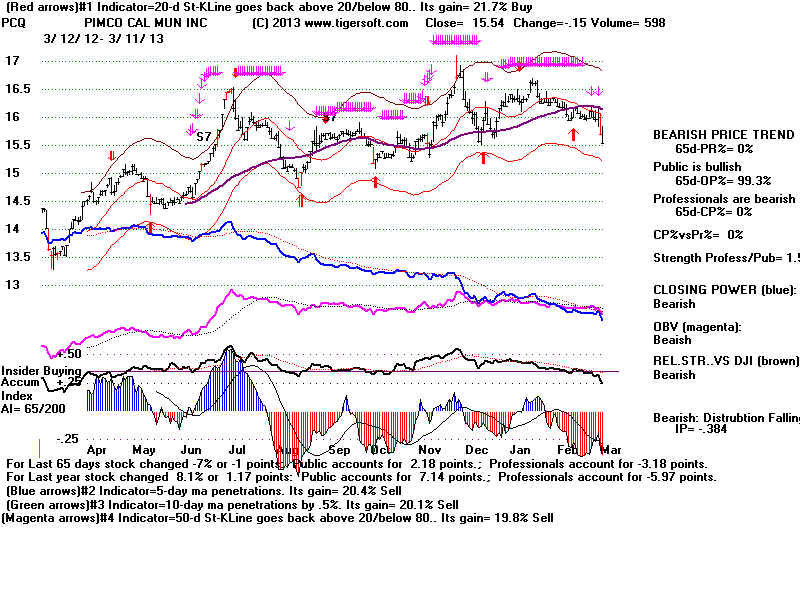
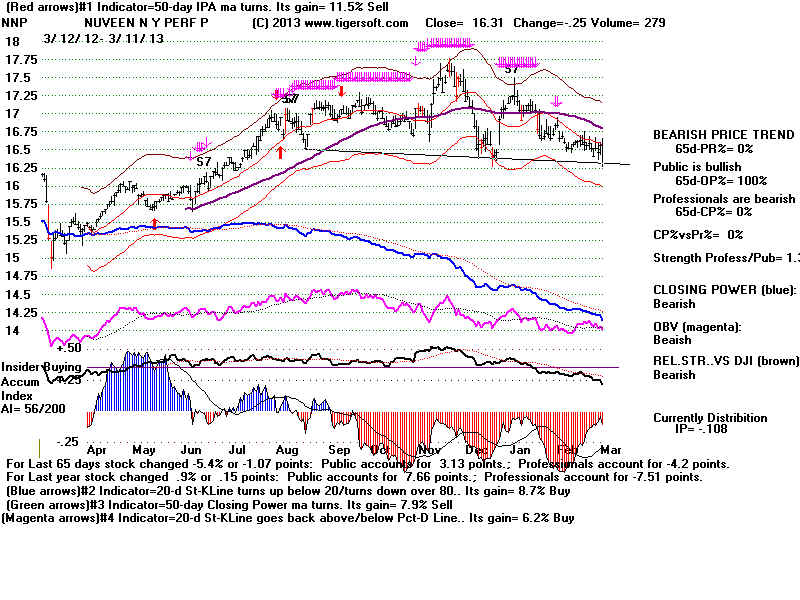
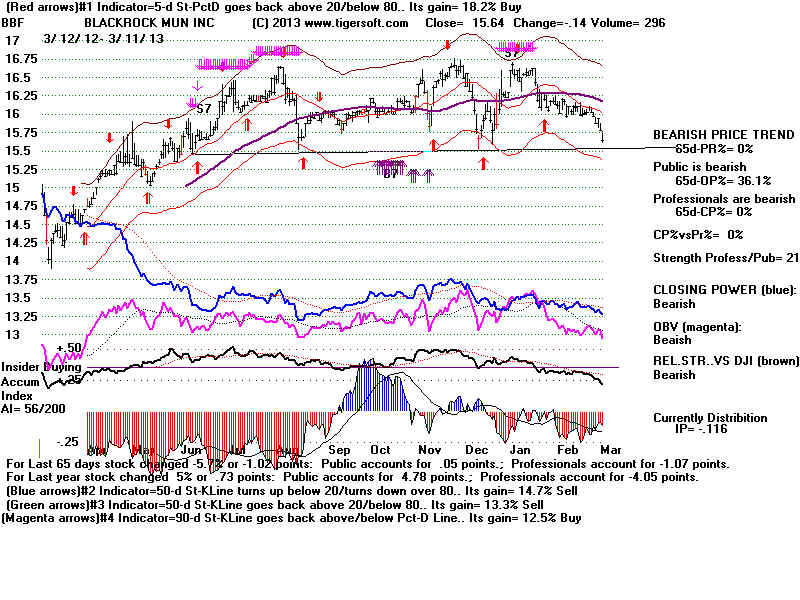
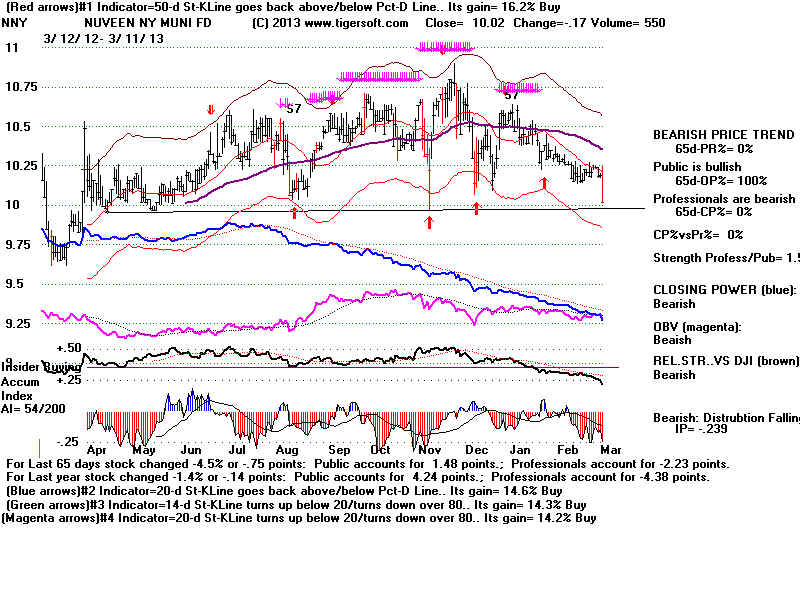
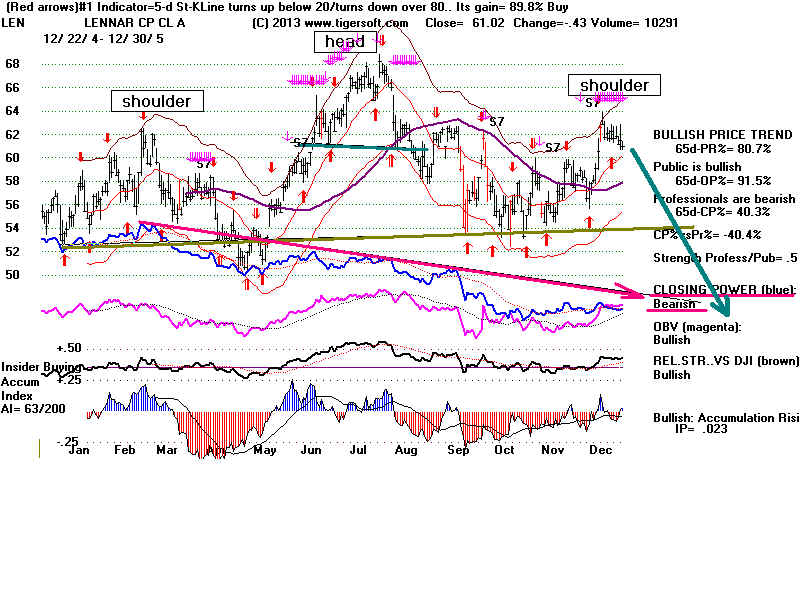
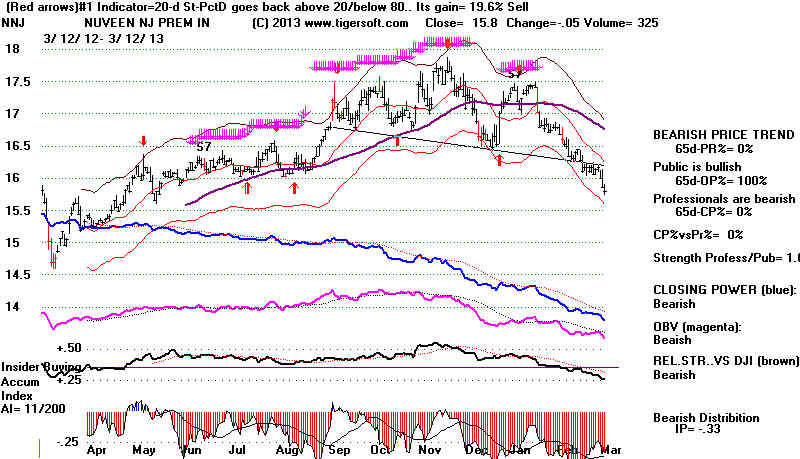
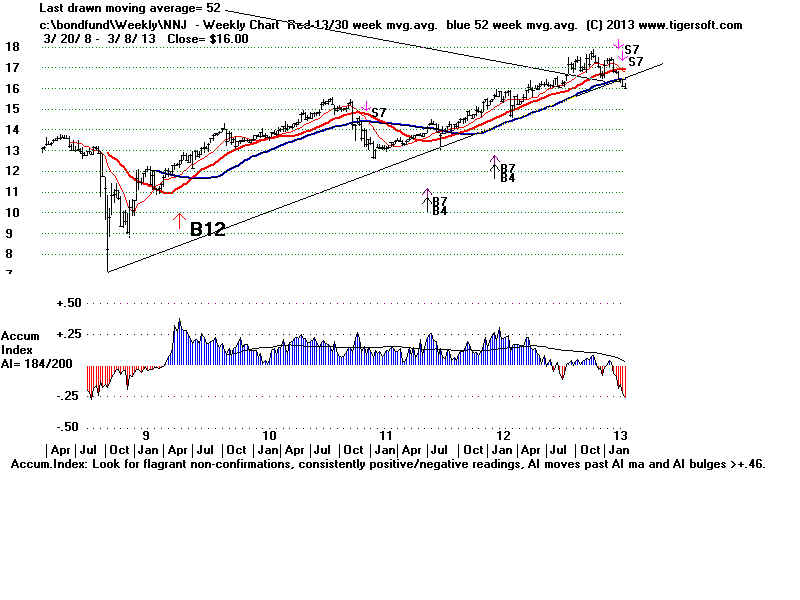
Compare a typical Bond Fund's chart with a
home-builder in 2005. This bond fund
and many others looks much more bearish than this
home-builder:
1)
more red Distribution from TigerSoft's Accumulation Index,
2)
a steeply falling Professional Closing Power Line with almost no rallies and
3)
many more red Sell S7 warnings.
4)
the OBV Line is collapsing.
5)
the Relative Strength makes one new lows after another.
Home-Builder
LENNAR at end of 2005
 |
Bond
Fund NNJ in March 2013.
 |
The Stock Market's rally is telling us that the offical
unemployment level is likely to drop
below 6.5% sooner than the Fed thinks. At least, that is my
take on the DJI's spirited
rally. When that happens, demand for loans and mortgages
will surely rise sharply. And
the Fed will no longer need to, or be able to, keep interest
rates very low. Bonds
will surely fall as interest rates start rising back again.
Keep in mind that long-term
interest rates sold with more than a 14% yield in 1980.
When the world economic
slow-down ends, expect other currencies to strengthen. This
will inevitably mean
the withdrawl of hot overseas money from US bonds as their haven.

Tiger Index of 156 Bond Funds
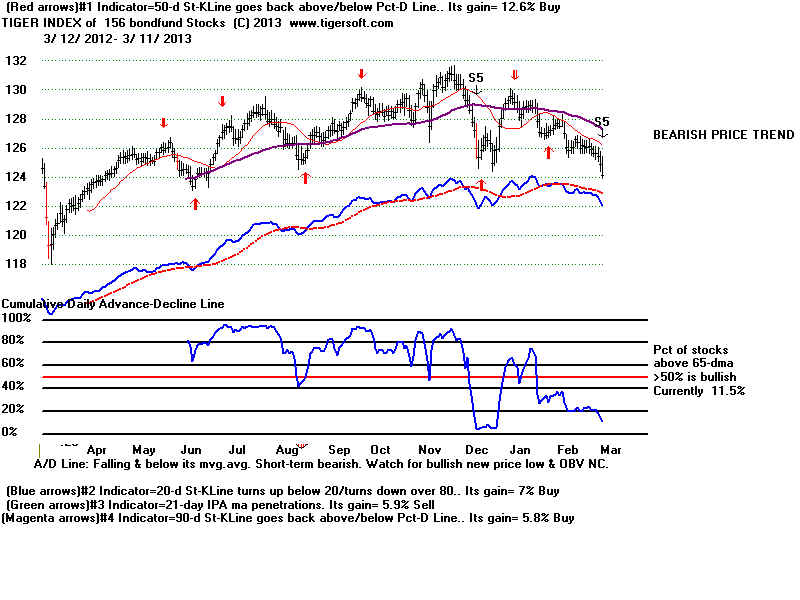
5 YEARS' WEEKLY PERSPECTIVE
ONE YEAR DAILY CHARTS


