Check current Oil Prices
Oil Prices and The Stock Market: 1970-2006
Will US Attack Iran?
At the start of Bush's decision to have the US attack Iraq, light crude was priced under
$25/bar.
It has now
nearly tripled. The new British Prime Minister, Gordon Brown, recently declined to
reject outright
military
action against Iran. Prospects of such an attack would almost certainly cause oil
futures to
go through
the roof. Is such an attack likely? Investors will want to read what I have
quickly gathered
on the
internet and then do their own research, Watching crude oil futures will likely give
investors a better
way to see
this coming than listening to Bush or Brown.
It is said that rising oil prices act like a tax on consumers.
Money spent by consumers on oil
is
not spent on other goods and services. So, profits and sales in many other businesses are
squeezed..
Far
too simple, this overlooks the additional buying power that oil companies and their
employees may
have
and use. I see this each time I get an order from someone in Texas.
A bigger danger is that oil producing countries may stop accepting dollars for payment,
because
the
dollar becomes too weak. Iran announced this April that they would accept only Euros
or Yen. The US
has a
current net -$862,300,000,000.00
in its
international trades of goods and services. When OPEC
was
formed, all the OPEC countries agreed that they would only sell oil for dollars and dollar
denominated securities. In other words, if you wanted to buy oil from an OPEC country, you
had to
buy
dollars first. This created a ready demand for dollars. And OPEC countries
tended to invest
much
of the "petro dollar wealth" back in the US. The run-up in oil prices
since 2002 thus actually
boosted the US stock market and its economy. If OPEC changed their rules and allowed
other
countries to buy in another currency, it would mean far higher interest rates and
hyper-inflation in the US.
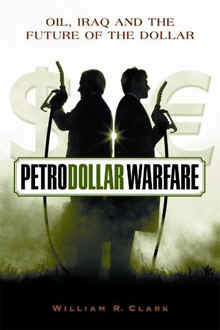
Read William
Clark's Petroldollar Warfare.
"It is now obvious the invasion of Iraq had less to do with any threat from Saddam's
long-gone
WMD
program and certainly less to do to do with fighting International terrorism than it has
to do with
gaining strategic control over Iraq's hydrocarbon reserves and, in doing so, maintain the
U.S. dollar as
the
monopoly currency for the critical international oil market. Throughout 2004, information
provided
by
former administration insiders revealed the Bush/Cheney administration entered into office
with the
intention of toppling Saddam Hussein.....
"Candidly stated, "Operation Iraqi Freedom" was a war designed to install a
pro-U.S. government
in
Iraq, establish multiple U.S military bases before the onset of global Peak Oil, and to
reconvert Iraq
back
to petrodollars while hoping to thwart further OPEC momentum towards the euro as an
alternative
oil
transaction currency. [ However, subsequent geopolitical events have exposed
neoconservative
strategy as fundamentally flawed, with Iran moving towards a petroeuro system for
international oil
trades, while Russia evaluates this option with the European Union."
(Source: http://www.energybulletin.net/7707.html
)
War with Iran
An attack on Iran is by, no means, unlikely. Pentagon war planning has started.
Administration
planning seeks to a regime change in Iran by covert means. Seymour Hersch wrote in
2005 in the New
Yorker:
"In my interviews [with former high-level intelligence officials], I was repeatedly
told that the
next strategic target was Iran. Everyone is saying, "You can't be serious about
targeting Iran.
Look at Iraq," the former [CIA] intelligence official told me. But the [Bush
administration officials]
say, "We've got some lessons learned , not militarily, but how we did it politically.
We're not
going to rely on agency pissants? No loose ends, and that?s why the C.I.A. is out of
there."
An article in The American Conservative by intelligence analyst
Philip Giraldi should be read.
"In Case of Emergency, Nuke Iran," suggested the resurrection of active U.S.
military planning against
Iran" but with the shocking disclosure that in the event of another 9/11-type
terrorist attack on U.S. soil,
Vice President Dick Cheney?s office wants the Pentagon to be prepared to launch a
potential tactical
nuclear attack on Iran ? even if the Iranian government was not involved with any such
terrorist attack
against the U.S.: (Source: http://www.energybulletin.net/7707.html
)
  Cheney
pushes Bush to act on Iran Cheney
pushes Bush to act on Iran 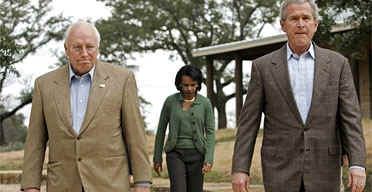
"Military solution back in favour as Rice loses out
President not prepared to leave conflict unresolved."
Ewen MacAskill in Washington and
Julian Borger
Guardian (UK) Monday July 16, 2007
"The balance in the internal White House debate over
Iran has shifted back in favour of military
action before President George Bush leaves office in 18 months, the Guardian has learned.
The shift follows an internal review involving the White House, the Pentagon and the state
department
over the last month. Although the Bush administration is in deep trouble over Iraq, it
remains focused
on Iran. A well-placed source in Washington said: "Bush is not going to leave office
with Iran still in limbo...
"Almost half of the US's 277 warships are stationed close to Iran, including
two aircraft carrier groups.
The aircraft carrier USS Enterprise left Virginia last week for the Gulf. A Pentagon
spokesman said
it was to replace the USS Nimitz and there would be no overlap that would mean three
carriers in
Gulf at the same time."
...............................................................................................................................................
Crude Oil: 2002-2007
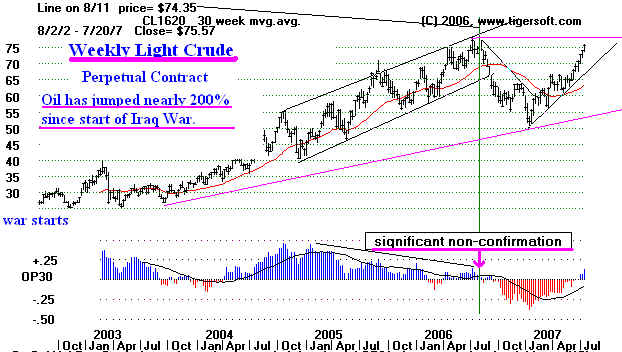
The current yearly chart of crude oil (using the perpetual contract data from Dial Data)
shows
an inverted head
and shoulders pattern. The height of the pattern before prices broke past
the pattern's
neckline in June was 15 points, measuring from the January low at 51 straight up
to the neckline
there mat 66. Prices broke out above the neckline at 70; so, if we add 15 to 70
we get $85.
This is the classic way technicans set minimum price objectives. See Edwards
and Magee,
Technical
Analysis of Stock Trends.

Probably, the price target is better set conservatively at 83-85. Either way, crude
oil
should rise, at a
minimum another 10% in the months ahead. The surpassing $80 will probably
spook the stock
market. So we should be careful. As crude oil goes up, inflationary numbers
start giving the
Fed more ammunition to raise interest rates. In truth, the Fed is less
concerned about
inflation, per
se, and more concerned with what level of interest rates it must set to get foreigners
to buy bonds
denominated in sagging US dollars. Friday the Euro and the British Pound made 5 year
highs
versus the
dollar. The Japanese yen moved back above its key 50-day mvg, avg,

There are probably many other relationships between crude oil prices and
and the stock market
than I can point out below. But one lesson is that the steep
rise in crude oil, from
$14/bar to $39/bar in a little more than a year after the Iranian
revolution in 1979 set
off inflation and much higher interest rates in the US. Steep runups
in crude oil prices
coincided with bear markets in 1973-1974 and 1990. Between 1979
and 1980 there were two
corrections (mini-crashes) of more than 10% in the DJI and
a full-fledged bear
market from early 1981 to July 1983. The bear market stemmed
directly from very high
interest rates, which were a result of the enormous rise in oil
and other commodities.
The reverse relationship has taken place between March 2003 and
July 2007: oil prices
and stock prices have risen together.
Different Seasonalities.
Whereas the stock market tends to be strongest from November to April, oil prices
tend to peak in
the summer when demand is greatest and when middle-Eastern wars tend
to happen.
Different Countries and Sectors Are Affected Differently.
Source:
http://www.gold-eagle.com/editorials_03/mauldin122203.html
- Asia tends to be more insulated from oil price shocks, than Europe, by a factor of
nearly 2-to-1, with Germany, Switzerland, Italy, Sweden, and the Netherlands being
more vulnerable ... against which Japan, Singapore, and Hong Kong are LESS
vulnerable, stock-market wise.
- The United States is the second MOST 'vulnerable', in terms of the potential negative
influence on the broader stock market, via rising oil prices ... second only to the
Netherlands.
Further, within the dynamic as influences the US stock market, we note the following
conclusions
reached by the report:
- Cyclical Services are MOST negatively influenced when oil prices rise.
- Cyclical Consumer Goods are second most negatively influenced.
- Financials ... third most negatively influenced stock market sector.

DJI - 1970-2006

-----------------------------------------------------------------------------------------------------------------------------
The price data graphed above are in nominal terms, i.e., they are in
"dollars-of-the-day" and have not been adjusted for inflation. Clicking the
picture above will enable you to access oil prices in real terms that are adjusted for inflation. Historical and forecast real
and nominal crude oil and gasoline price information is maintained on a more frequent
basis on the Short Term Energy Outlook Webpage .1. OPEC begins to assert power; raises tax rate & posted
prices
2. OPEC
begins nationalization process; raises prices in response to falling US dollar.
3. Negotiations
for gradual transfer of ownership of western assets in OPEC countries
4. Oil
embargo begins (October 19-20, 1973)
5. OPEC
freezes posted prices; US begins mandatory oil allocation
6. Oil
embargo ends (March 18, 1974)
7. Saudis
increase tax rates and royalties
8. US
crude oil entitlements program begins
9. OPEC
announces 15% revenue increase effective October 1, 1975
10. Official
Saudi Light price held constant for 1976
11. Iranian
oil production hits a 27-year low
12. OPEC
decides on 14.5% price increase for 1979
13. Iranian
revolution; Shah deposed
14. OPEC
raises prices 14.5% on April 1, 1979
15. US
phased price decontrol begins
16. OPEC
raises prices 15%
17. Iran
takes hostages; President Carter halts imports from Iran; Iran cancels US contracts;
Non-OPEC output hits 17.0 million b/d
18. Saudis
raise marker crude price from 19$/bbl to 26$/bbl
19. Windfall
Profits Tax enacted
20. Kuwait,
Iran, and Libya production cuts drop OPEC oil production to 27 million b/d
21. Saudi
Light raised to $28/bbl
22. Saudi
Light raised to $34/bbl
23. First
major fighting in Iran-Iraq War
24. President
Reagan abolishes remaining price and allocation controls
25. Spot
prices dominate official OPEC prices
26. US
boycotts Libyan crude; OPEC plans 18 million b/d output
27. Syria
cuts off Iraqi pipeline
28. Libya
initiates discounts; Non-OPEC output reaches 20 million b/d; OPEC output drops to 15
million b/d
29. OPEC
cuts prices by $5/bbl and agrees to 17.5 million b/d output – January 1983
30. Norway,
United Kingdom, and Nigeria cut prices
31. OPEC
accord cuts Saudi Light price to $28/bbl
32. OPEC
output falls to 13.7 million b/d
33. Saudis
link to spot price and begin to raise output – June 1985
34. OPEC
output reaches 18 million b/d
35. Wide
use of netback pricing
36. Wide
use of fixed prices
37. Wide
use of formula pricing
38. OPEC/Non-OPEC
meeting failure
39. OPEC
production accord; Fulmar/Brent production outages in the North Sea
40. Exxon's
Valdez tanker spills 11 million gallons of crude oil
41. OPEC
raises production ceiling to 19.5 million b/d – June 1989
43. Operation
Desert Storm begins; 17.3 million barrels of SPR crude oil sales is awarded
44. Persian
Gulf war ends
45. Dissolution
of Soviet Union; Last Kuwaiti oil fire is extinguished on November 6, 1991
46. UN
sanctions threatened against Libya
47. Saudi
Arabia agrees to support OPEC price increase
48. OPEC
production reaches 25.3 million b/d, the highest in over a decade
49. Kuwait
boosts production by 560,000 b/d in defiance of OPEC quota
50. Nigerian
oil workers' strike
51. Extremely
cold weather in the US and Europe
52. U.S.
launches cruise missile attacks into southern Iraq following an Iraqi-supported invasion
of Kurdish safe haven areas in northern Iraq.
53. Iraq
begins exporting oil under United Nations Security Council Resolution 986.
54. Prices
rise as Iraq's refusal to allow United Nations weapons inspectors into
"sensitive" sites raises tensions in the oil-rich Middle East.
55. OPEC
raises its production ceiling by 2.5 million barrels per day to 27.5 million barrels per
day. This is the first increase in 4 years.
56. World
oil supply increases by 2.25 million barrels per day in 1997, the largest annual increase
since 1988.
57. Oil
prices continue to plummet as increased production from Iraq coincides with no growth in
Asian oil demand due to the Asian economic crisis and increases in world oil inventories
following two unusually warm winters.
58. OPEC
pledges additional production cuts for the third time since March 1998. Total pledged cuts
amount to about 4.3 million barrels per day.
59. Oil
prices triple between January 1999 and September 2000 due to strong world oil demand, OPEC
oil production cutbacks, and other factors, including weather and low oil stock levels.
60. President
Clinton authorizes the release of 30 million barrels of oil from the Strategic Petroleum
Reserve (SPR) over 30 days to bolster oil supplies, particularly heating oil in the
Northeast.
61. Oil
prices fall due to weak world demand (largely as a result of economic recession in
the United States) and OPEC overproduction.
62. Oil
prices decline sharply following the September 11, 2001 terrorist attacks on the United
States, largely on increased fears of a sharper worldwide economic downturn (and therefore
sharply lower oil demand). Prices then increase on oil production cuts by OPEC and
non-OPEC at the beginning of 2002, plus unrest in the Middle East and the possibility of
renewed conflict with Iraq.
63. OPEC
oil production cuts, unrest in Venezuela, and rising tension in the Middle East contribute
to a significant increase in oil prices between January and June.
64. A
general strike in Venezuela, concern over a possible military conflict in Iraq, and cold
winter weather all contribute to a sharp decline in U.S. oil inventories and cause oil
prices to escalate further at the end of the year.
65. Continued
unrest in Venezuela and oil traders' anticipation of imminent military action in Iraq
causes prices to rise in January and February, 2003.
66. Military
action commences in Iraq on March 19, 2003. Iraqi oil fields are not destroyed as had been
feared. Prices fall.
67. OPEC
delegates agree to lower the cartel’s output ceiling by 1 million barrels per day, to
23.5 million barrels per day, effective April 2004.
68. OPEC
agrees to raise its crude oil production target by 500,000 barrels (2% of current OPEC
production) by August 1—in an effort to moderate high crude oil prices.
69. Hurricane
Ivan causes lasting damage to the energy infrastructure in the Gulf of Mexico and
interrupts oil and natural gas supplies to the United States. U.S. Secretary of Energy
Spencer Abraham agrees to release 1.7 million barrels of oil in the form of a loan from
the Strategic Petroleum Reserve.
70. Continuing
oil supply disruptions in Iraq and Nigeria, as well as strong energy demand, raise prices
during the first and second quarters of 2005.
71. Tropical
Storm Cindy and Hurricanes Dennis, Katrina, and Rita disrupt oil supply in the Gulf of
Mexico.
72. In
response to the hurricanes, the Department of Energy provides emergency loans of 9.8
million barrels and sold 11 million barrels of oil from the SPR.
73. Militant
attacks in Nigeria shut in more than 600,000 barrels per day of oil production beginning
in February 2006.
74. OPEC
members agree to cut the organization’s crude oil output by 1.2 million barrels per
day effective November 1, 2006. In December, the group agrees to cut output by a further
500,000 barrels per day effective February 2007.
Source: http://www.eia.doe.gov/emeu/cabs/AOMC/Overview.html
|
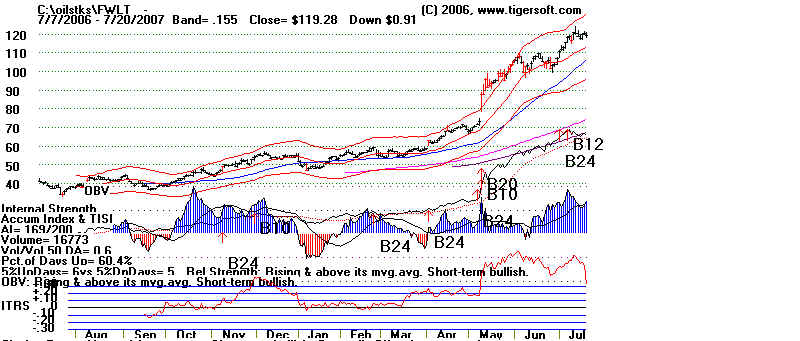
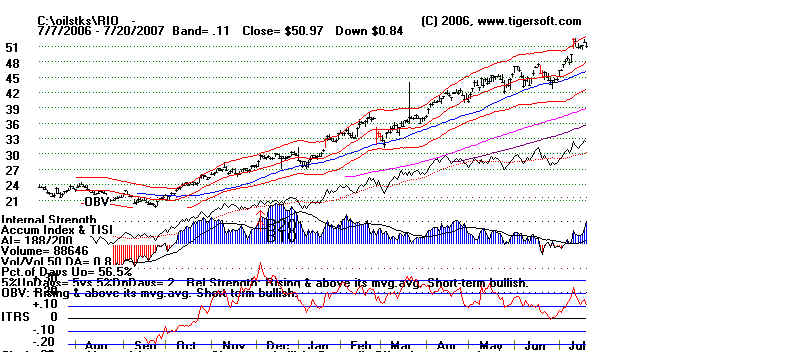
Spme Very Powerful Oil Stocks

.
|


 Cheney
pushes Bush to act on Iran


