The Government's Big Lie about The Rate of Inflation
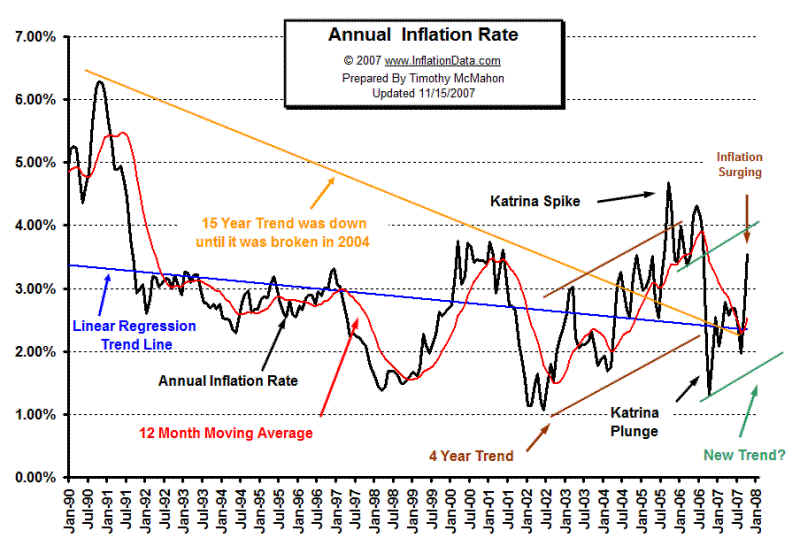
Inflation
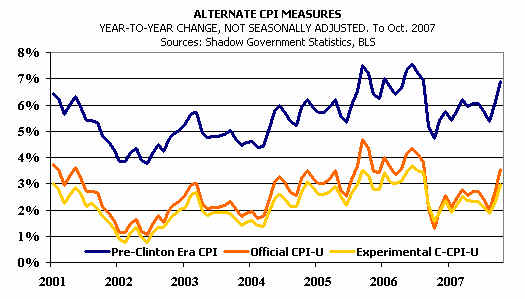
Is Now Running at 7% per year
The
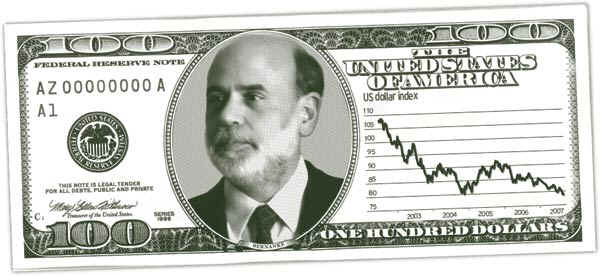
Dollar Is Falling at An Annualized Rate of 8.5%.
Who
Would Buy A Treasury Bond That Pays 4.25%
How
Much Money Is The Treasury Printing?
They
Won't Say. M3<1> Is No Longer reported!
All the heads on TV
talk about how important the "CPI" is as the FED deliberates
on whether to cut rates at their next
meeting, December 11th. But the truth is that the
published CPI rate of inflation is only
about one half the real rate, as we all experience it.
And if the Government really wanted to do
something about inflation, it would stop wasting
billions and billions in Bush's insane
effort to control events in Iraqi a half a world away
from the US.
The Bureau of Labor's
Consumer Price Index understates inflation to an amazingly
high degree/ This is easy to demonstrate.
You can go to their website and see how
any amount spent back, say, in 1953, would now
cost, if the CPI were, indeed, accurate.
http://www.minneapolisfed.org/research/data/us/calc/
For example, we know that back in 1950 the cost
of 100 regular mail stamps was $3.
Now it's $41.00. Using the CPI as a
predictor, we see from the calculator that the
the price of 100 regular stamps should be only
$25.68. When I went to college in the
Fall of 1958, tuition for a year was $2,000.
Now it is $34,530. If the CPI were a good
predictor, a year's tuition would only by
$14,277. When I first moved to San Diego
in 1980, a two bed room apartment cost $315 a
month. Now the same apartment is
$1795. If the CPI meant something, the
rent should only by $789, In 1969, I remember
buying gas for $.24/gallon. Twenty
gallons cost only $4.80. The CPI predicts the
present cost to be $26.98. At
$3.00/gallon now, 20 gallons actually costs $60.00.
Well, you get the idea. The CPI by its
own calculator vastly underestimates the real
rate of inflation. The BLS may say that
medical insurance costs have risen by only
50% over the last 10 years, but I defy you to
find anyone whose insurance policy
has not doubled or tripled!
The Post Office is not
supposed to be making a profit. So either it is concealing a
lot of money somewhere, or the Bureau of Labor
Statistics is not even remotely
accurate. It turns out that first class
postal rates go up at a rate that nearly matches
"M1" (money supply). It is very significant that the Federal Reserve no
longer reveals
or publishes M1. They are
deliberately concealing the real rate of inflation. If M1
is a better estimator of inflation than
the CPI, then since 1984 the real rate of inflation
is more like 5.3% than the 2.4% figures
that the official CPI suggests.

( http://www.autodogmatic.com/index.php/sst/2006/10/04/will_the_real_inflation_please_stand_up )
Why do we care? The
difference between the real rate of inflation and that which
the government is increasing. And the
wider it gets, the less various CPI cost of living
adjustments match reality. Social Security payments and costs would actually be
much
higher if the government were honest.
Retired people heavily dependent on social
security are being deliberately swindled and
impoverished. If the government were
honest, the political pressures to raise such
benefits would be much stronger. But that
would make the deficits even greater; it would
drop the Dollar even faster and interest rates
on government bonds would surely have to be
much higher. The US Treasury would
have no choice but to tax the rich heavily or
go bankrupt! Of course, if you don't care about
such retired people, you may want to applaud
that this computational sleight of hand is probably
saving the US Treasury $200 billion a year.
The truth is the outstanding public debt in the
US is more than $9,000,000,000,000, $9 trillion
dollars! This works out to almost $30,000 per
citizen. The debt rises by $1.4 billion a
day! Maybe, the governmnent should just tell its
citizens, "You don't want the truth
because you can't stand the truth.", as Jack Nicolson did
in "A Few Good Men".
I have shown that the CPI has
been under-estimating inflation for years. But at least
the techniques used were simple enough: a fixed basket of goods were priced at prevailing
market costs for each period, and the
period-to-period change in the cost of that market
basket represented the rate of inflation.
In 1996, influenced by
Greenspan and Michael
Boskin, chief economist for Bush I, the
underestimation process got much worse. Pres-
ident Clinton sought to show Wall Street that
he did not wish to rock the boat. To do this,
he agreed to reappoint Greenspan and he signed
into law basic revisions in the way the cost
of living was calculated. This helped
fuel the bull market from 1997 to 2000.
How
The CPI Is "Cooked"!
1.
Substitution - if the cost of beef rose substitute the price of chicken which
hadn't.
When
new car prices rose the BLS used car prices were substituted.
(
See http://www.bls.gov/cpi/cpifacuv.htm
) When real estate prices rose, more weight
is
given to the cost of renting which has not increased.
"The Boskin/Greenspan argument
was that when steak got too expensive, the consumer
would
substitute hamburger for the steak, and that the inflation measure should reflect the
costs
tied to buying hamburger versus steak, instead of steak versus steak. Of course,
replacing
hamburger for steak in the calculations would reduce the inflation rate, but it
represented
the rate of inflation in terms of maintaining a declining standard of living.
Cost
of living was being replaced by the cost of survival. The old system told you how
much
you had to increase your income in order to keep buying steak. The new system
promised
you hamburger, and then dog food, perhaps, after that. "
(
John Williams at www.shadowstats.com )
2.
Weighting - They went from an arithmetic weighting to a geometric
weighting. The
Boskin/Greenspan
benefit of a geometric weighting was that it automatically gave a lower
weighting
to CPI components that were rising in price, and a higher weighting to those items
dropping
in price.
3.
Hedonics - Example. A specialist at the BLS decided that when a new
27" TV
model
came out with new features and still sold for the same price of $329.99,
because
of the added value the TV was now worth $194 when entered into the BLS data,
despite
the fact that people had to pay $329.99. As new computers get more powerful,
their
cost is reduced in calculating the CPI, even though the consumer pays just as much.
If
the government requires a new additive to gasoline that costs 10 cents, the CPI
deducts
that cost.
These rules were designed to
dramatically lower the appearance of inflation. And they do
just that. The real
costs of housing, energy, food, medical bills, prescription drugs, tuition,
travel and entertainment rise
much faster than the government admits.
If
the CPI was calculated in the pre-1996 manner, the rate of inflation since then is 6%
not the 3% the government reports.
( Source: http://www.theleftcoaster.com/archives/004721.php )
The government is now being pushed
to resort to phrases like: "excluding volatile food and
energy".
( http://www.shadowstats.com/cgi-bin/sgs?
)
The
BLS current web page says that 2006 inflation is lower than it was in 2005.
How misleading!
(
http://www.bls.gov/opub/mlr/2007/05/art1abs.htm
)
|