 |
Daily Blog - Tiger Software Send any comments or questions |
| Trading Range Opportunities Most of the time, I admit, when I look at stock charts, I look for breakouts from trading ranges, because the stocks will often go up very sharply if we pick a stock with high Tiger Accumulation, rising OBV (aggressive buying), leading relative strength, gaps and high volume. 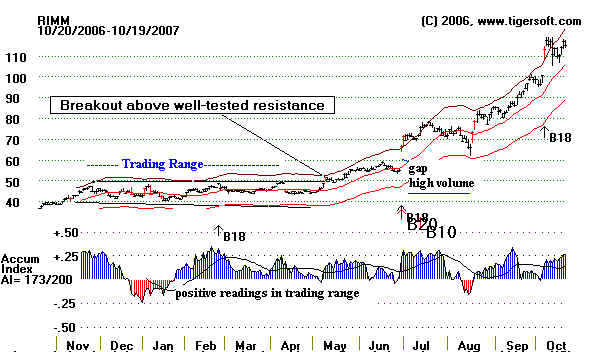 Many stocks are stuck in trading ranges for months. We can spot these because they bound back and forth between lines of support and resistance drawn through earlier tops. It takes some experience to trust these lines. One way to see the safest trading opportunities they present is to consider minor new lows near support that show an OBV Non-Confirmation (NC). The OBV Line does not make a corresponding low when compared to price. At the same time, minor new price highs near resistance that occur with the OBV Line not making a confirming minor new high are selling opportunities while the stock is locked in a trading range. I have marked these in the chart of FLEX. The horizontal lines are simple regression channel lines that TigerSoft makes it easy to display. 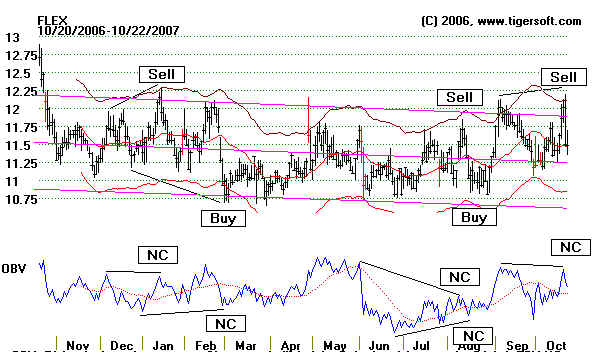 Finding stocks in trading is easy with TigerSoft. One way to do this is the stocks that work best with simple Stochastic Buys and Sells. This indicator causes a trader to buy on weakness and sell on strength. TigerSoft shows you stocks that may be traded in this way. We show you the best Stochastic system to trade the stock. And we show you when a New Buy or Sell is given. In the chart of EBAY, you can see that excellent red BUY and and Sell signals were given using a simple 20-day Stochastic. When our Peerless system gives a major Buy we tend to favor the Buy side and look for lists of these stocks. By the waym the TigerSoft automatic Buys and Sells would have gained you 78.2% if you had taken each of these signals to long or short the stock. 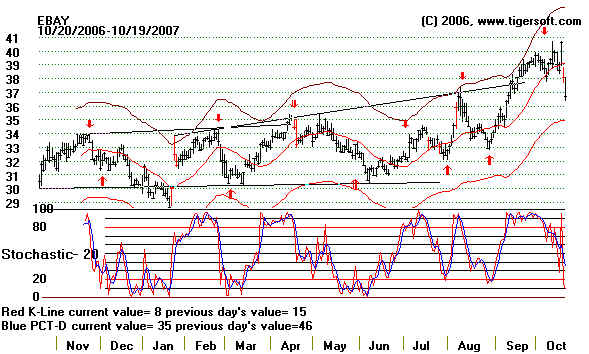 Sometimes, the best trading system is a 50-day Stochastic. See ERIC below. Here is another chart showing support and resistance. Note the internal support line at 36, In this case, the support and resistance lines are parallel. Note the recent breakdown below the well-tested support at 34. Breakouts and breakdowns past parallel and horizontal support ot resistance lines is more likely to be very significant. This is because the breakouts or breakdowns are unambiguous techcnically. Everyone interested in them sees the same thing. Even traders who might not be bearish the stock's fundamentals may agree that such a stock should be sold, simply because the expectation is that others WILL sell the stock. 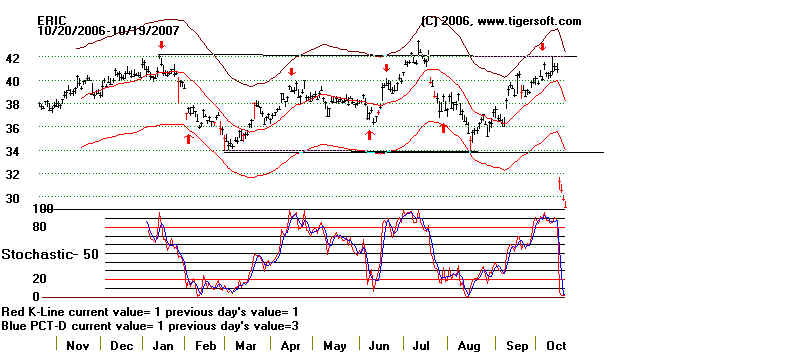 Bulges of positive Accumulation (as seen in July in the chart of EXPD below) usually make for reliable breakouts, But if our Peerless Stock Market Timing system has given a major Sell, a breakout late in the market's up-move is apt to fail and prices may pull back into the previous trading range, The bulge of Tiger Accumulation makes a successful test of the support line a very good buy. How can you know the test is successful? Rely on the fact that Peerless has shifted to a new Buy for the overall market. Use the crossing back above the 21-day mcg.avg. as a Buy. Tiger Users should also consider it a Buy here when the Accumulation Index goes back above its black moving average, The target then becomes the high closing on the previous rally. 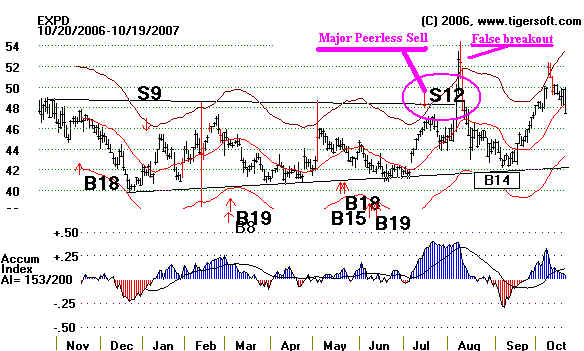 The FISV chart below shows resistance at 56 in May. When prices breakout above that level, 56 becomes support. ("Broken resistance becomes support on the next retreat." ) Although the Tiger Accumulation Index shows mounting red, negative Distribution, prices respect that support for a while - until July when Peerless gives a major market Sell. See how the next rally back up to that precise level stops the October rally. 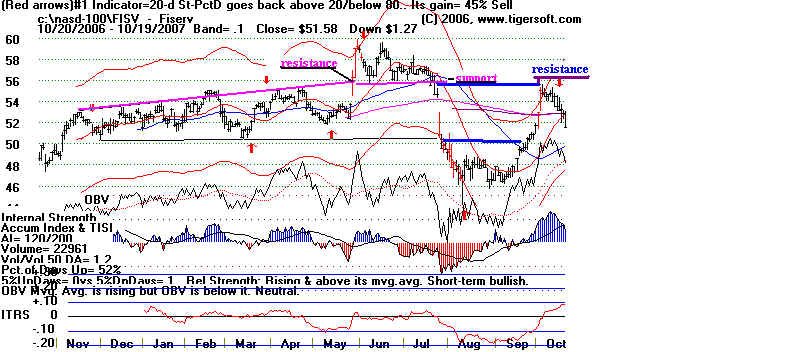
|
| . . . .
|