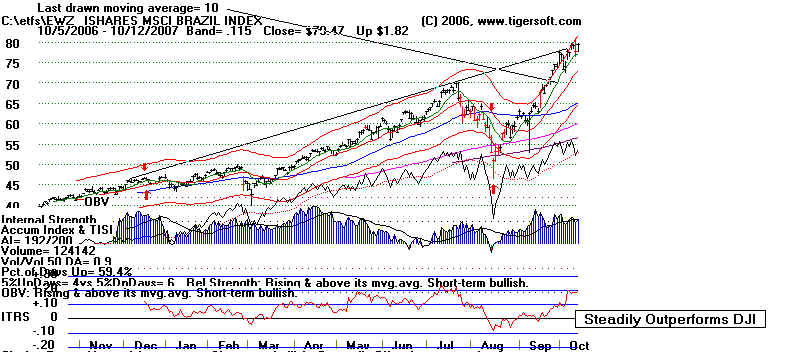
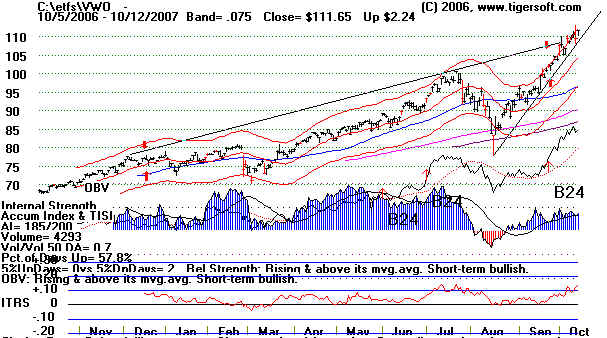
wpeC.jpg (33803 bytes)

   Daily Blog - Tiger Software

                   October 15, 2007

 
       WORLD BULL MARKET MAKES
            ANOTHER ALL TIME HIGH.

         How TigerSoft Users Play Them,


William Schmidt, - Tiger Software's Creator
      (C) 2007 William Schmidt, Ph. D.  - All Rights Reserved. 

      No reproductions of this blog or quoting from it
      without explicit written consent by its author is permitted.

     
Back to Home Page - www.tigersoft.com

__________________________________________________________________

     Send any comments or questions
      to william_schmidt@hotmail.com


                     wpe14.jpg (44841 bytes)

                Playing The World Bull Market This Late in The Boom


                  I wrote Peerless Stock Market Timing in 1981 based on a close study of data
             between 1970 anf 1981.  It has proven itself many times in many ways.  I have learned
             that powerful bull markets usually take quite a while to top out.  Multiple tops are
             needed.   Look back at the charts of 2000 for example.  Peerless gives multiple
             clusters of major Sells.  So we are vigilant and we think we know what to look for.
             Just keep in mind this is a global bull market.  It will not be stopped easily.  Oil
             prices might have to surpass $100/bar.  A big regional war would stop it.  American
             tariffs would probably stop it.  And so would an American credit collapse.  We will
             watch for these, toom and appreciate their financial significance.


                 There is a simple technical tool to use now to determine when to take profits that I am
            recommending to Hotline subscribers.  Drop me a line and I'll tell you what it is.
                                                 william_schmidt@hotmail.com

                   Not since March 2003, has the DJI closed down more than 10 from its highs.   That's
            a record 55 months.    This is the longest such sustained, uncorrected bull market since
            before 1915.
If we measure the duration of the bull market using the standard of a 15%
            correction,  then the current run is not so unprecedented.  The DJI went 84 consecutive
            months without a 15% correction between October 1990 and August 1998.   

                  Even a 10% correction, like we saw from the July high to the August 2007 trading low
            for the DJI, can bring a much bigger fall for many foreign markets.  Brazil (EWZ), Indonesia
            (IF) and Thailand (TF).   Most emerging markets' ETFs fell 20%.  The same was certainly true
            in the mid-2006 panic.   Fortunately, as you can see from the charts below and elsewhere our
           Peerless usually gives timely Sells and Buys on the DJI-30 that apply nicely to foreign ETFs.
            You can see below that the May S9 Sell from Peerless called the top perfectly before the
            Indian market's 40% collapsein 2006.


                                      Peerless Sell and BUY Signals on India in 2006

            wpe14.jpg (63897 bytes)
          

                              The current Tiger Index of all foreign ETFs, weighted for value of trading,
                     shows a powerful uptrend that has reached the top of its price channel.   The
                     Tiger Accumulation Index is now much stronger than it was for, say, India in
                     mid 2006.  The second chart below shows the Advance-Decline Line for these ETFs
                     is also making confirming new highs. 

          wpe12.jpg (53511 bytes)

                         When we examine the chart of the foreign ETFs we see a bullish inverted
                   head and shoulders pattern with a height of about 135 points (from neckline
                   to low.).  I project a minimum target of 750 or 760.  At the bottom, we see
                   there are 16 ETFs not making new highs and 39 that are.  Traders may want to
                   us the 10-day ma.  But I would rather use Peerless.  It is very likely it will give
                   another major Sell right at the top.  And we can sell then.


wpe13.jpg (58045 bytes)

                                         
                                      How To Pick The Right Foreign ETF Fund


                   Tiger's Power-Ranker gives you another advantage.  When you're more comfortable
              feeling you will get out at the top, you can trade more aggressively.  Below you can see the
              foreign ETFs ranked for performance for the last year and by "POWER", a Tiger measures
              it.   EWX and VWO stand out as especially strong when we consider relative strength plus
              lengthy and high Accumulation

 Top 10 Power Ranked                                              Bottom Ten Power Ranked

           Current AI                                                                     
EWZ     .27                                                               EWK
FXI        .22                                                               JDF
VWO     .18                                                               EWI
ILF         .32                                                               IEV
PGJ        .23                                                               TFC
KF         .18                                                                TF
TWN      .24                                                               EWL
EEM       .21                                                               EWJ
IXP         .12                                                               EWO
PWJ       .34                                                                EZA                                                     
 
Foreign Performance for the Last Year 
 10 / 13 / 2006 - 10 / 12 / 2007 
Rank          Symbol        Name                                      Price          Pct.Gain     % over 50dma  Accumulation   Open Up%      Close UP%
---------     -----------------------------------                     ----------    ------------  -----------   -------------- --------      ---------
 1            FXI           iShares FTSE/Xinhua China 25 Index Fund    202.2         140%          29.9%         180           59%           56%
 2            PGJ           PowerShares Gldn Dragon Halter USX China   35.78         108%          24.3%         181           67%           52%
 3            EWZ           ISHARES MSCI BRAZIL INDEX                  79.47         91%           22%           192           59%           58%
 4            JFC           JARDINE FLEMING CHINA REGION FUND          32.02         85%           18.9%         150           52%           56%
 5            GCH           GREATER CHINA FUND                         38            79%           9.1%          106           59%           52%
 6            GRR           ASIA TIGERS FUNDS                          29.97         73%           13.2%         138           51%           59%
 7            CHN           CHINA FUND                                 51.5          72%           12.7%         137           58%           57%
 8            ILF           ISHARES S&P LATIN AMERICA 40 INDEX         258.94        69%           18.2%         192           58%           60%
 9            EWS           ISHARES MSCI SINGAPORE INDEX               15.85         61%           14.3%         170           60%           43%
 10           VWO           Vanguard Emerging Markets Stock VIPERs     111.65        59%           15.5%         185           63%           49%
 11           SGF           SINGAPORE FUND                             19.96         58%           11.8%         144           56%           55%
 12           EEM           ISHARES MSCI EMERGING MARKETS INDEX        159.38        56%           15.5%         168           59%           56%
 13           EWM           ISHARES MSCI MALAYSIA (FREE) INDEX         12.42         55%           9%            155           59%           49%
 14           EWY           ISHARES MSCI SOUTH KOREA INDEX             72.05         55%           10.9%         127           57%           55%
 15           EPP           ISHARES MSCI PACIFIC EX-JAPAN INDEX        175.21        52%           15.3%         162           59%           58%
 16           EWA           ISHARES MSCI AUSTRALIA INDEX               33.48         52%           15.4%         148           60%           51%
 17           EWH           ISHARES MSCI HONG KONG INDEX               22.12         51%           15.3%         134           56%           48%
 18           EZA           ISHARES MSCI SOUTH AFRICA INDEX            143.82        47%           13.7%         126           57%           55%
 19           EWG           ISHARES MSCI GERMANY INDEX                 35.37         44%           8.1%          157           57%           56%
 20           IF            INDONESIA FUND                             13.56         43%           12.2%         152           52%           45%
 21           EWC           ISHARES MSCI CANADA INDEX                  34.01         42%           10.4%         113           57%           51%
 22           TF            THAI CAPITAL FUND                          15            42%           11.3%         105           50%           50%
 23           KEF           KOREA EQUITY FUND                          14.52         41%           9.4%          149           54%           56%
 24           EWW           ISHARES MSCI MEXICO (FREE) INDEX           63.66         38%           9.7%          142           62%           47%
 25           EWD           ISHARES MSCI SWEDEN INDEX                  38.44         35%           8.9%          138           55%           56%
 26           IXP           ISHARES S&P GLOBAL TELECOMM SECT           80.04         35%           8.9%          167           56%           59%
 27           TFC           ---                                         7.95         35%           8.3%          99            54%           46%
 28           TWN           TAIWAN FUND                                23.11         35%           8.2%          187           48%           55%
 29           PWJ           PaineWebber Group                          24.68         32%           7%            159           56%           56%
 30           EWN           ISHARES MSCI NETHERLANDS INDEX             32.93         30%           8.1%          144           56%           56%
 31           KF            KOREA FUND                                 48.17         30%           13.2%         178           50%           55%
 32           EWP           ISHARES MSCI SPAIN INDEX                   63.12         29%           7.5%          136           52%           56%
 33           EWT           ISHARES MSCI TAIWAN INDEX                  17.24         29%           6.9%          155           55%           54%
 34           EZU           ISHARES MSCI EMU INDEX                     123.76        29%           7.1%          125           55%           54%
 35           CEE           CENTRAL EUROPEAN EQUITY FUND               61.13         26%           14.3%         145           55%           57%
 36           FEZ           FRESCO DOW JONES EURO STOXX 50             63.1          26%           6.3%          151           54%           57%
 37           IFN           INDIA FUND                                 57.48         25%           18%           149           52%           51%
 38           IEV           ISHARES S&P EUROPE 350 INDEX FUND          122.34        24%           6.9%          112           56%           57%
 39           MXF           MEXICO FUND                                45.18         24%           8.6%          151           55%           56%
 40           VGK           Vanguard European Stock VIPERs             80.1          24%           7%            135           59%           52%
 41           EWQ           IShares MSCI France                        39.19         23%           6.7%          140           54%           56%
 42           EWO           ISHARES MSCI AUSTRIA INDEX                 39.6          22%           6.3%          149           57%           50%
 43           IXN           ISHARES S&P GLOBAL TECHNOLOGY SECT         68.73         20%           6.2%          132           55%           53%
 44           EKH           HOLDRS EUROPE 2001                         90.42         18%           6.9%          131           56%           48%
 45           EWU           ISHARES MSCI UK INDEX                      26.69         18%           7.2%          147           52%           56%
 46           EWL           ISHARES MSCI SWITZERLAND INDEX             27.35         17%           5.1%          141           52%           50%
 47           VPL           Vanguard Pacific Stock VIPERs              74.75         17%           7.4%          181           54%           52%
 48           EWI           ISHARES MSCI ITALY INDEX                   35.79         15%           5.5%          130           53%           53%
 49           EWK           ISHARES MSCI BELGIUM INDEX                 28.02         15%           7.7%          88            48%           58%
 50           IIF           MORGAN STANLEY INDIA INVESTMENT FUND       55.48         14%           18.4%         160           54%           56%
 51           MF            MALAYSIA FUND                              30.95         12%           14.3%         40            11%           89%
 52           EWJ           ISHARES MSCI JAPAN INDEX                   14.54         6%            4%            156           47%           52%
 53           ITF           ISHARES S&P-TOPIX 150 INDEX FUND           127.8         5%            4%            170           50%           52%
 54           TRF           TEMPLETON RUSSIA FUND                      70.98         1%            10.4%         122           52%           52%
 55           JOF           JAPAN OTC EQUITY FUND                      11.06        -11%           5.9%          120           41%           52%


     Very High Accumulation  - EWZ and VWO 

     wpe15.jpg (65664 bytes)

     wpe14.jpg (59432 bytes)     
             

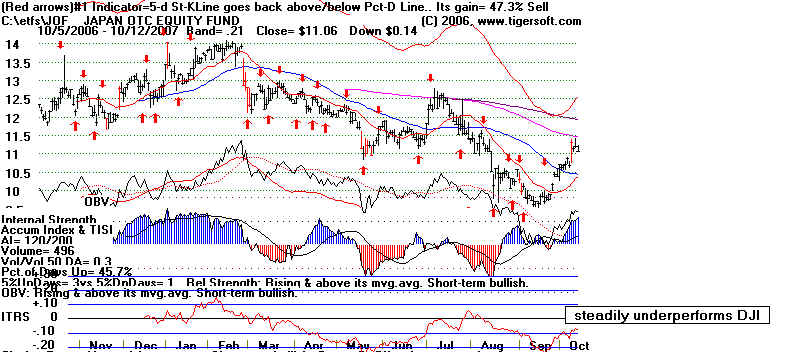
     Very Low Accumulation - JOF   
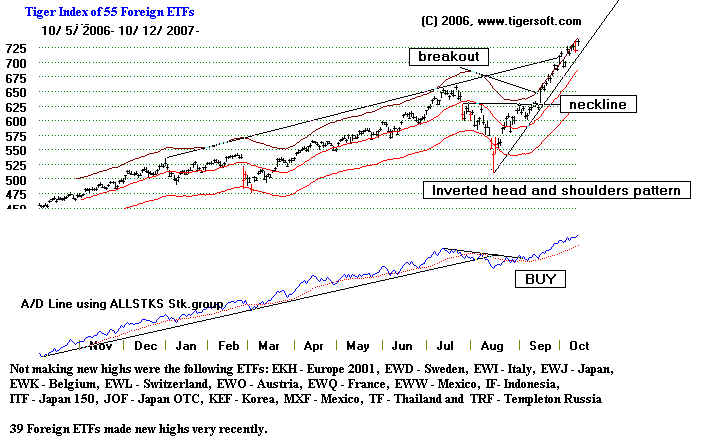
Use the chart below for purposes of comparison.

   wpe16.jpg (67632 bytes)                                             

 
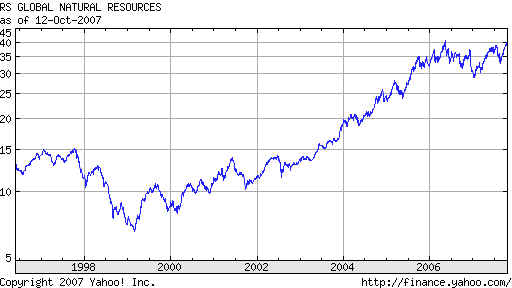
                           Buy Natural Resource Stocks

          
Perhaps, a billion souls in India, China, Brazil, Thailand, nearly everywhere in the developing
         countries are now aspiring for what Americans have taken for granted for decades: namely,
         a house with indoor plumbing, central heating, a garage with a car or two cars in it, a color
         TV, golf clubs in the closet ...   
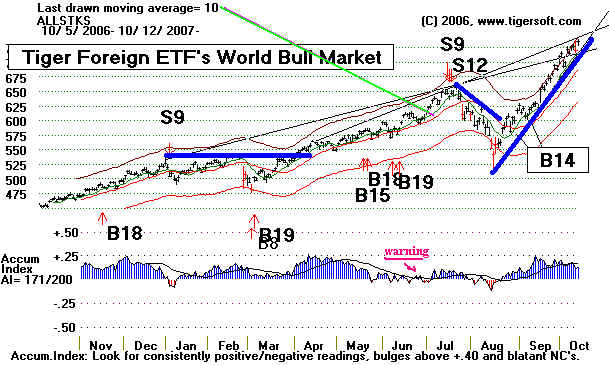
That demand is fueling the world bull market.  It is also making
         natural resources rise.  Look at a mutual fund that is known for playing this trend.  It is close to
         making another new high.  That should release it for a good advance.

              
wpe12.jpg (21302 bytes)
    Here are the 10 biggest holdings of RSNRX:

ALLEGHENY TECH NEW ATI 5.41 21.70
DENBURY RES INC (HLD DNR 5.27 60.81
TALISMAN ENERGY INC TLM 5.27 16.41
Key Energy Services, Inc. N/A 4.97 8.63
PEABODY ENERGY CORP BTU 4.00 18.93
CENTURY ALUMINUM C CENX 3.62 17.92
COMPANHIA VALE ADS RIO 3.37 130.03
PPL CORP PPL 3.10 31.96
SPECTRA ENERGY SE 3.05 -9.42
BROOKFIELD ASSET MGT BAM 3.01 21.04


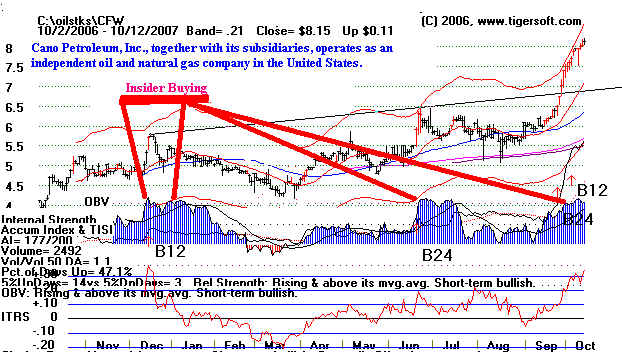
                                  Tiger's Power-Ranker excels at finding the best stocks in a particular industry
                       to invest in.  And we provide the data by industry groups like this.  Here are some of the best
                       oil and gas stocks now, based on a combination of relative strength and high Tiger Accumulation
                       Index strength.   You can invest in low priced stocks that come alive late in a move and
                       rocket upwards, as they belatedly play catchup.  CFW look like such a stock.

                       wpe13.jpg (66307 bytes)


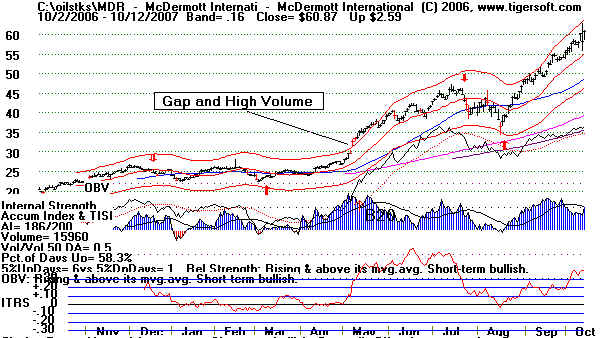
                                             The easiest way to make money in this market has been to buy the most
                        "bullish" stocks as Tiger ranks them.  Relative Strength and high Accumulation place the two
                         stocks below way up in the highest percentile power rankings.  When 200 or 300 stocks
                         are screened, this is significant.  We cater to individuals who see that we can put them
                         in a position to compete with institutions that have very fine fundamental research. 

                                                           MDR - Superb OIL STOCK #1

                      wpe14.jpg (59396 bytes)

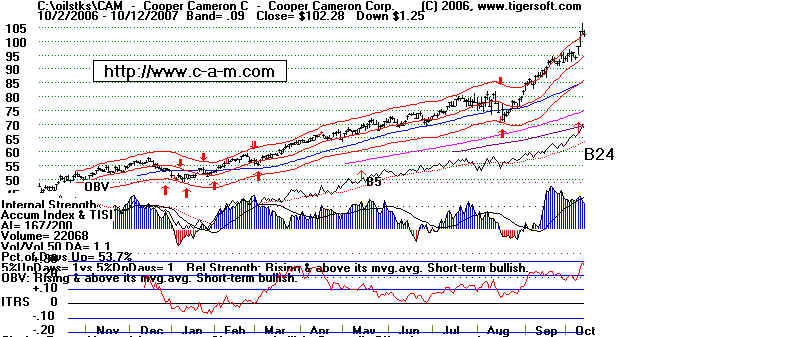
                                                                       CAM - Superb OIL STOCK #2
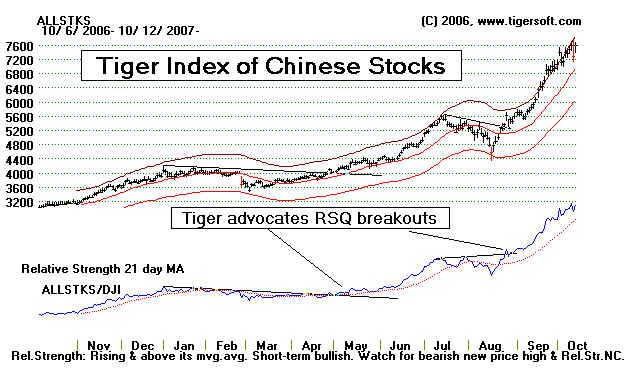
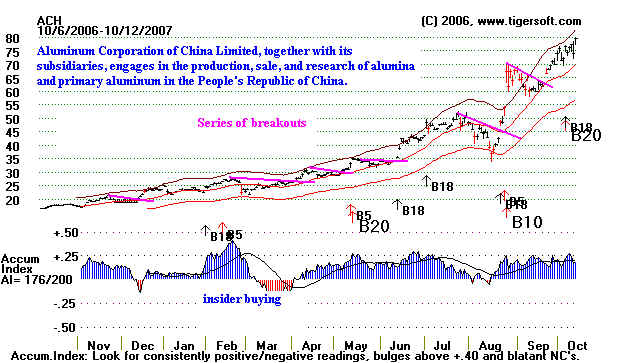
                      wpe15.jpg (64513 bytes)

                                                              "Chinese Red Chips"

                                         Aluminum is essential for a growing economy.  A strong stock in a strong sector in
                                  China's   booming economu brings great stock price gains.  Each time the stock
                                  hesitates and then breaks out, it quickly advances.  ACH is the Chinese Alcoa,
                                  which is a Dow Jones blue chip.

                        wpe12.jpg (51143 bytes)  

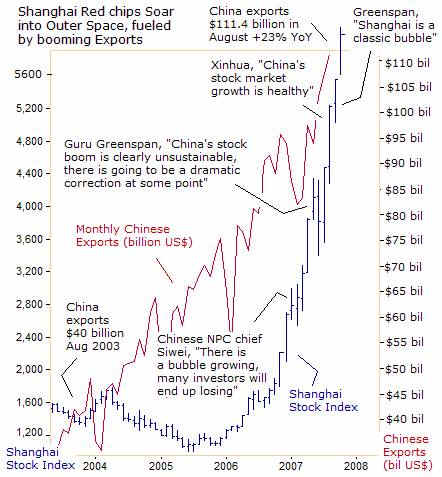
                                                         Is China A Speculative Bubble?

                                           The Communist Party could try to prevent a bigger rise for fear that
                                    the millionaires it creates will challenge its authority.  This is often heard.
                                    But the Chinese want to look good when the Olympics come in two years.

                                            
wpe13.jpg (34733 bytes)

                                            I recommend reading this article: http://news.goldseek.com/GoldSeek/1192118154.php

Hit Counter