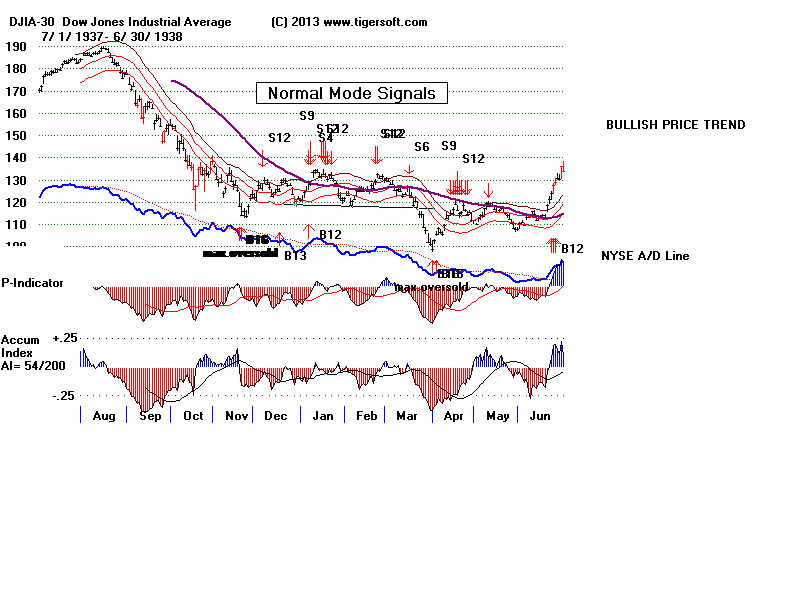
DJI's daily highs and lows. With this data, Peerless charts, indicators and
automatic Buy and Sell signals become possible, though it was necessary
to hand tabulate the number of NYSE stocks up and down each day.


DJI Charts and Peerless Signals: 1929-2013
(C) 2013 Wm. Schmidt, Ph.D.
-----------------------------------------------------------------------
| 1928-1929 In October 1928, the Wall
Street Journal started reporting the DJI's daily highs and lows. With this data, Peerless charts, indicators and automatic Buy and Sell signals become possible, though it was necessary to hand tabulate the number of NYSE stocks up and down each day. 

|
| 1929 The 1929 Crash was the logical result of extreme bearish divergences. Peerless Sell S9s and Sell S12s are how Peerless calls tops at the upper band when the P-Indicator and Accumulation are negative. A head/shoulders pattern marked the top, just as it often does. The declined knifed right through the earlier well-tested 290-300 support that held 4 times from January to June.   |
| 1929 The DJI fell 48% in only 3 months. The Buy B16s simply marks the most oversold condition the market has ever been in. If such a condition ever occurs again, it would bring a Peerless Buy signal. Covering short sales when the NYSE A/D Line broke its downtrend is a historiucally tested and acceptable approach, as this book shows. Shorting again on the next Peerless Sells usually is profitable. But in case there is no timely Peerless Buy signal, cover when the DJI surpasses ifs 65-dma with the key values showing such very positive readings as they did on 1/24/1930: P^^= +474. IP21 = +.136 and OPct= +.337 Note also how the judged B28 should have been taken because of the price breakout past well-tested resistance. The recovery-rally stopped in April just short of a falling 200-day ma. Had the DJI surpassed it, Peerless would have switched back to its Normal Mode. The DJI at that point had recovered slightly more than 50% of what it had lost in the collapse between September and November 1929. Such 50% percentage retracements are common. Also marking the April top was another bearish head adnb shoulders pattern.   |
| 1930 In the Summer of 1930, the DJI completed a classic head/shoulders top. There were many Peerless Sells. The Extreme Bearish Peerless Mode remained operationa. The height of a head/shoulders top often allows a trader to calculate how far down prices will fall below the neckline's support. The pattern here was about 40 points high. So, when the DJI broke the support at 260, one could calculate a minimum downside objective of 220. I would suggest also using a break in the NYSE A/D Line's downtrend to cover shorts. New Peerless signals on strength gave new points to sell short. The Sell S13 in September showed that there would probably be a steep sell-off in October, a month that often produces the worst sell-offs.   |
EB Mode
S7 S12  |
| 1931 Extreme Bear Market Mode continues. Buying because
prices look cheap has caused many, many investors to lose their life's savings. Simply trading with the trend of the NYSE A/D line and following the direction it points in an Extreme Bear market is all that was needed. These charts, of course, were never published in those days.   |
1931-1932  |
1932  |
  |
Why no November Buy at LB?  |
  |
  |
  |
  |

|
  |
  |
  |
  |
  |
  |
  |
  |
   |
  |
  |
  |
  |
  |
Tiger signals can be added to Peerless signals.  |
  |
Note June high (red) volume breakout with
bullish.   |
  |
  |
  |
  |
  |
  |
  |
  |
  |
  |
  |
  |
  |
  |
  |
  |
 |
 |
 |
 |
 |
 |
 |
 |
 |
 |
 |
 |
 |
 |
 |
 |
 |
 |
 |
 |
Note the inverted head/shoulders bottom.  |
 |
 |
 |
 |
 |
 |
 |
 |
 |
 |
 |
 |
 |
 |
 |
 |
 |
 |
 |
 |
 |
 |
 |
 |
 |