(C) 2018 tigersoft.com William Schmidt, Ph.D.
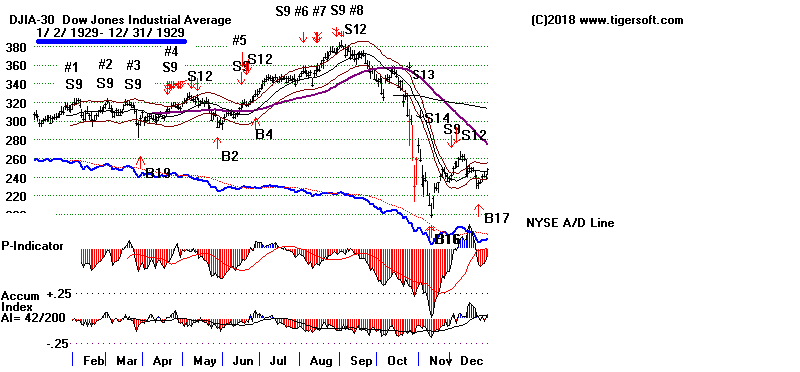
1929 has many Peerless Sell S9s. The first set of four S9s (#1-#4) drops the DJI to the
lower band. The next set of four (#5-#8) starts the deepest Crash is market history.
The NYSE ADL was bearishly diverging the entire year. We do not have data for the
NYSE Up and Down volume until 1965, so no V-Indicator can not be used.
1972-1973 - Four S9s start 1973-1974 bear market. All four Sell S9s showed bearish P-I
and V-I negative non-confirmations. So, the S9s here were S9Vs in additon to be being
regular S9s. The A/D Line was in a steady decline for the entire period, though it did
briefly turn up for the traditional partisan Presidential Election rally.
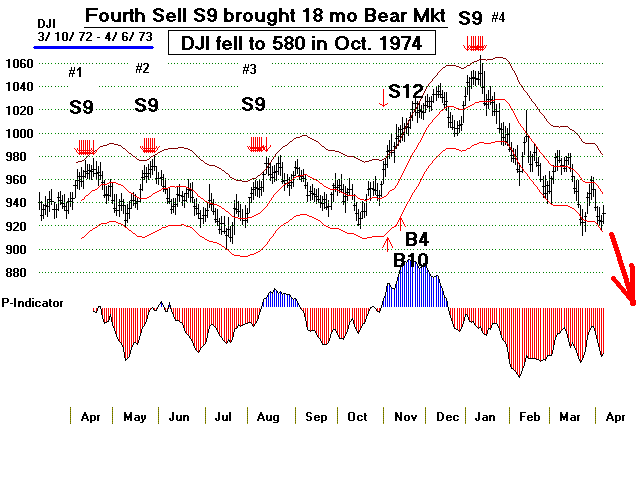
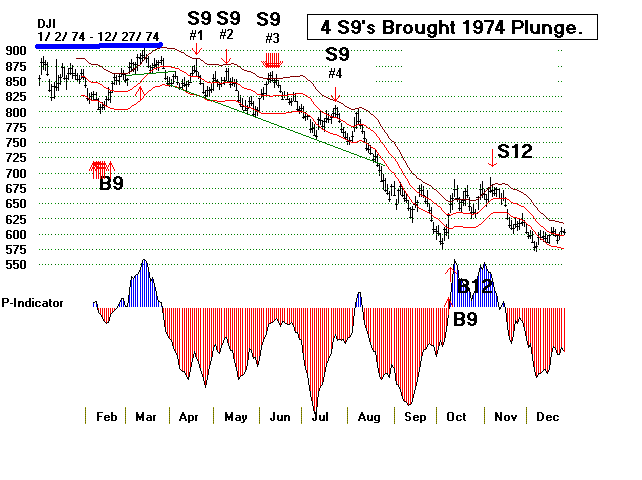
1973-1974 - Four S9s start 1974 Selling Climax.
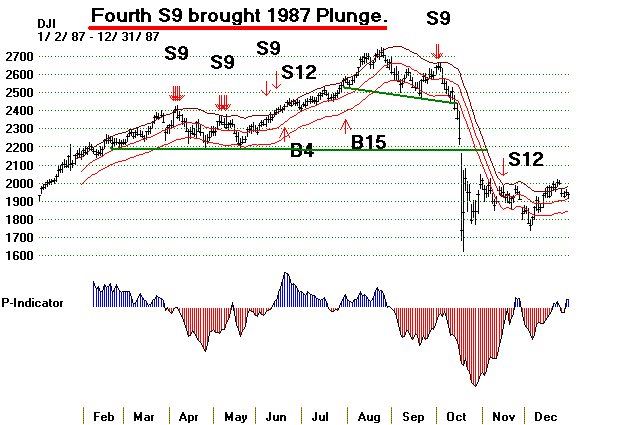
1987 - Four S9s start Crash of October 1987. The NYSE A/D Line had been trending down after
March. The V-I gave negative non-confirmations on the last three Sell S9s.
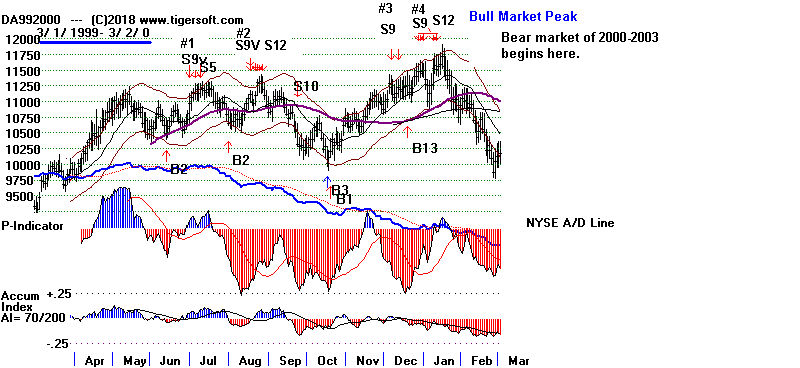
1999-2000 - Four S9s start 2000-2003 bear market. A/D had been bearishly diverging since the
end of 1998. All four S9s showed V-I negative non-confirmations. Not shown were three more S9V
which occurred in July 2000 (10812.75), August 2000 (11027.8) and February 2001 (10965.85).
While the NASDAQ then collapsed, the DJI made one more rally and finally peaked in May 2001
at 10965.85.
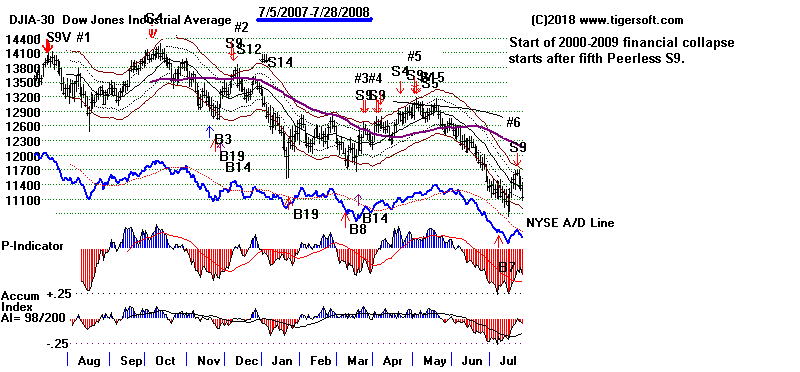
2007-2008 - Multiple S9s start 2008-2009 financial collapse. The A/D Line bearishly diverged
from all new highs after June 2007. In each case the V-I was negative on all rallies to the upper
band, including the one in September, except at the October 2007 peak.