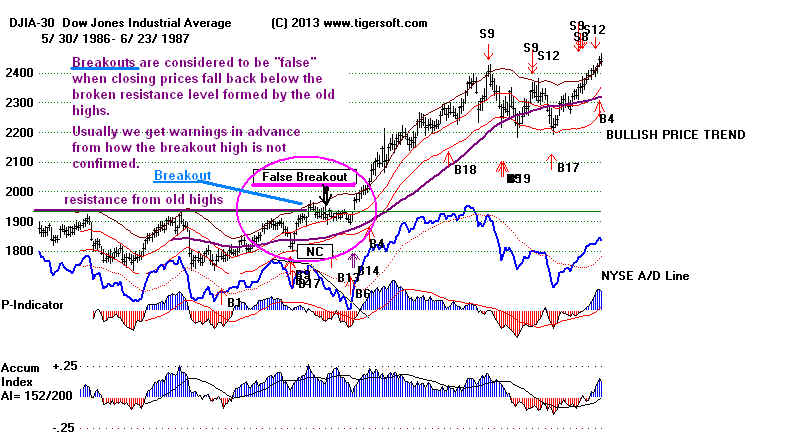
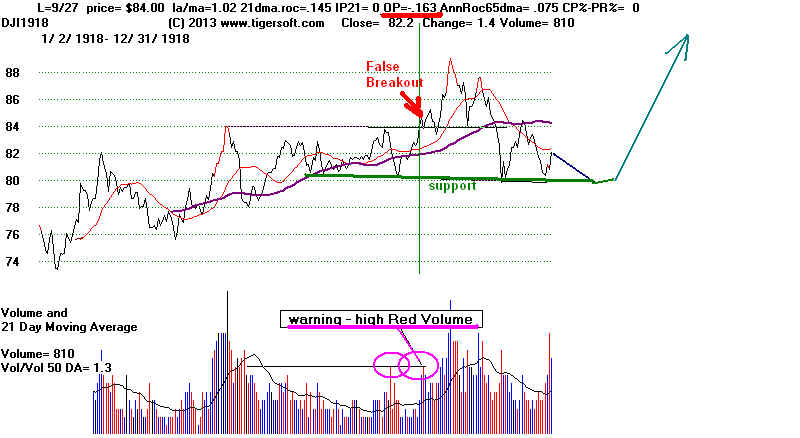
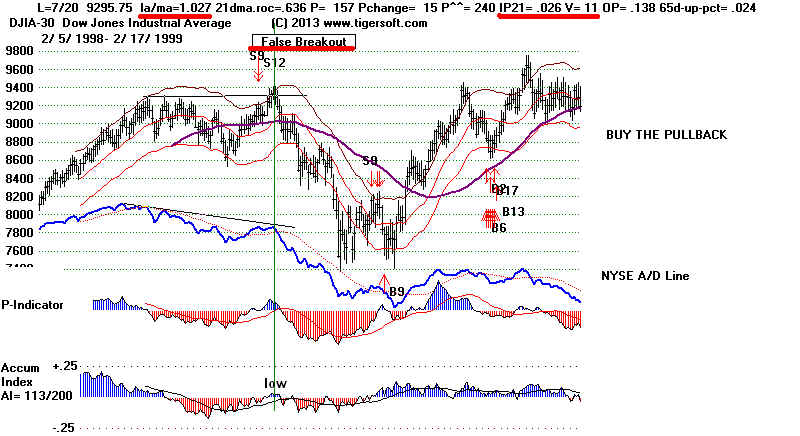
Here we consider breakouts that fail. Breakouts are considered "false"
when prices fall below the resistance level formed by a set of previous
highs. Peerless users should use the "theoretical highs" to draw
the resistance line, not the "intra-day trading highs".
Usually we get warnings on the breakouts. The absence of a Buy B10
sometimes works this way. At other times, the DJI breaks out alone.
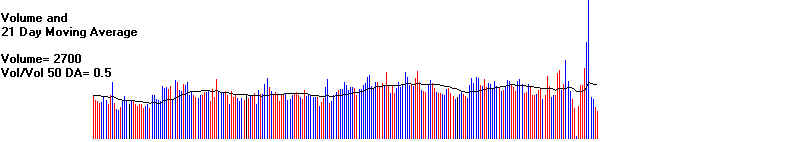
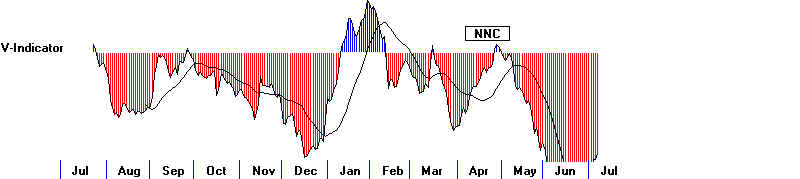
The other indexes fail to make a decisive high. The NASDAQ's failure
to make a corresponding new high was such a warning in 1986 and in
2014. New Peerless Sell signals that follow the breakouts are to be
trusted. The Peerless Sell signals do take into account B10s. Watch
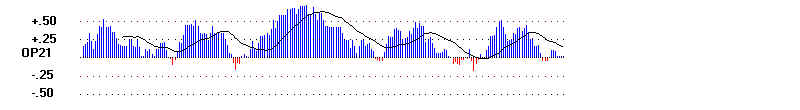
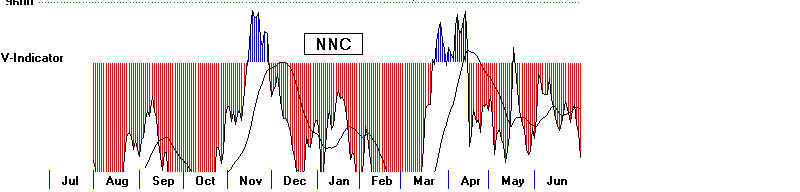
also for low readings by the IP21 and V-Indicator to get a warning
that a flat-topped trading range breakout may fail.
False Breakouts Warnings Subsequent Action
-----------------------------------------------------------------------------------------------------------
July 1929 S9, S12 A/D Line NC, P<0, VI<0 10% decline
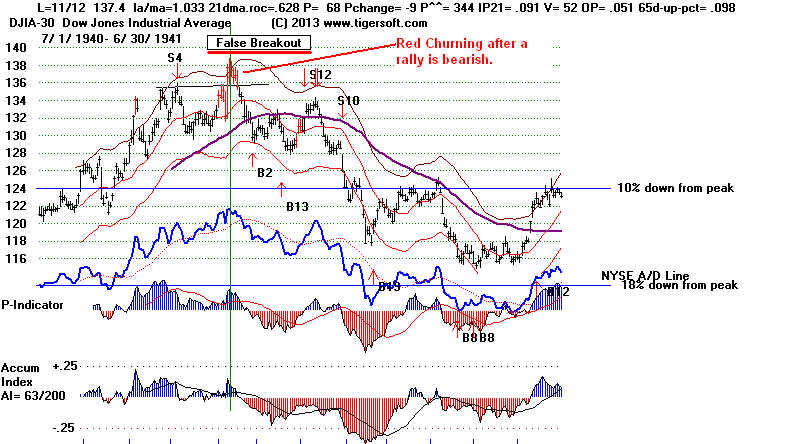
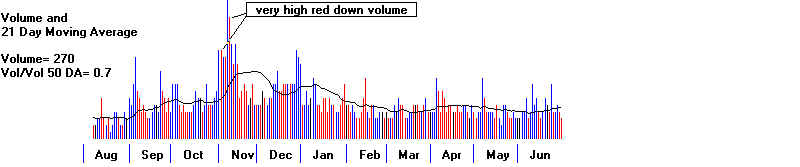
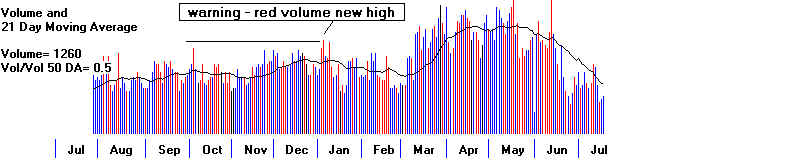
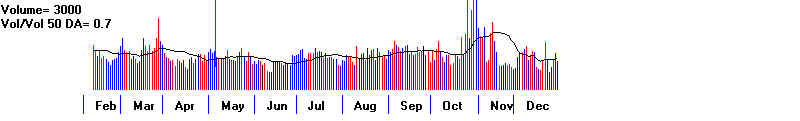
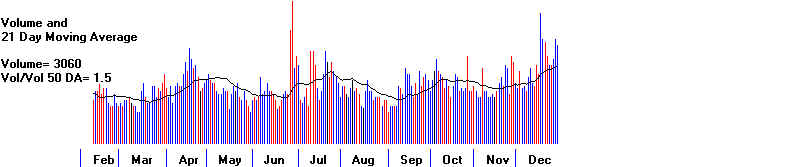
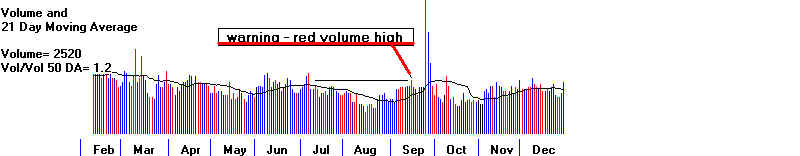
November 1940 earlier S4 very high red volume Bear Market follows
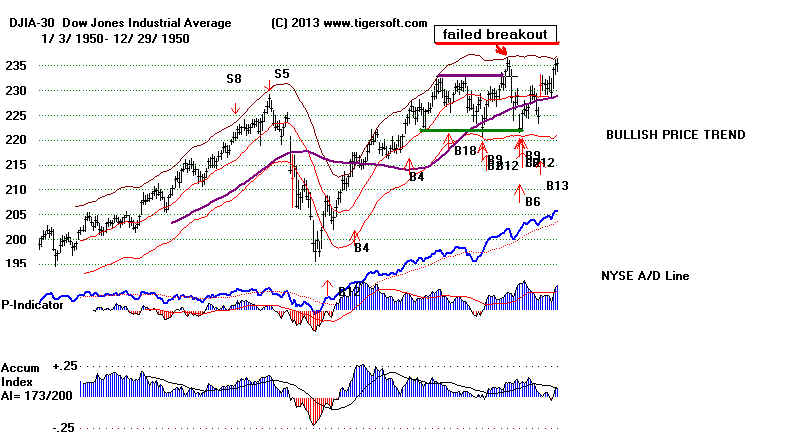
November 1950 6% decline
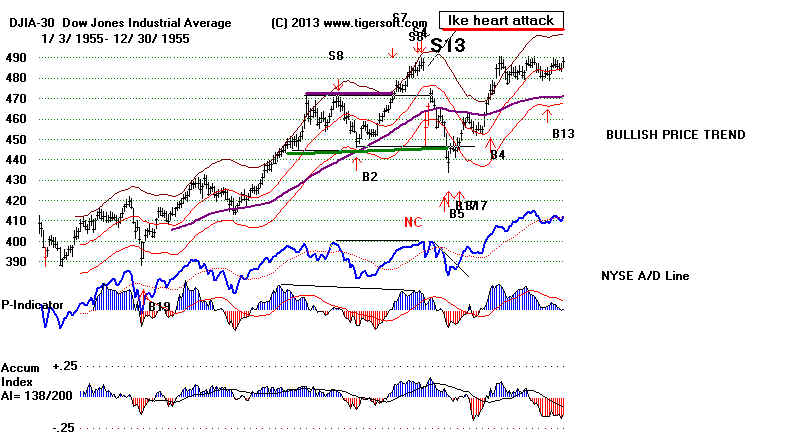
September 1955 S7, S8, S4, A/D Line NC, VI<0 10% decline
very high red volume warning
April 1965 S7, IP21<0, VI<0 on breakout 11% decline
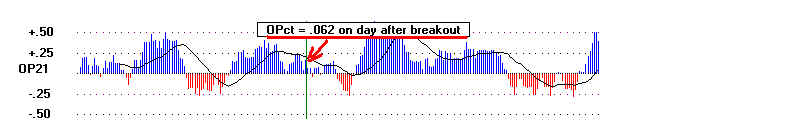
December 1986 A/D Line NC, IP21<0, VI<0 on breakout 3% decline
July 1998 S9, S12 A/D Line 19% decline
December 1999 S9, S12 A/D Line NC, P<0, VI<0 17% decline
? November 14, 2013 A/D Line. VI<0
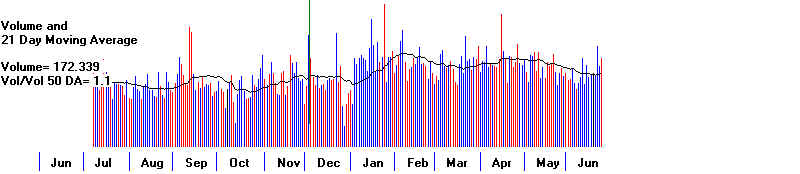
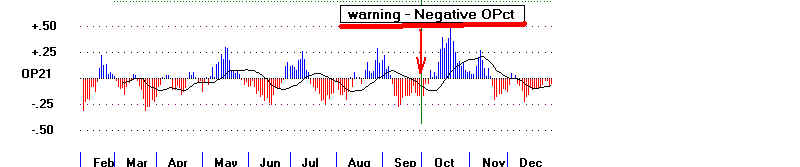
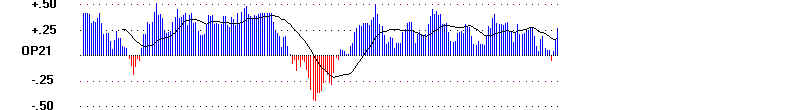
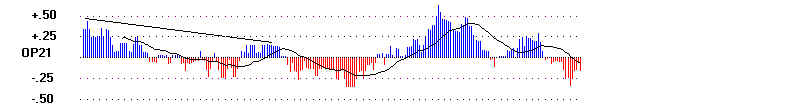
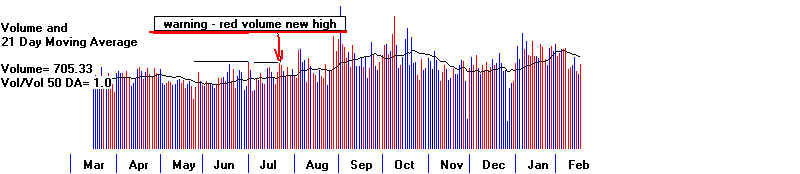
Primarily, we see low readings on false breakouts to new highs for the
P-Indicator, A/D Line, IP21, V-Indicator, OPct. and red volume new highs.
The bigger and more numerous the non-confirmations from these indicaators,
the deeper the decline is apt to be, though the July 1929 case shows
the decline may be postponed while the market makes one more good-sized
advance.
How deep the decline will be on a false breakout also depends on seasonality,
and how long the bull market had already lasted. Octobers rarely produce
valid Buy B10s; yet they bring "false breakouts": 10/1/1918, 10/4/1940.
"False Breakouts" can be classified by the depth of the subsequent decline.
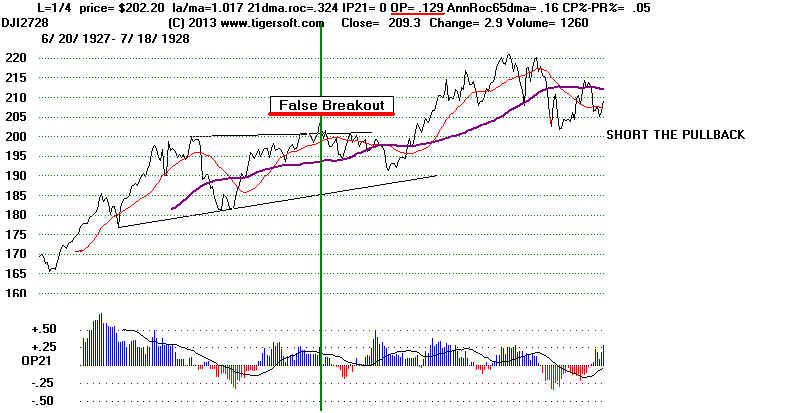
1) DJI falls back below the point of breakout and then after a month's
pullback to the mid-point of the previous trading range, resume its uptrend.
Examples: December 1986, December 1927
2) DJI falls back to the low-point, the support, of the previous trading range,
after which is resumes its uptrend.
Examples: July 1929, October 1918, November 1950, September 1955
3) DJI breaks far below the low-point, the support, of the previous trading range
and falls much further.
Examples: July 1998 April 1965 January 2000 November 1940
previous trading range.
Example December 1986
previous trading range.
Example December 1927
Example: July 1918
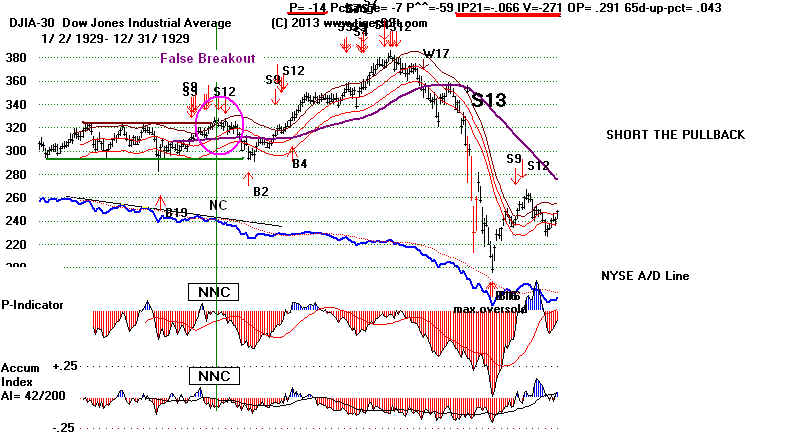
Example: September 1929
Example: November 1950
Example: September 1955
DJI breaks far below the low-point, the support, of the previous trading range
and falls much further.
Example: July 1998
DJI breaks far below the low-point, the support, of the previous trading range
and falls much further.
Example: April 1965
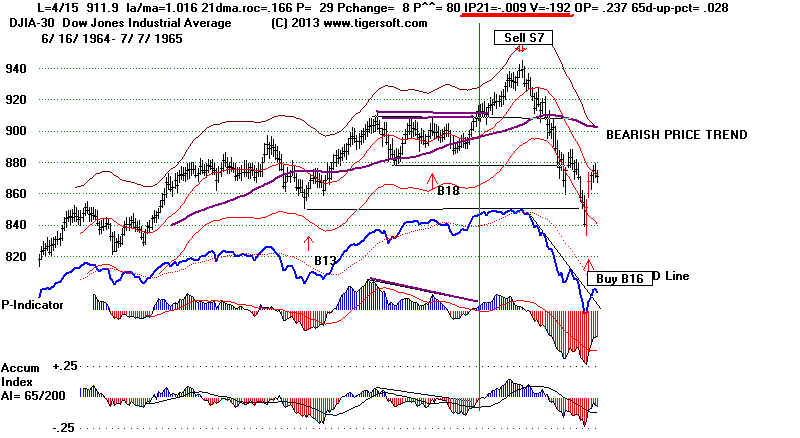
DJI breaks far below the low-point, the support, of the previous trading range
and falls much further.
Example: January 2000
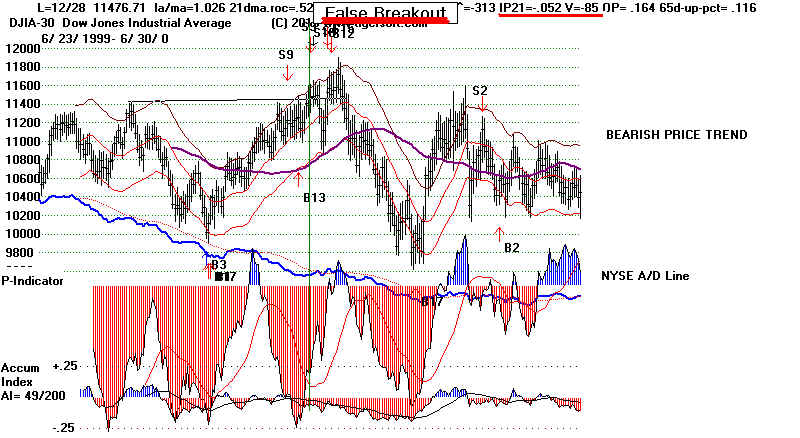
DJI breaks far below the low-point, the support, of the previous trading range
and falls much further.
Example: November 1940