1991 Head/Shoulders in SP-500 Stocks (now)

   
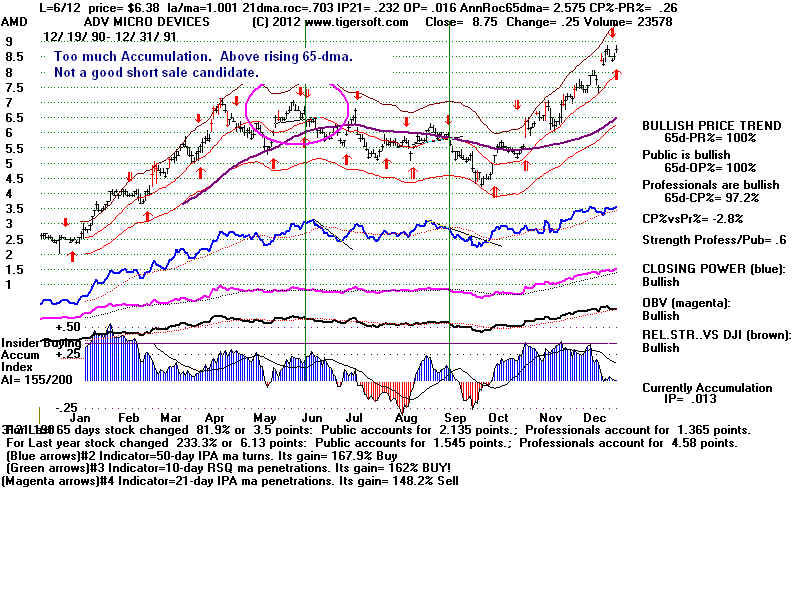
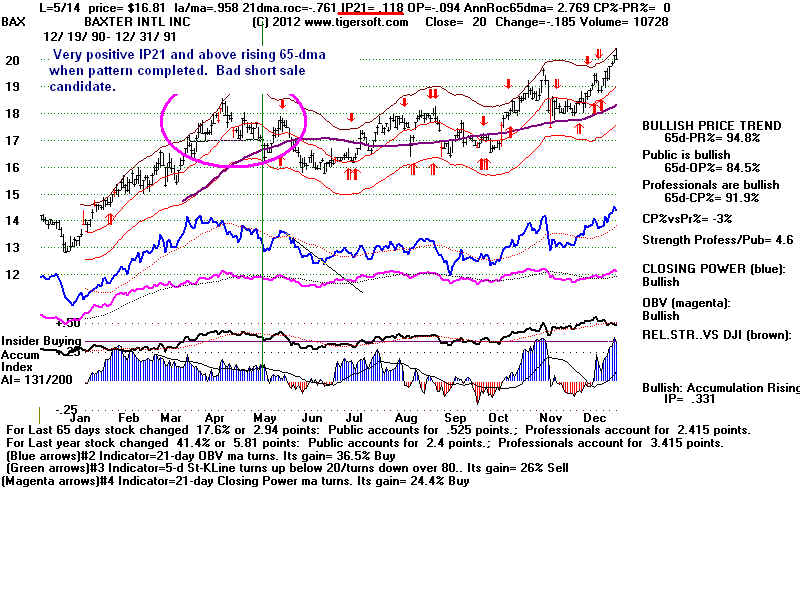
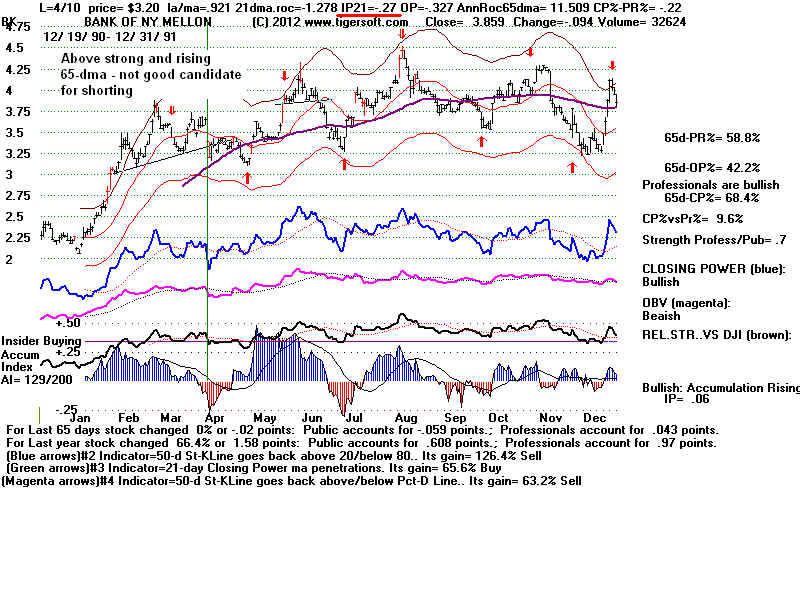
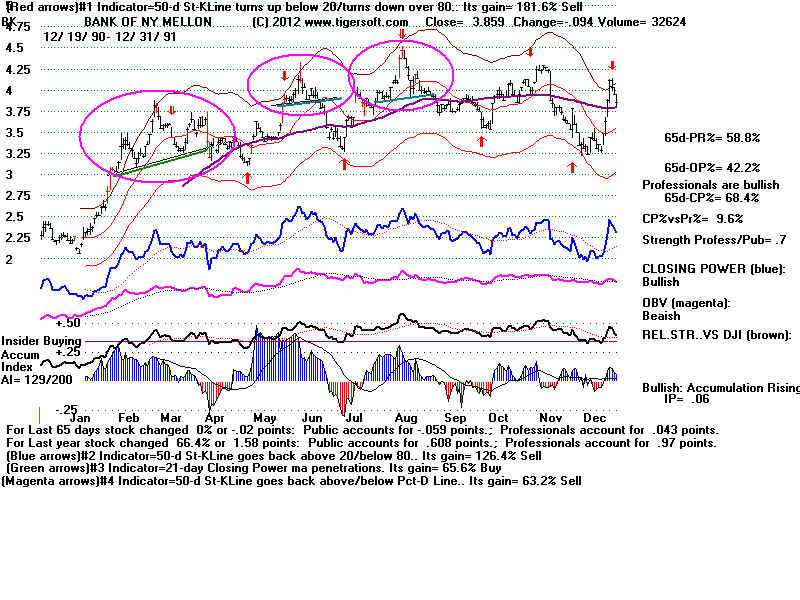
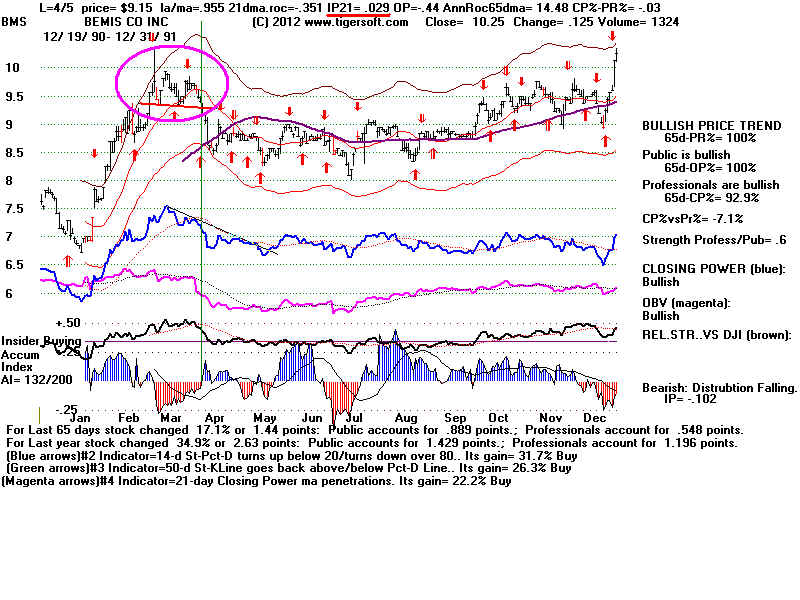
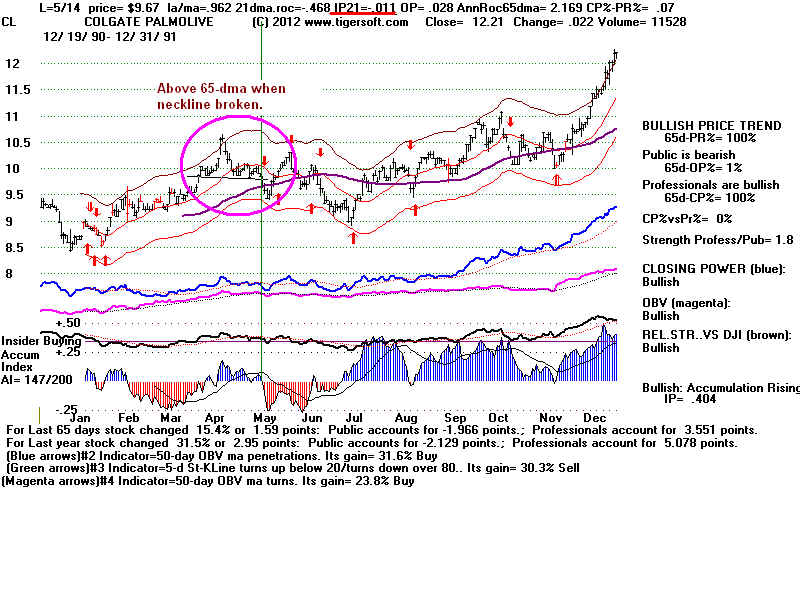
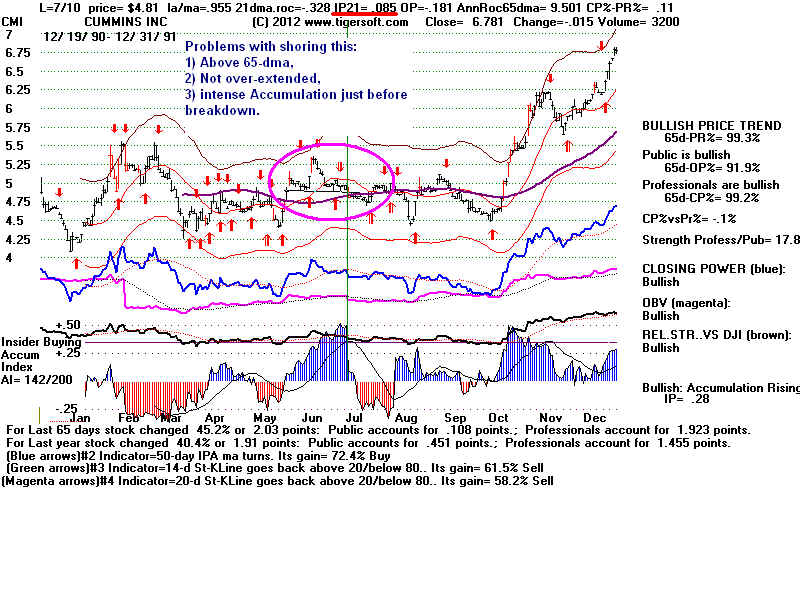
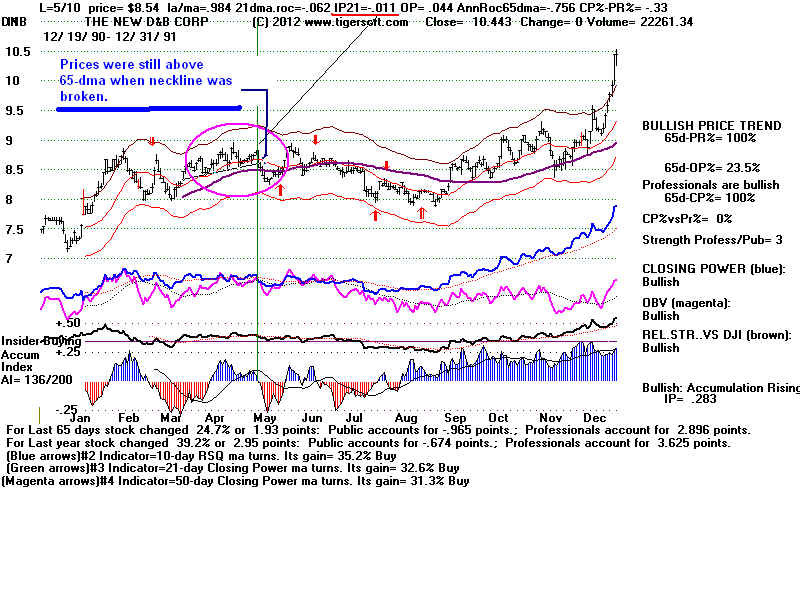
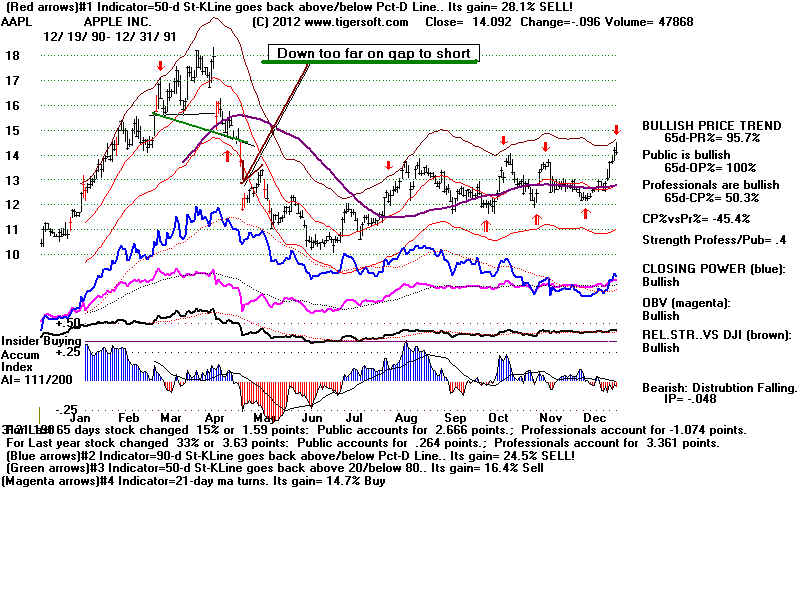
Here we have separated the completed H/S cases where the stock is above above the 65-dma
   and those where it is below it when the neckline was violated.  Without a Peerless major Sell, we
    have to be much more careful with our short sales.

    There were 39 completed H/S patterns where the neckline's penetration occurred with
    prices below the 65-dma.  In 22 of 39 cases, prices fell to the minimum downside objective
    before the end of the year.  17 did not.  Only 19 of the 39 fell more than 10% from the
    close the day the neckline was penetrated.  Keep in mind that this was a period in which
    the DJI steadily rose except for a 6% decline in December.


                                                 H/S Completed with Prices below 54-dma

             --- Neckline Break -------   ------------------------- Outcome -------------------------------------
              Date        IP21       Close    Recovery  Low   Decline                Minimum Objective       Opct
                                                                                     at Low                  Met?      Price
-------------------------------------------------------------------------------------------------------------------------------------
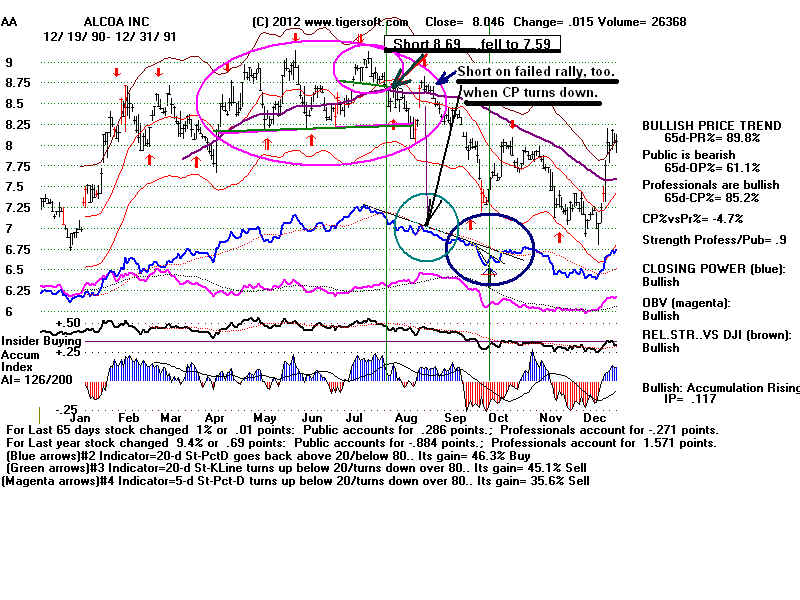
      AA   Aug 6      +.05          8.47        --             6.8    
19.8%                Yes        8.32                    .268         
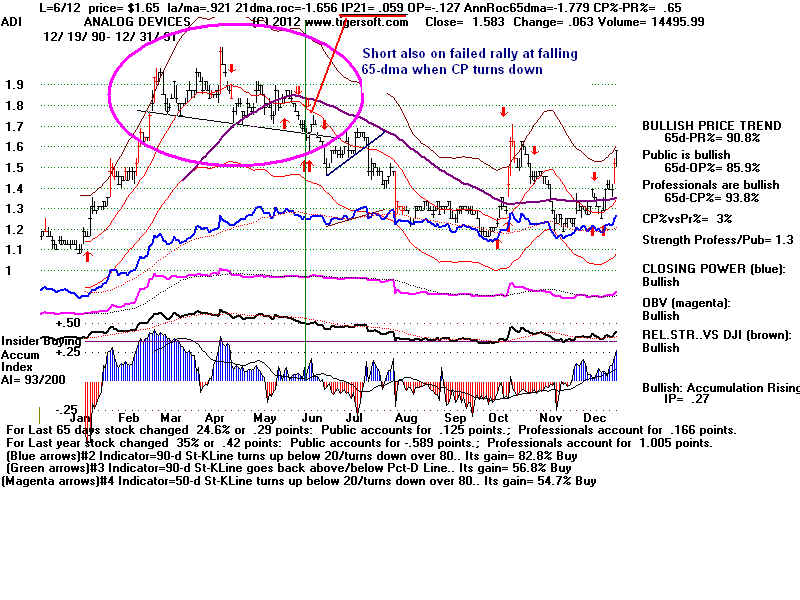
      ADI  June 12  +.059       1.65      1.7          1.17   
  29.1%                Yes       1.37                
  -.127
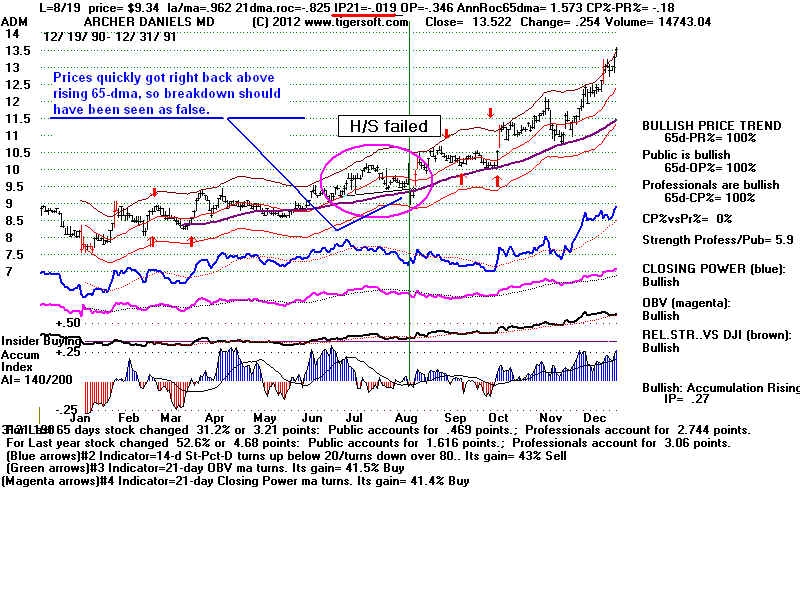
      ADM Aug 19  -.019        9.34     
Failed two days later when it shot back above both neckline
                                                            and 65-dma.

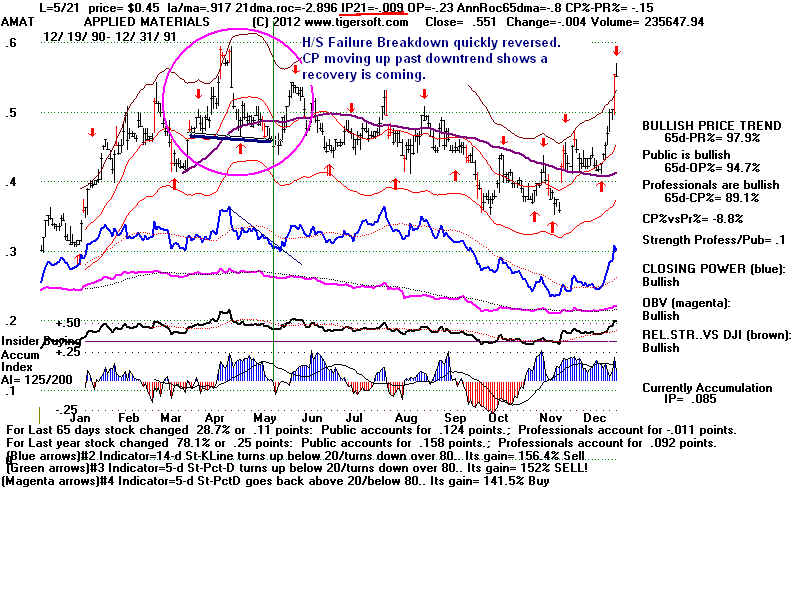
      AMAT May 21 -.009      0.45     
Failed four days later when it shot back above both neckline
                                                            and 65-dma.

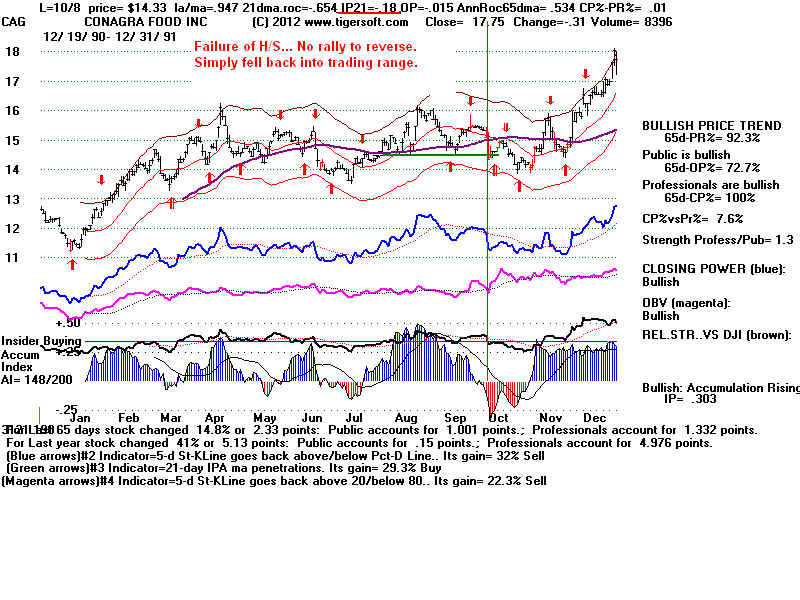
      CAG  Oct 8      -.18      14.33         15          14  
   2.3%                     No.     9                          -.015
     
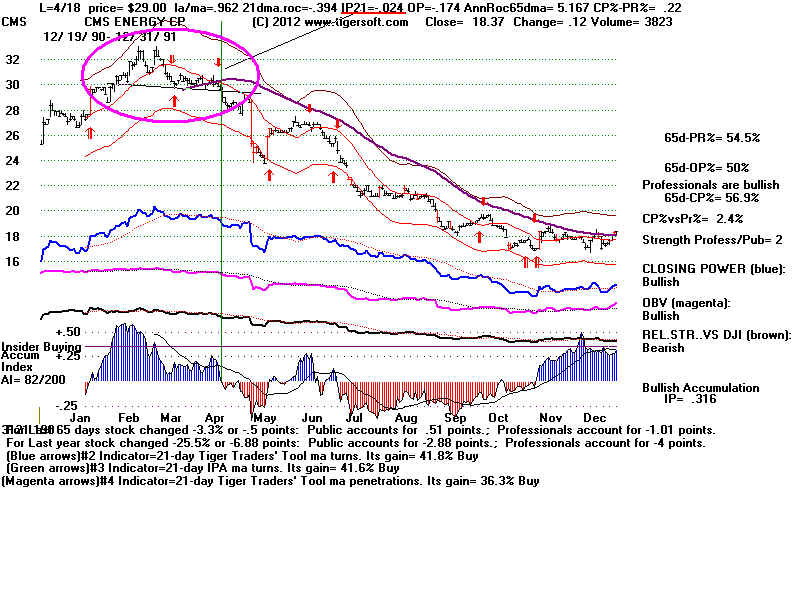
      CMS April 18  -.024     29.00           -          17     
41.4%                  Yes     25.90                    -.174   
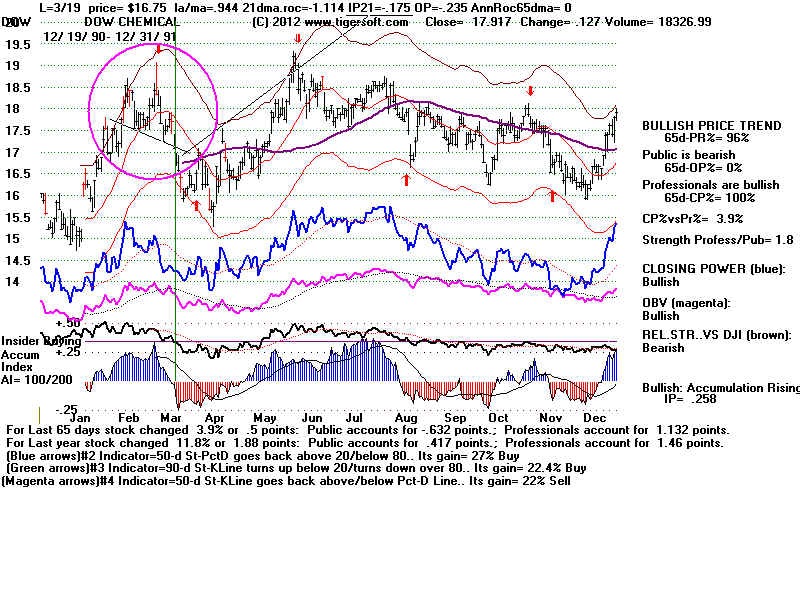
      DOW  March 19 -.175  16.75         ---       15.4     
8.1%                   Yes    15.5                      -.235
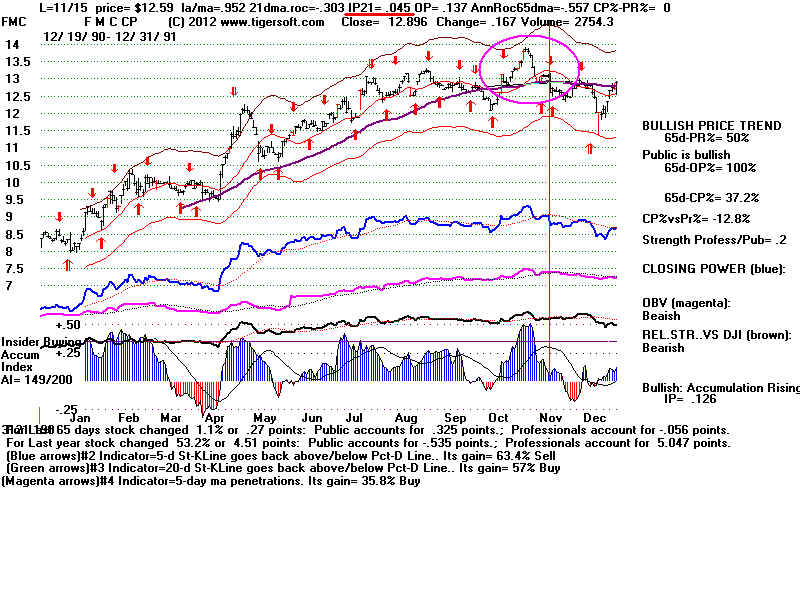
      FMC Nov 15     +.045     12.59       ---       11.5    
11.8%                   Yes   11.9                       .137
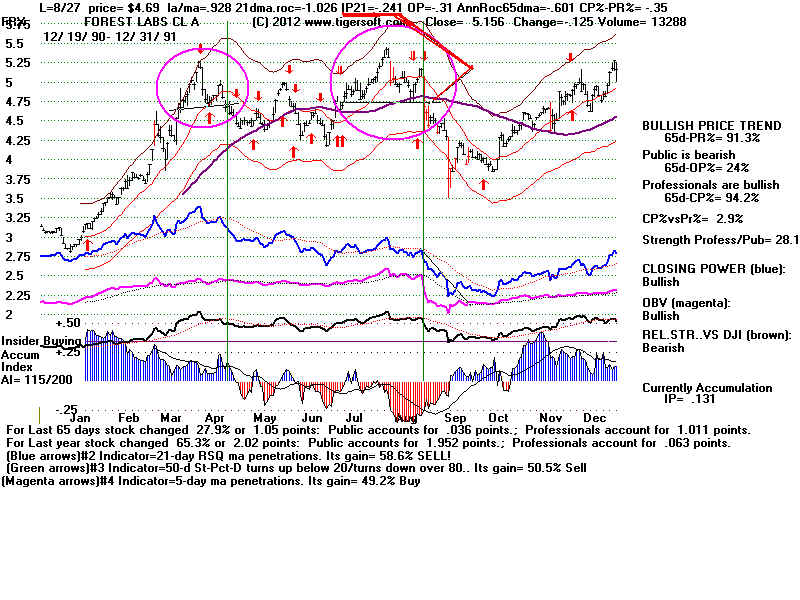
      FRX  Aug  27    -.241       4.69        ---         3.56  
24.1%                   Yes    4.0                      -.31
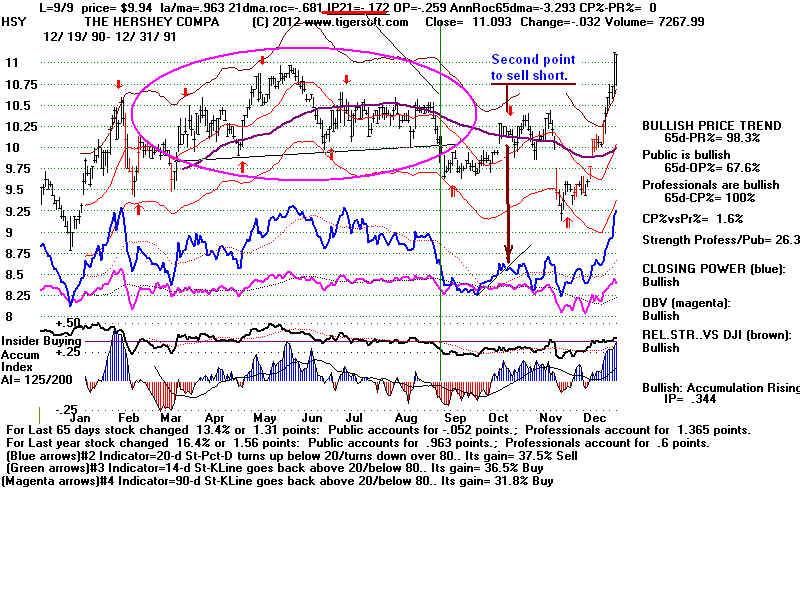
      HSY  Sept 9      -.172        9.94       10.3      9.25  
  6.9%                     No    90.                      -.259

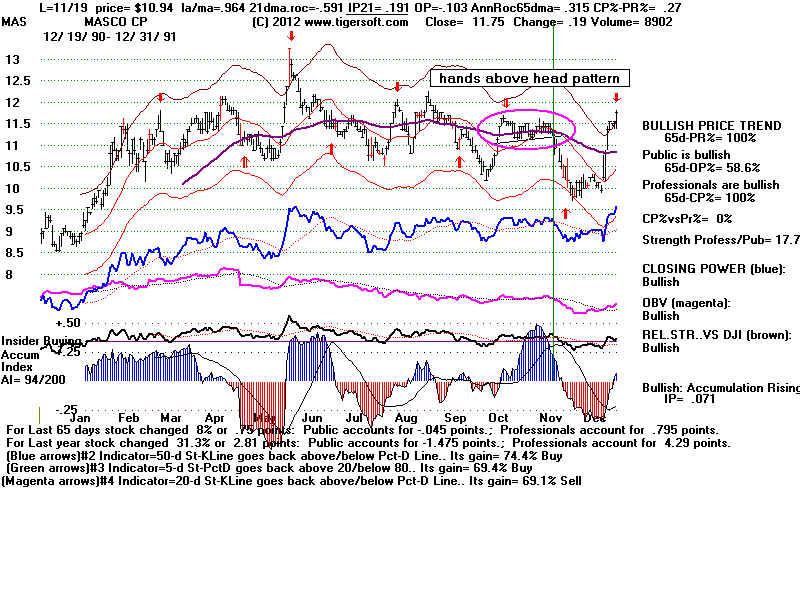
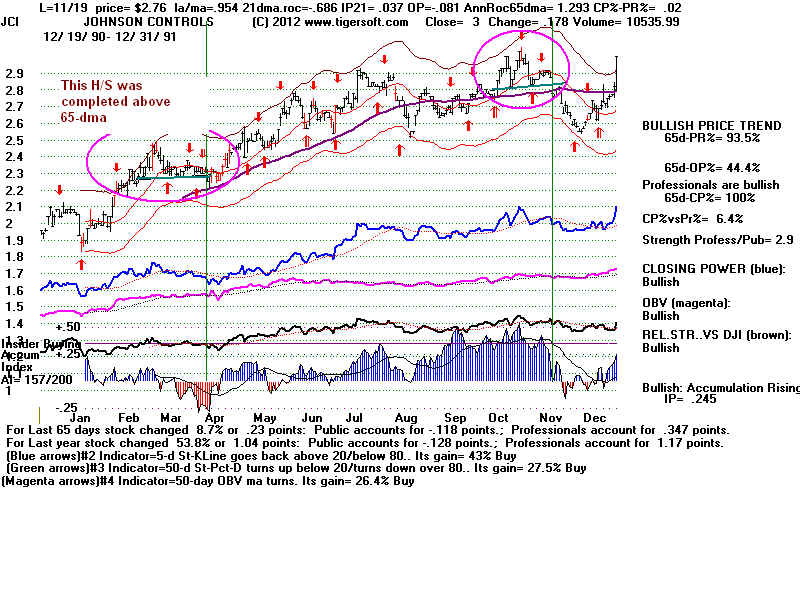
       JCI   Nov 19       .037       2.76          ---      2.52   
8.7%                  Yes   2.55                        -.081
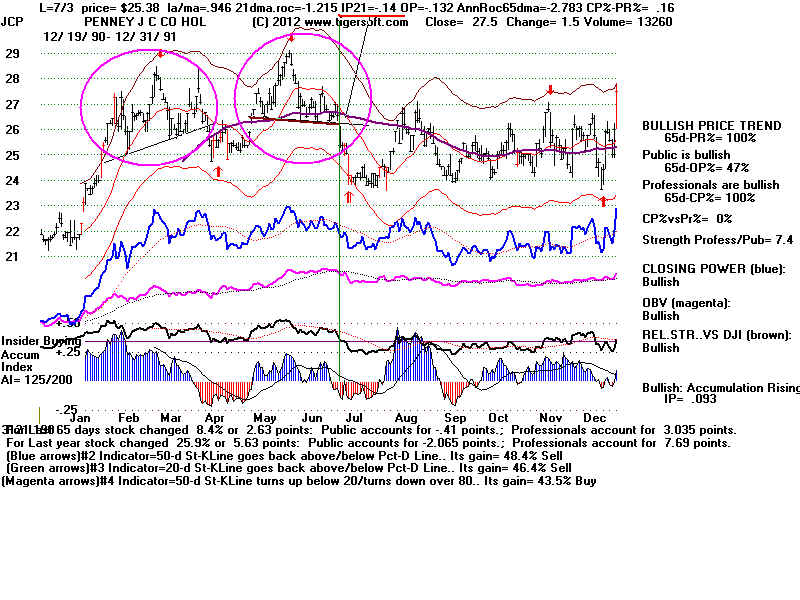
       JCP  July 3        -.140      25.38       ---      23.75   6.4%                    Yes   23.75                    
-.132
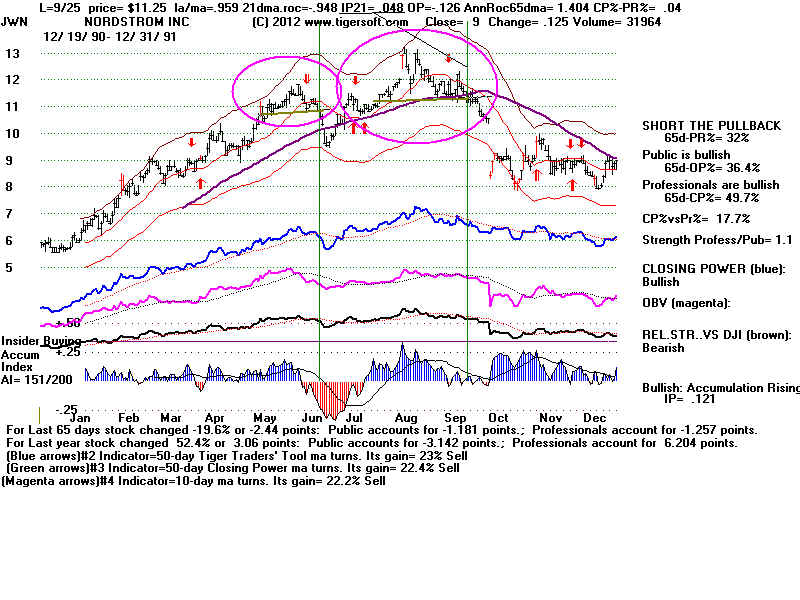
      JWN Sept 25       .048      11.25      ---          8.0  
28.8%                  Yes    9.0.                        -.126
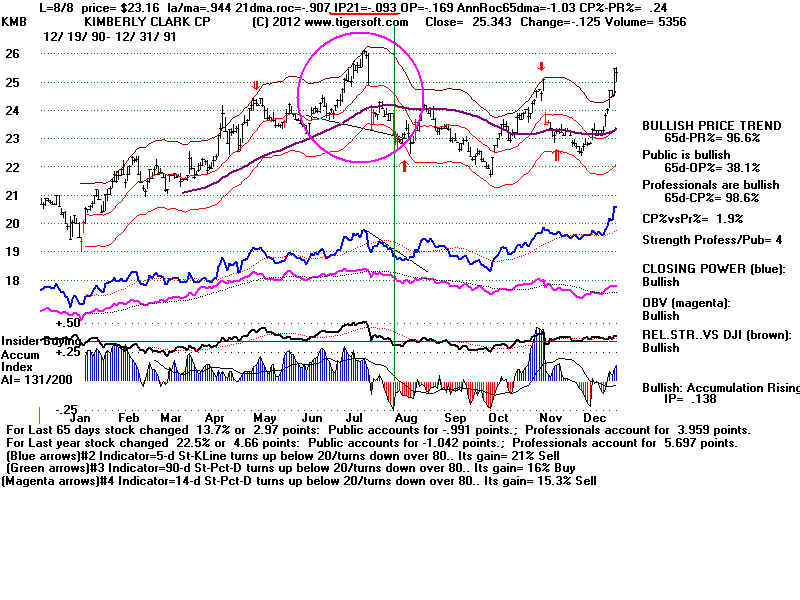
      KMB  Aug 8         -.093   23.16       24        21.5   
6.7%                  No   20.5                         -.169               
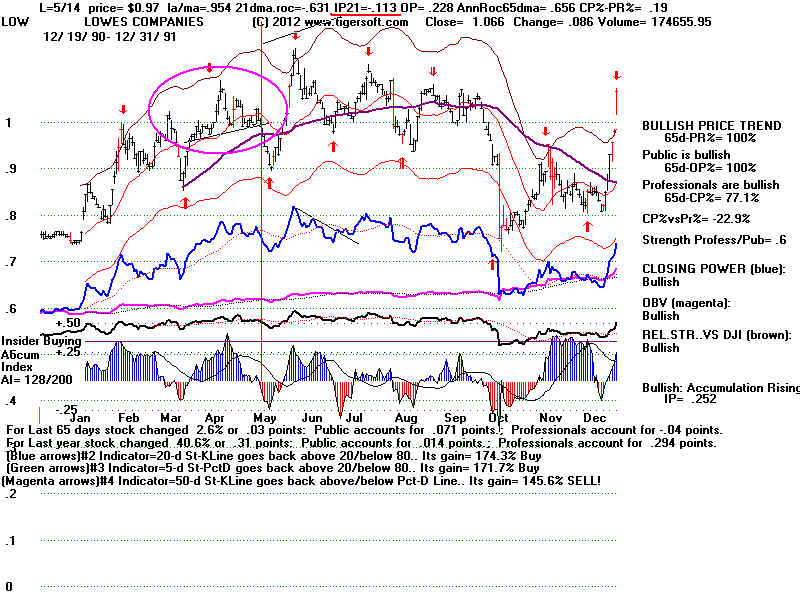
      LOW  May 14      -.113     0.97     ---            0.9   7.2%                   Yes   0.92                         .228
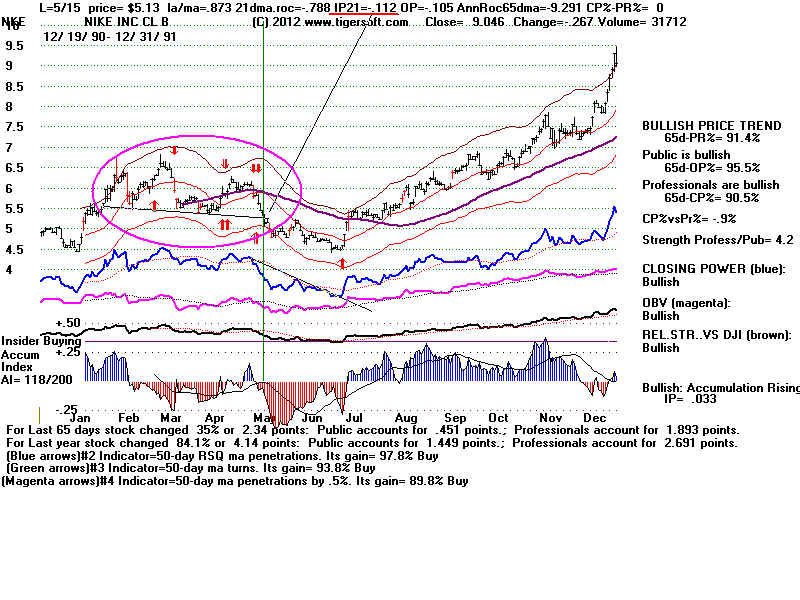
                   After fulfilling its downside objective, this stock jumped to a new high.  The OPct was
                   a warning to short sellers not to hold for to low a price.
     
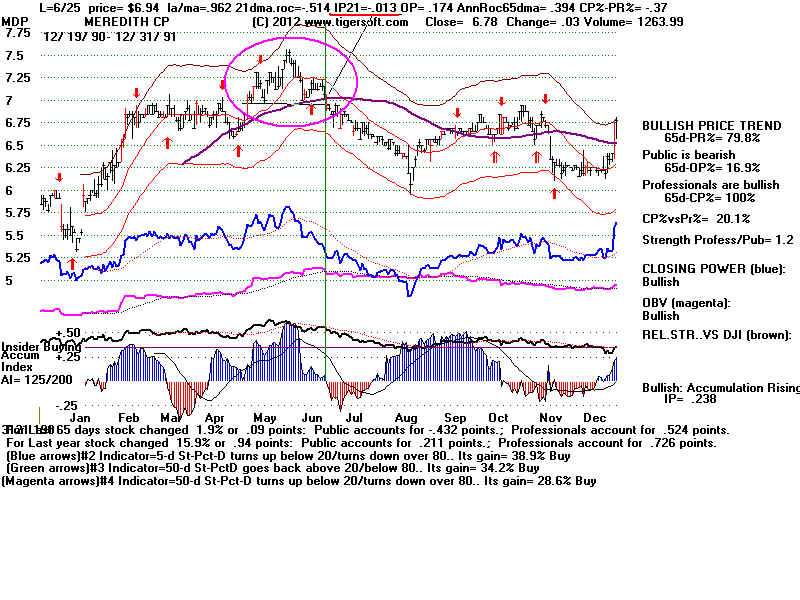
      MDP  June 25     -.013      6.94      ---          6.0   
13.5%                 Yes   6.25.
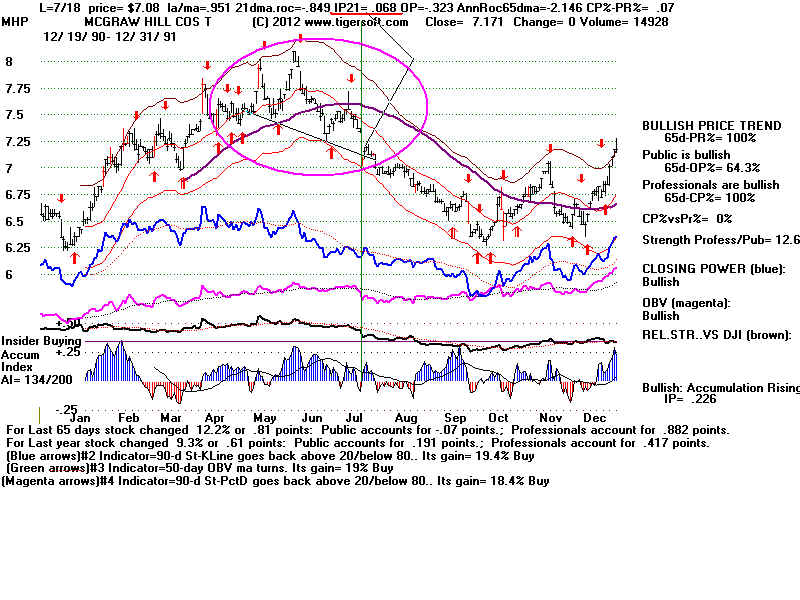
      MHP  July 18      .068       7.08      7.12       6.27  
11.4%                 Yes   6.30
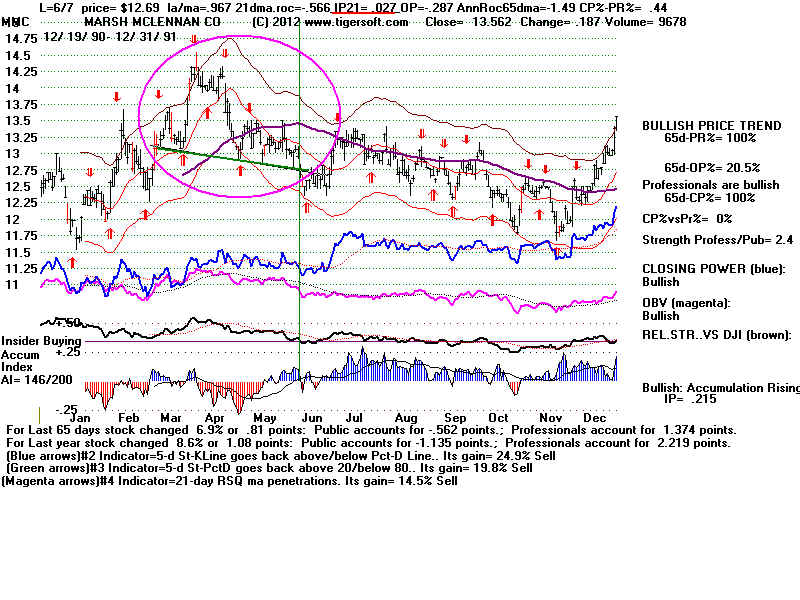
      MMC  June 7     .027      12.69    13.30      11.75
7.4%              No 11.25
                                                                    It did fall gradually to 11.25 in November.
                                                                   The pattern was tall and downsloping.
      NKE  May 15  -.112         5.13     --              4.5  
  12.3%               No   4.0
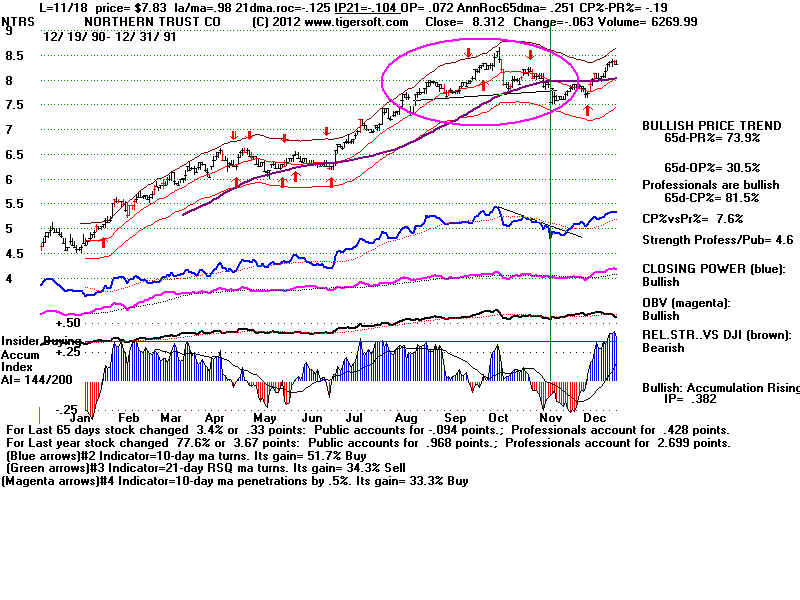
      NTRS  Nov 18  -.104       7.83      ---            7.5    4.2%                No  7.25.

     
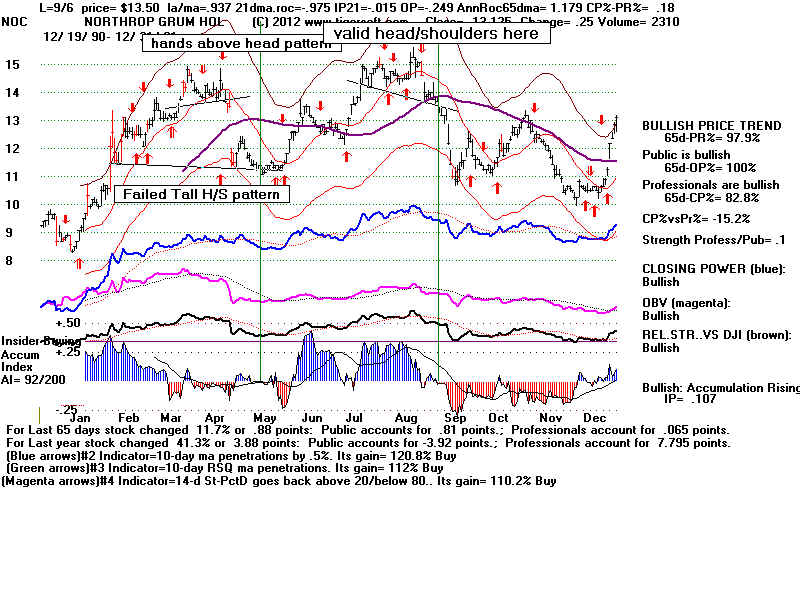
       NOC  Sept 6     -.015       13.5     --             10.9 
19.3%               Yes 11.25
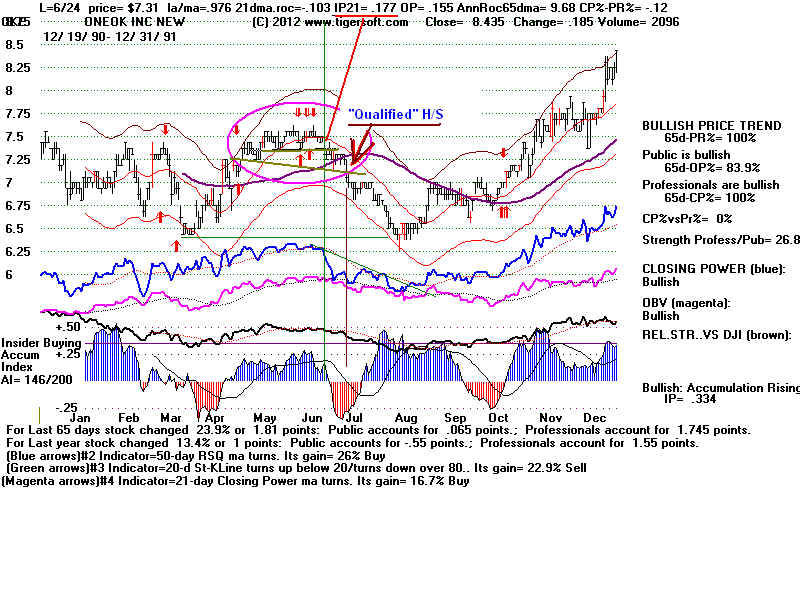
       OKE   June 24   -.103       7.31    --               6.25 
14.5%              Yes    6.6
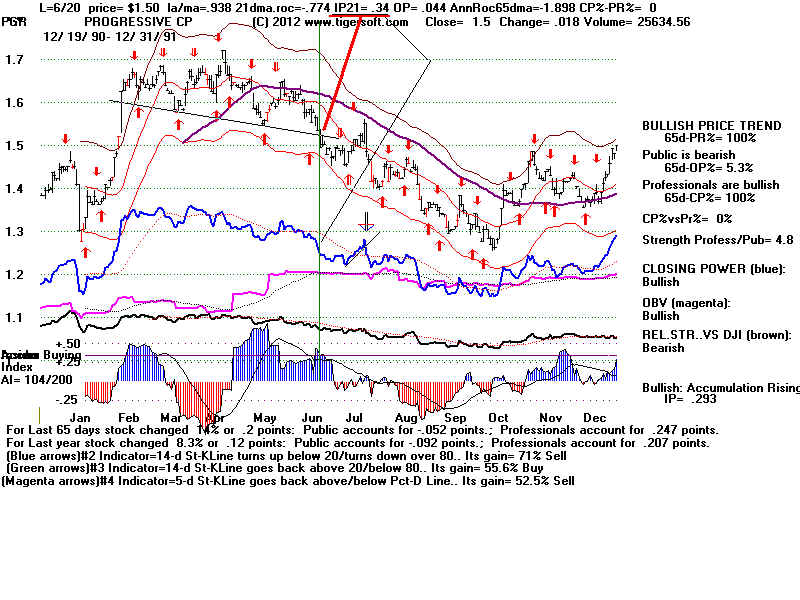
       PGR   June 20     +.34      1.5     1.55            1.25
16.1%              Yes  1.35
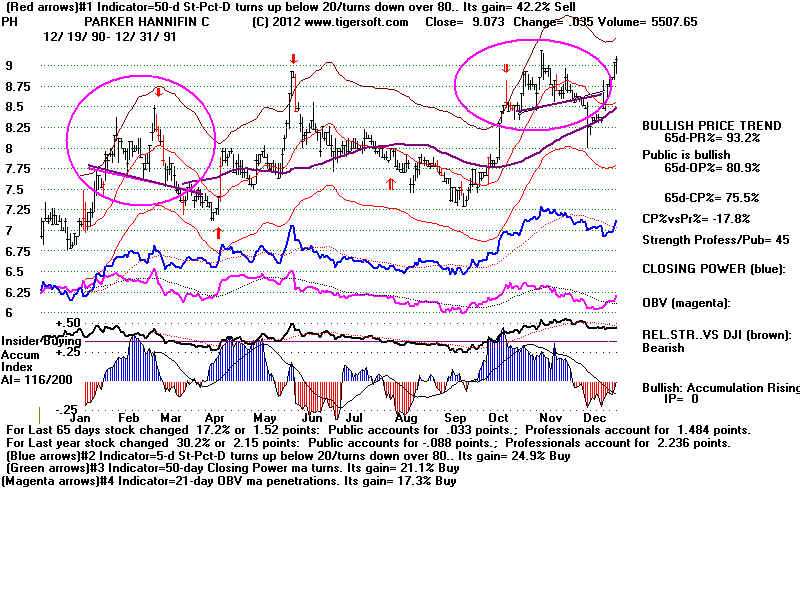
       PH    March 21    -.13      7.37     .--              7.15 
3.0%               No   6.25
                            
           This was tall, downsloping pattern.
       PH   Aug 9           -.295    7.74   --                 7.30     3.0%             No 6.6
                                            
This was very tall pattern.

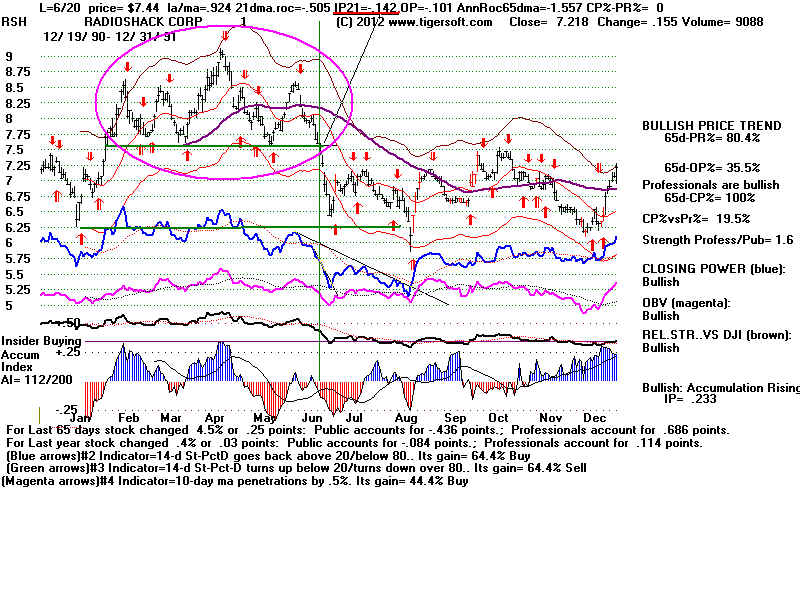
        RSH  June 20        -.142 7.44      --             5.90    20.7%           Yes  6.0
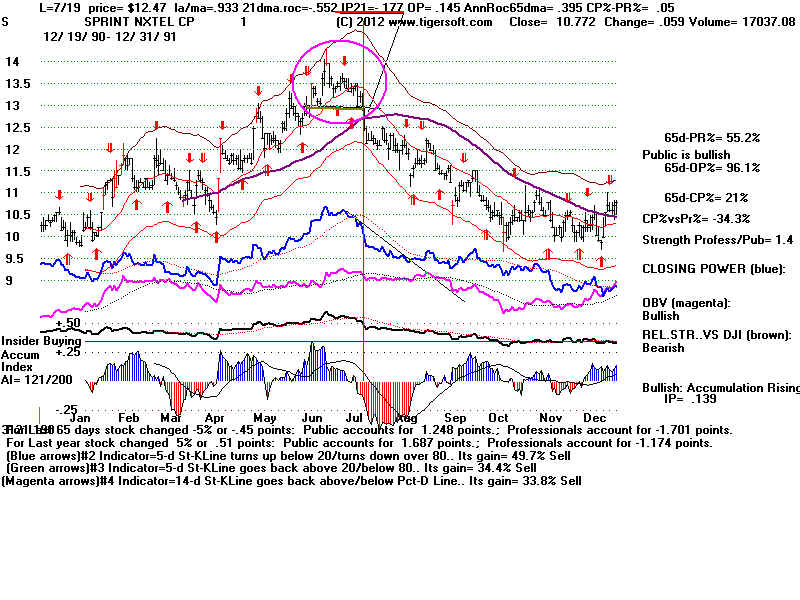
        S   June 19             -.177  12.47     --          10.00    
19.8%           Yes 11.75
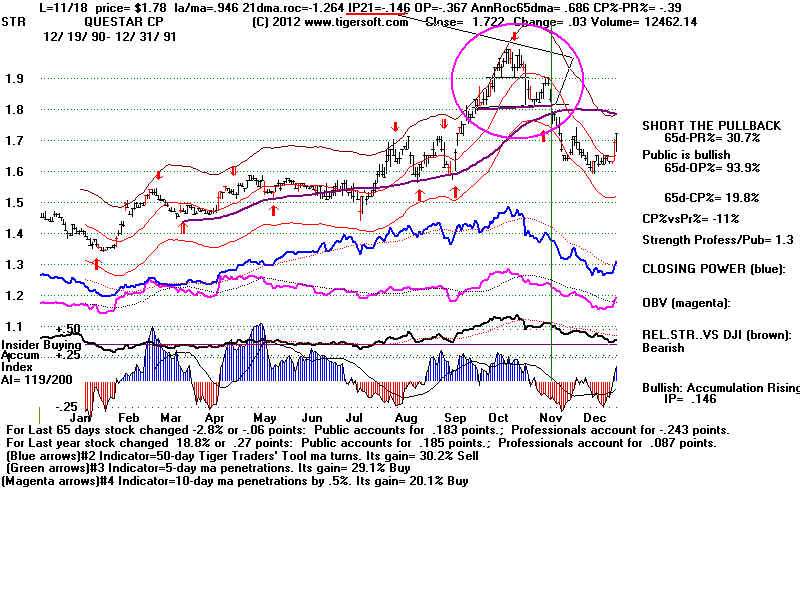
        STR  Nov 18   -.146    1.78          --             1.59   
10.6%           Yes  1.6
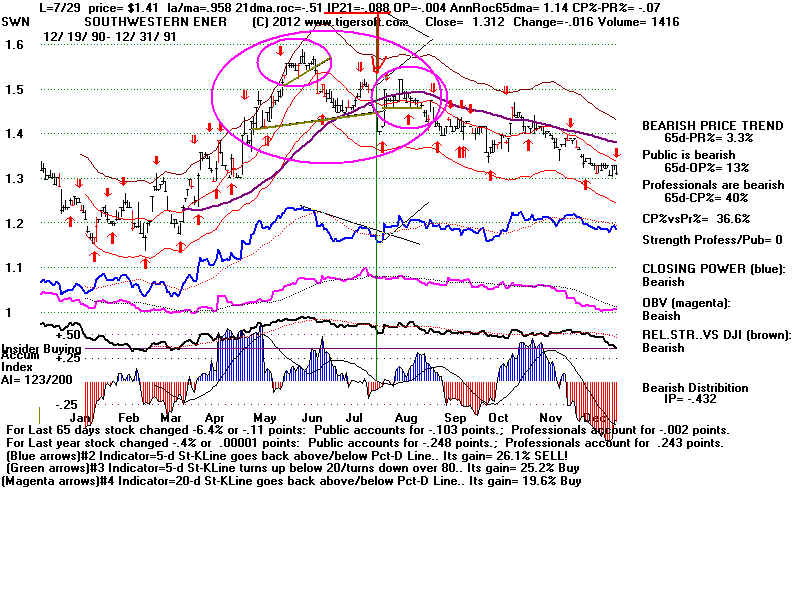
        SWN  July 29 -.008    1.41      
1.52         1.32       6.4%           No  1.29  
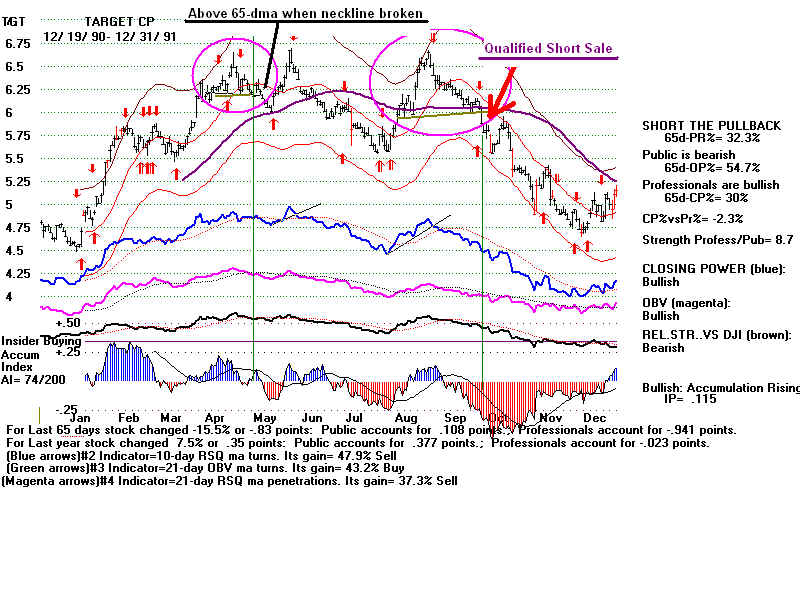
        TGT  Oct 3    -.306       5.87       --              4.75  
  19.3%            Yes 4.8
       
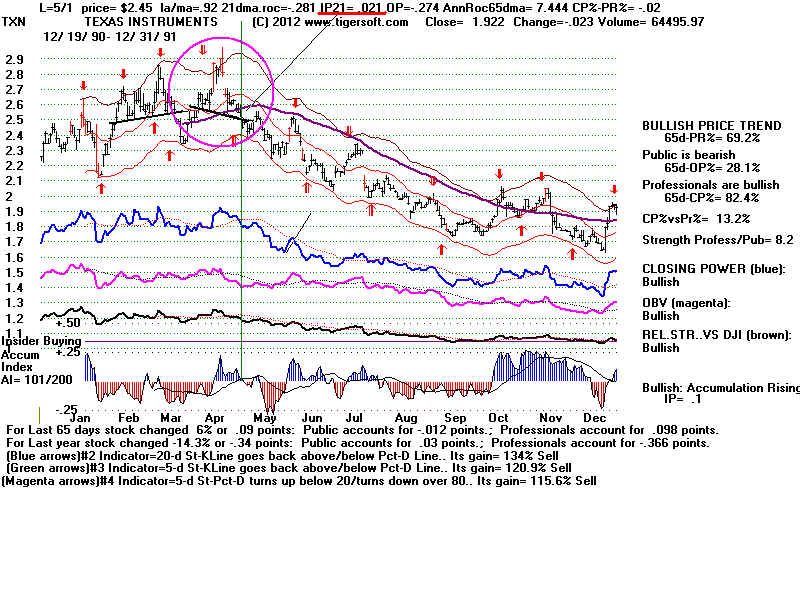
        TXN  May 1    .021       2.45       --              1.66 
  32.2%            Yes  2.07 
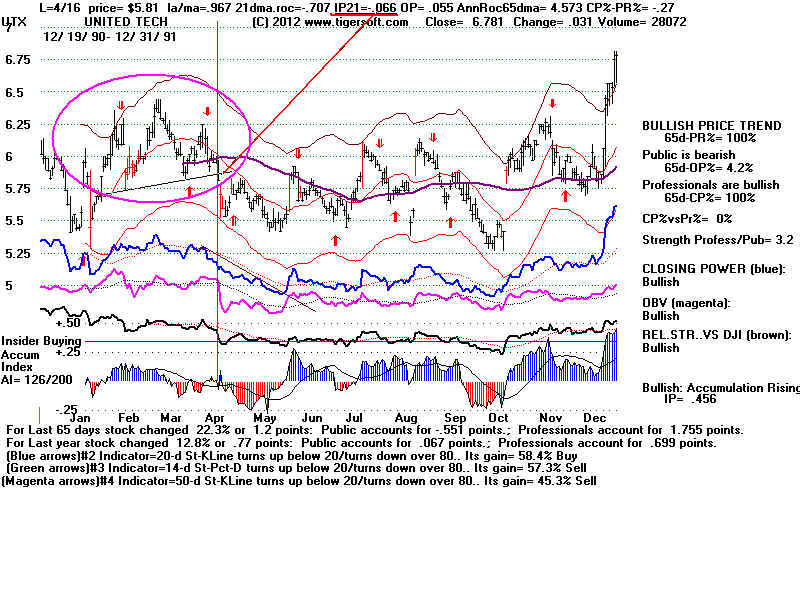
        UTX  Apr 16    -.066      5.48   
6.11          5.41      1.3%             Yes  5.42
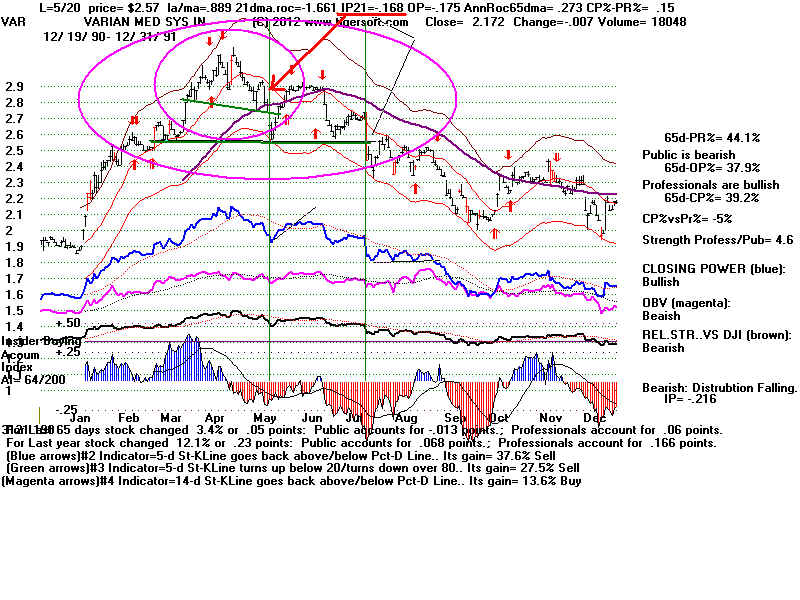
        VAR  April 17  -.146     2.66     2.90            2.00  
24.8%            Yes 2.37
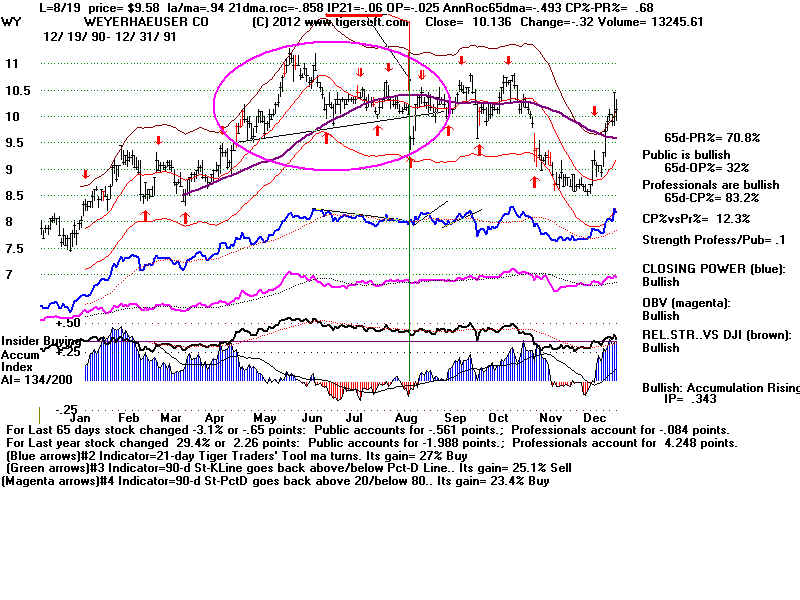
         WY  Aug 19       -.06     9.58    10.70          8.58 
10.5%              No 8.40
                                       
Objective was reached in Feb 1992.  
                
         The biggest decliners were:

                  CMS    29 to 17  6 months and 1 week.
                  TXN     32.2% in  3 months and 2 weeks.)
                  ADI     29.1% in 3 months and 2 weeks.
                  JWN    28.8% one month.
                  VAR     24.8%in 4 months 1 week.
                  FRX     24.1% in 2 weeks
                  RSH     20.7% in 2 months


              Having an Opct score below -.10 on the breakdown seems to help find the best short sales.

                                     la/ma      21dmaroc   IP21     Opct CP%-Pr%

  CMS       4/18/1991    .962       -.394          -.024     -.174       .22
  TXN        5/1/91           .92          -.281          -.021   -.274     -.02
   ADI        6/12/91         .921     -1.656           .059    -.127      .65
   JWN      11/25/91      .971         -.832           .002     -.117      .05
   VAR       5/17/91        .913       -1.465       -.146     -.164      .14
   FRX        8/27/91       .928       -1.026        -.241     -.31      -.35
   RSH        6/20/91       .924        -.505         -.142     -.101      0


             Eliminating from consideration, the cases where the la/ma is above .94 would have eliminated
     4 of the 5 biggest losers and only 2 of the 7 biggest decliners..  
            

              The five biggest failures:
    ADM      8/19/91      .962        -.825            -.019      -.346     -.18   
    AMAT    5/21/91     .917       -2.896           -.009       -.23       -.15  

   UTX       4/16/91      .967        -.707            -.066       .055     -.27
   CAG   10/ 8/91        .947       -.654           -.180     -.015      .01      
    NTRS  11/18/91    
.98         -.125            -.104       .072
   -.19


         Waiting for the Closing Power to hook up after the first sell-off would have consistently
    achieved trading gains, but they were mostly under 10%.  

           AA      8.47 ---> 7.47
           ADI   1.65 ---> 1.58
           ADM        9.34     
.
           AMAT       0.45     

           CAG   14.33      ---> 14.29
           CMS  29.00     ----> 25.82
           DOW 16.75    ----> 16.17
           FMC 12.59     ---->  11.95
           FRX  4.69  ----> 4.02
           HSY   9.94   ----->
10.02
           JCI      2.76  ----> 2.58
           JCP    25.38 ----> 24.25
           JWN  11.25 ---> 9.94
           KMB   23.16 ---> 22.81
           LOW      0.97   
           MDP    6.94     
          MHP     7.08     
         MMC    12.69 
         NKE      5.13     

         NTRS     7.83  
         NOC     13.5      
         OKE      7.31   
         PGR        1.5  
         PH      7.37      

         PH       7.74 
        RSH    7.44   
        S   12.47 
        STR      1.78         
        SWN     1.41      
        TGT    5.8
        TXN     2.45      
        UTX       5.48    
        VAR    2.66     
         WY      9.58    


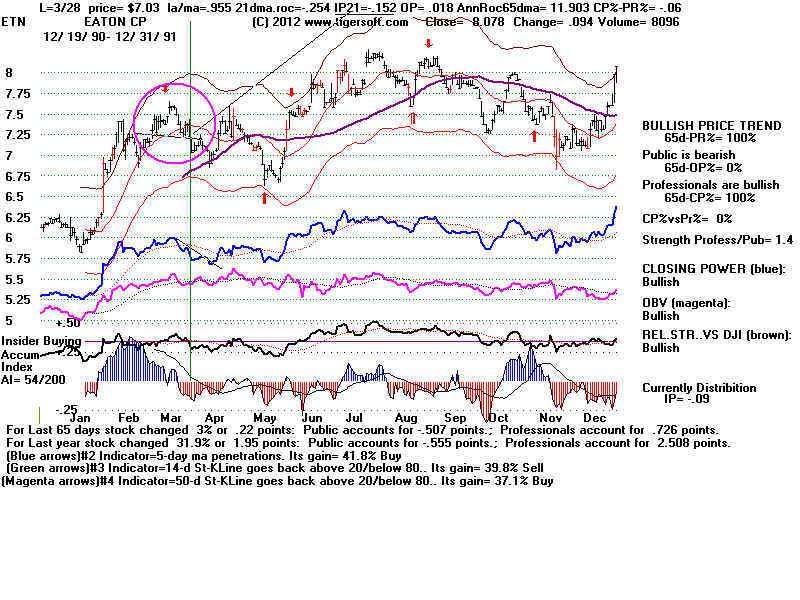
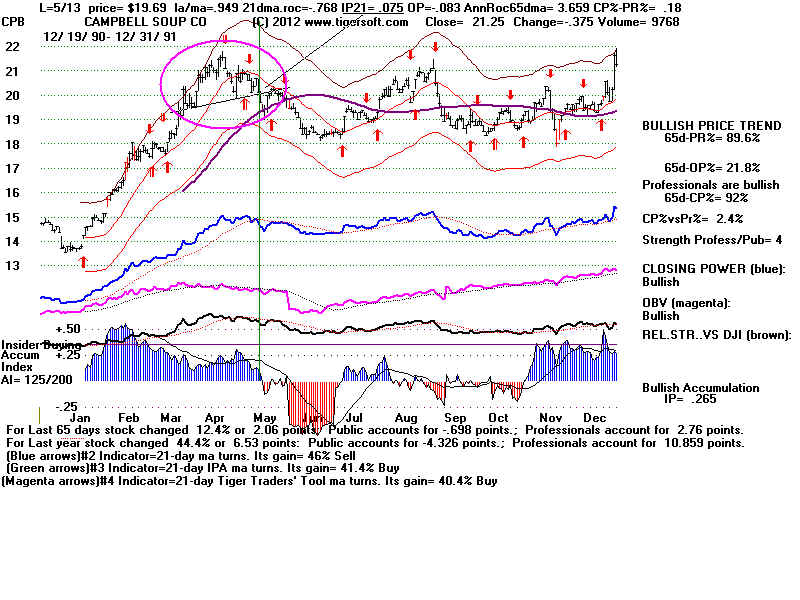
         Others - where break in neckline occurs with stock above 65-dma.

         Example  CPB
            
CPB May 13    +.075  19.69    20.1     18.1          CP broke downtrend.
AA91.BMP (1440054 bytes)
ADI.BMP (1440054 bytes)
 ADM.BMP (1440054 bytes)
AMAT.BMP (1440054 bytes)
CAG.BMP (1440054 bytes)
CMS.BMP (1440054 bytes)
 CPB.BMP (1440054 bytes)
 
DOW.BMP (1440054 bytes)
 FMC.BMP (1440054 bytes)
                           First H/S above 65-dma            Second H/S qualifies as short sale.FRX.BMP (1440054 bytes)
 HSY.BMP (1440054 bytes)
 JCI.BMP (1440054 bytes)
 JCP.BMP (1440054 bytes)
 JWN.BMP (1440054 bytes)
 KMB.BMP (1440054 bytes)
LOW.BMP (1440054 bytes)
MDP.BMP (1440054 bytes)
MHP.BMP (1440054 bytes)
MMC.BMP (1440054 bytes)
NKE.BMP (1440054 bytes)
NTRS.BMP (1440054 bytes)
NOC.BMP (1920054 bytes)

OKE.BMP (1440054 bytes)


PGR.BMP (1440054 bytes)
 PH91.BMP (1440054 bytes)
 RSH.BMP (1440054 bytes)
 S.BMP (1440054 bytes)
 STR.BMP (1440054 bytes)
SWN.BMP (1440054 bytes)
TGT.BMP (1440054 bytes)
TXN.BMP (1440054 bytes)
UTX.BMP (1440054 bytes)
VAR.BMP (1440054 bytes)
WY.BMP (1440054 bytes)


AMD.BMP (1440054 bytes)

BAX.BMP (1440054 bytes)
                            Negative IP21 does not counter the bullishness of strongly rising 65-dma.                 
BK.BMP (1440054 bytes)
BK91.BMP (1440054 bytes)
BMS.BMP (1440054 bytes)
                                  Risky to short when above rising 65-dma
CL.BMP (1440054 bytes)
CMI.BMP (1440054 bytes)
 DNB.BMP (1440054 bytes)
wpe11.jpg (96230 bytes)

ECL.BMP (1440054 bytes)
FLS.BMP (1440054 bytes)
GLW.BMP (1440054 bytes)
IP.BMP (1440054 bytes)
JNJ.BMP (1440054 bytes)
LLY.BMP (1440054 bytes)
PPG.BMP (1440054 bytes)
ROK.BMP (1440054 bytes)
SLE.BMP (1440054 bytes)
WMT.BMP (1440054 bytes)
ZION.BMP (1440054 bytes)
 
 
AAPL91.BMP (1440054 bytes)
                     Not counted                                                           inverted head/shoulders
AET91.BMP (1440054 bytes)
                           Neckline never violated.
BCR91.BMP (1440054 bytes)
DHR91.BMP (1440054 bytes)
                                                       Hands above Head Pattern
MAS.BMP (1440054 bytes)


BP1620.BMP (1440054 bytes)

FDCPX.BMP (1440054 bytes)
FSPTX.BMP (1440054 bytes)
FSUTX.BMP (1440054 bytes)