1989 Head/Shoulders in SP-500 Stocks (now)

   Head and Shoulders or Hands-the Head Patterns are seen below in 39 of the 231 SP-500
  stocks from 1988.    39 of the 49 all cases here did meet their minimum downside objective.
  This year's study shows the added importance of using the H/S pattern breakdowns
  mostly when the break takes the stock below the 65-dma and that break shows an IP21 below -.05.
  Waiting for a pullback to short would have prevented shorting 8 of the 11 best H/S Short Sales.

                                          The Study.

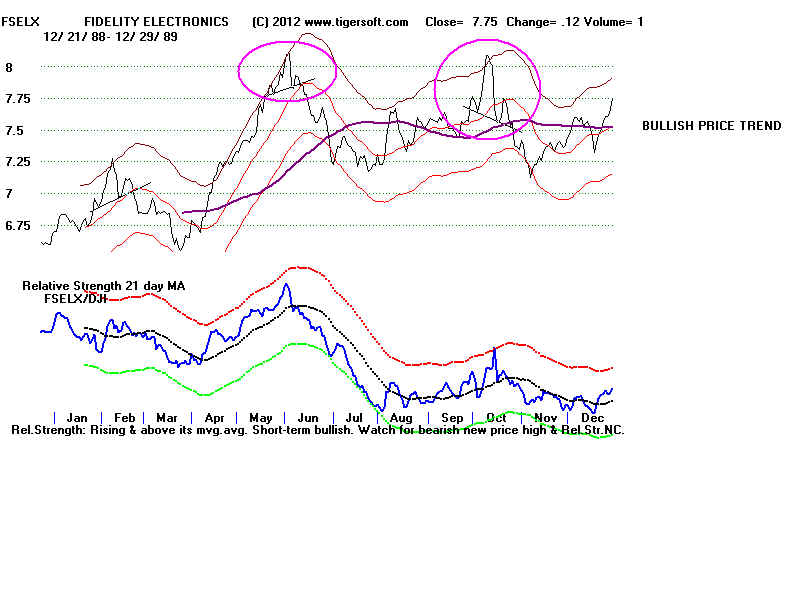
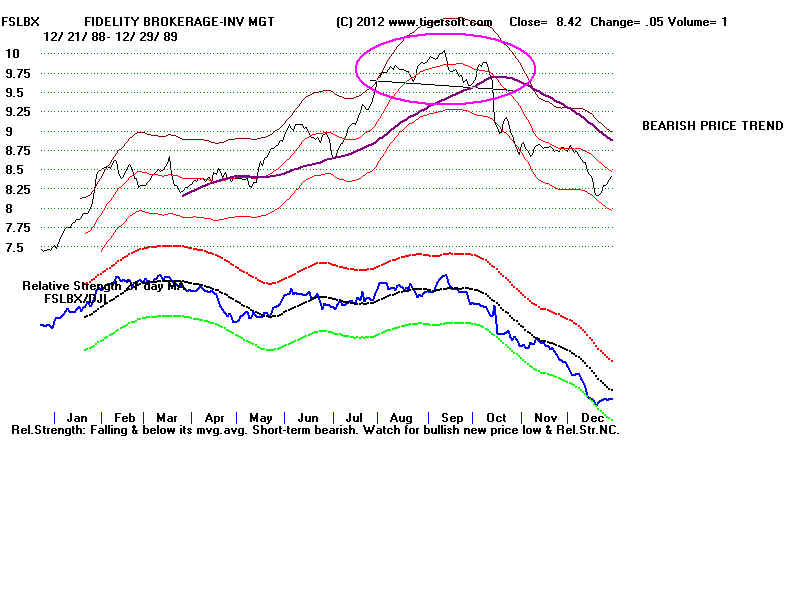
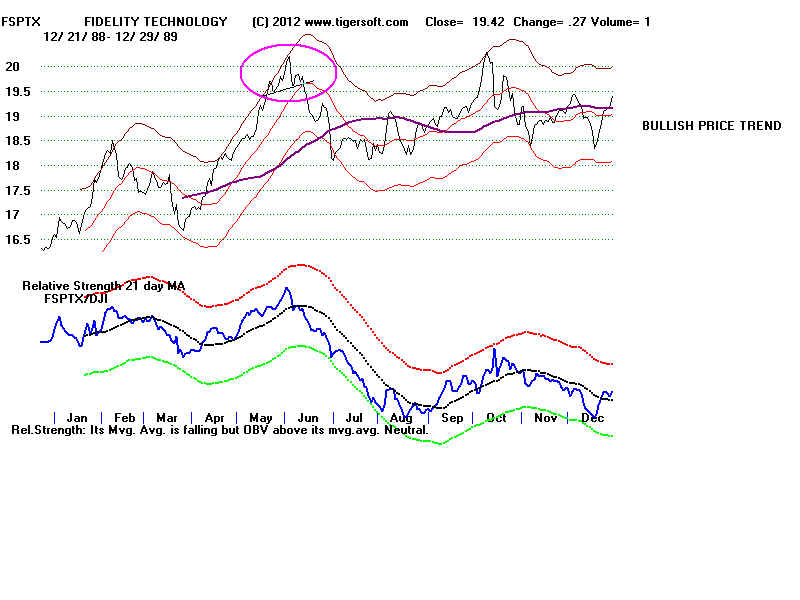
   There were  49 completed head/shoulders patterns identified here and circled in the charts.
                          
           26 of the 49 completed head/shoulders pattterns show pull-backs to
                   neckline before the minimum downside objective was reached.
                 

          Of these 26 pull-backs,  in 18 cases, the stock turned down and reached
          its mimium downside objective, the height of the H/S pattern from peak to neckline
          subtracted from the neckline where the latter was broken.  3 of the pull-backs
          did not reach their downside objective.

          5 of the 49 had their first rally not stop and instead continue to rise to new highs.

          Altogether, 10 of the 49 did not fall at least to their minimum downside objective.
         
39 of the 49 did reach their downside objective,  Most of the declines were small. 

           7 of these 10 failed H.S breakdowns had a rising 65-dma when prices broke below the
          neckline.

          7 of these 10 failed H.S breakdowns had an IP21 score above -.05 when prices broke below the
          neckline.  By contrast 10 of the 11 most successful H/S in this year had an IP21 below -.05.           
         

                       Mininimum                65-dma broken      Classic &         3 month                   Pull Back to neckline
                       Objective Met         and turned down      Symetrical      decline potential      before low
         ----------------------------------------------------------------------------------------------------------------------------------
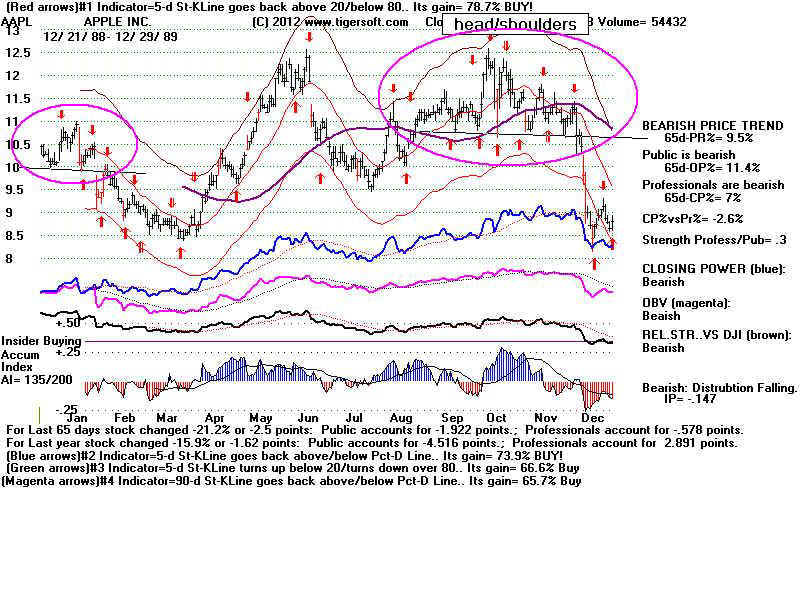
         AAPL  Jan    yes                       yes                             yes, flat         9.5 to 8.5                 yes
         AAPL  Nov  yes                      yes                            no, flat           
10.5 to 8.5             no
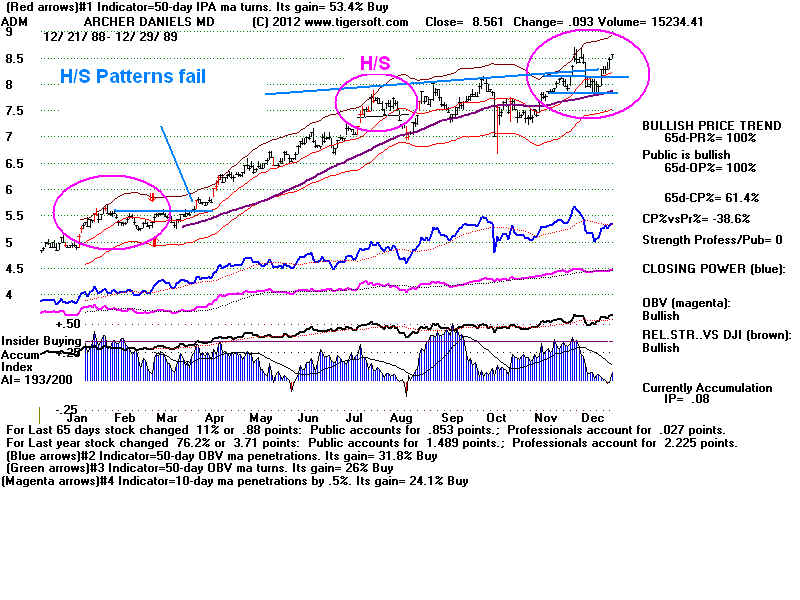
         ADM  Feb   
no                         no                             no, flat            no decline.                 no  
                  
      Note high Accumulation on breakdown.   IP21 =+ .267
         ADM  Aug   yes                       no                             no, flat            7.5 to 7.0                    no
                                        Note high Accumulation
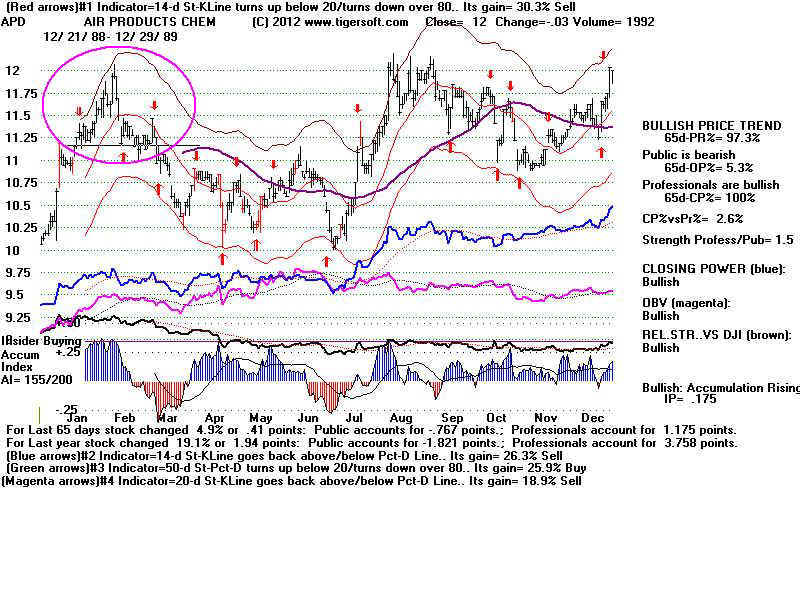
         APD   Feb   yes                        no                              yes, flat          11.125 to 10.125       yes
        
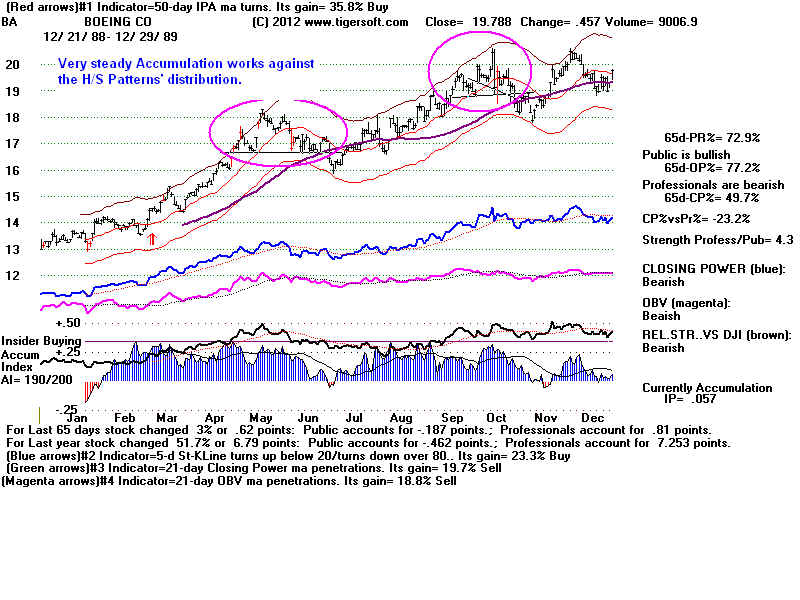
         BA    June  
no                         no                             no, flat             16.5 to 16.                yes - failed
                           Note high Accumulation on breakdown.  IP21 = + .145
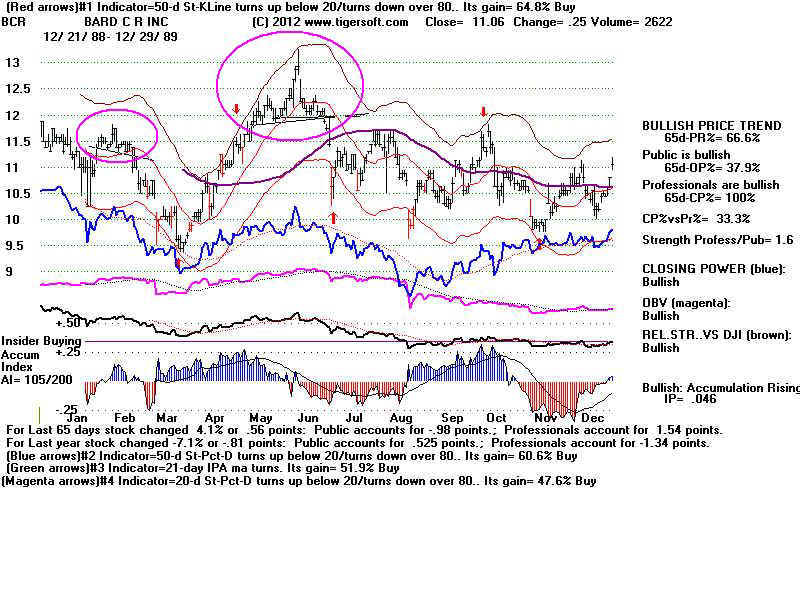
         BCR  Feb    yes                        yes                            yes, flat          11.0 to 9.5                no
         BCR  June yes                        no                              no, flat          
11.8 to 10            yes
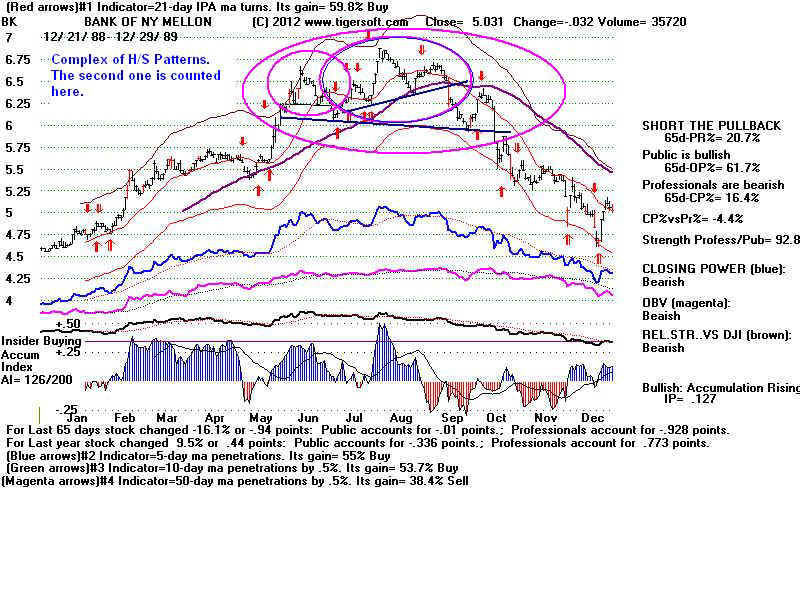
         BK  Sept     yes                       yes                            yes, rising       
6.3 to 4.7                   yes
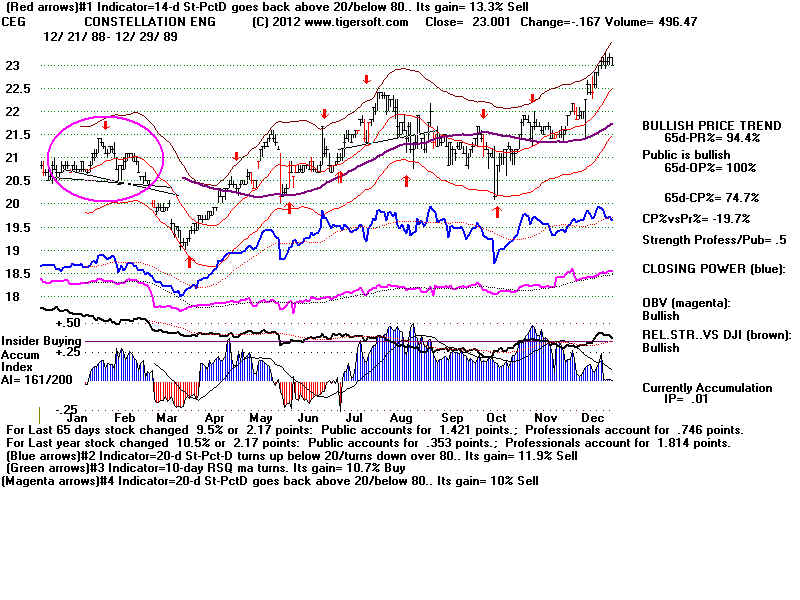
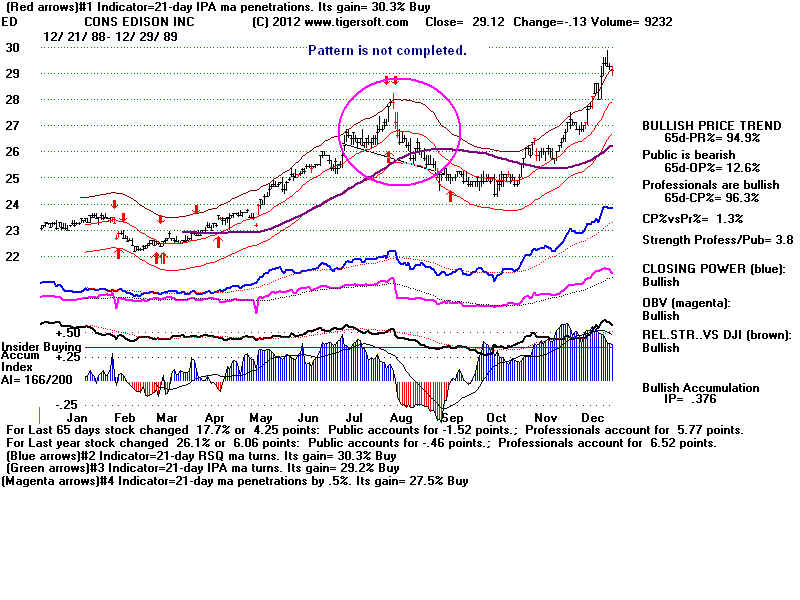
         CEG  Mar   yes                       yes                             no, flat            20 to 19.1                  no
        
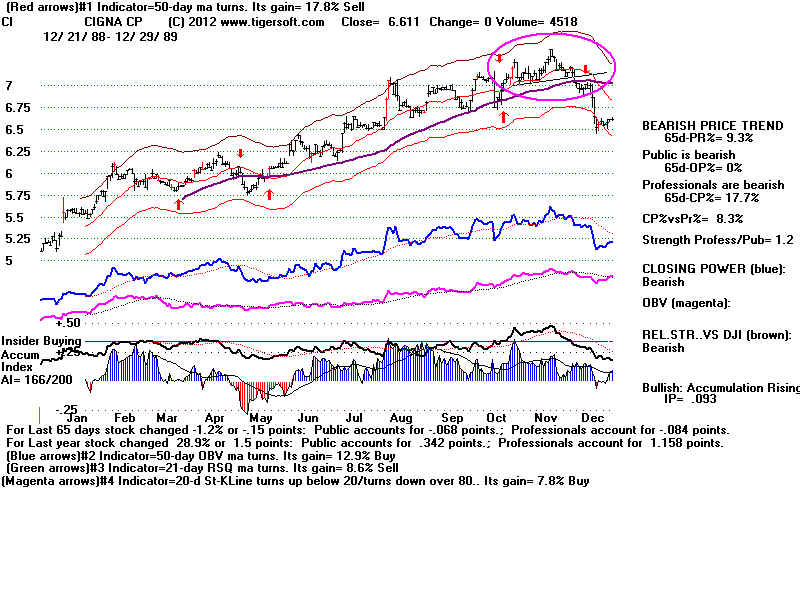
         CI  Dec        yes                      yes                             no, rising         7.1 to 6.5                   yes
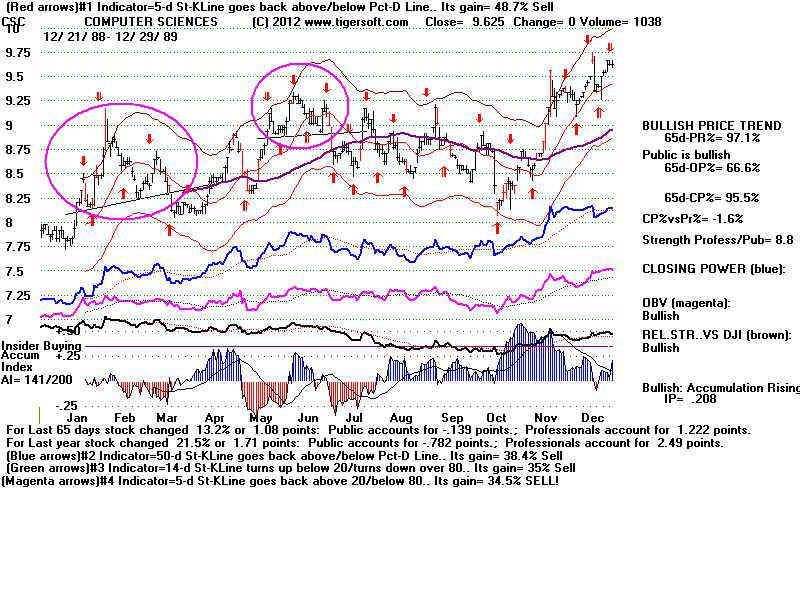
         CSC Mar  
no                         no                              no, rising          8.25 to 8.1                yes - failed
                           IP21 = -.091 on breakdown
         CSC Jun    yes                        no                             yes, rising         8.8 to 8.1                  yes  
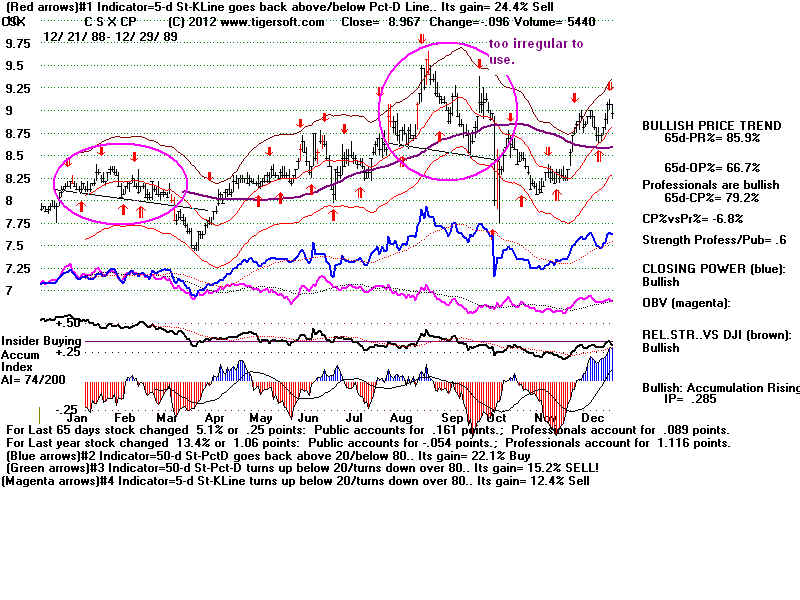
         CSX  Mar  yes                      yes                           no, flat               7.8 to 7.5                      no
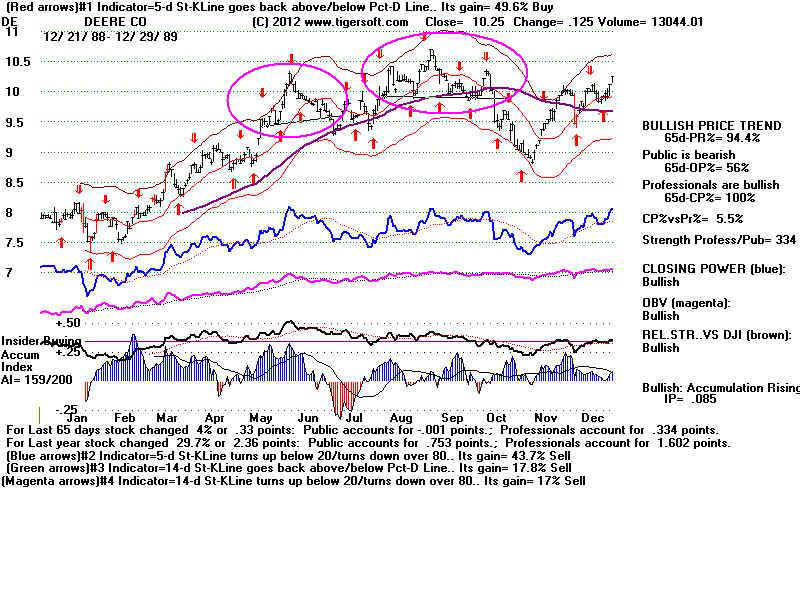
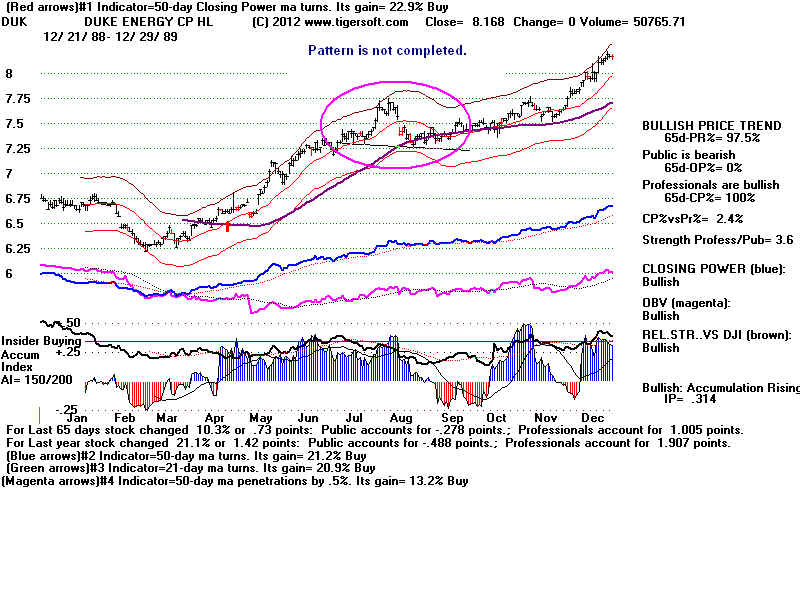
         DE July     
no                         no                             yes, rising        9.4 to 9.35                 yes - failed
                            
IP21 = -.031 on breakdown
         DE Oct        yes                       yes                            yes, flat           9.7 to 8.9                   no
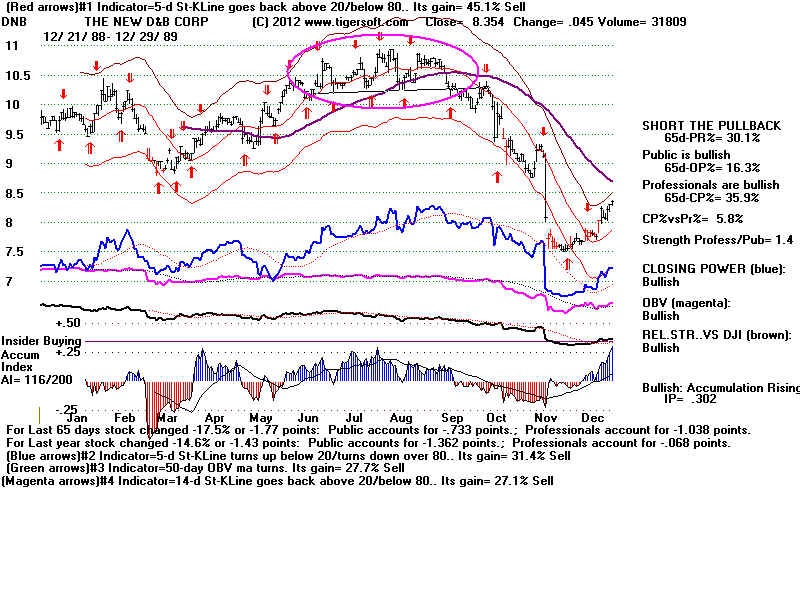
         DNB Oct    yes                       yes                            no, flat           
10.1 to 7.5                 yes
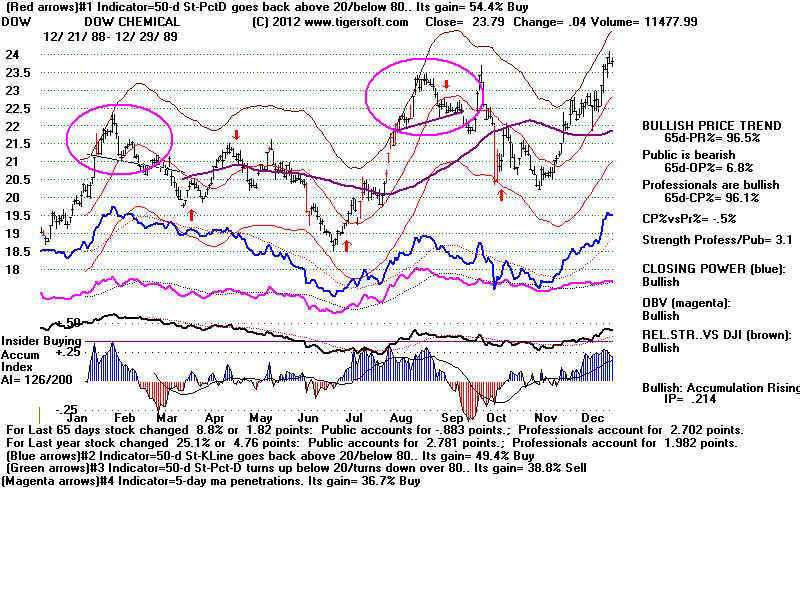
         DOW  Mar yes                      no                             no, falling       
20.6 to 18.5              yes 
         DOW  Sept yes                      no                             no, rising          22 to 20.4                 yes   -
failed (NH)
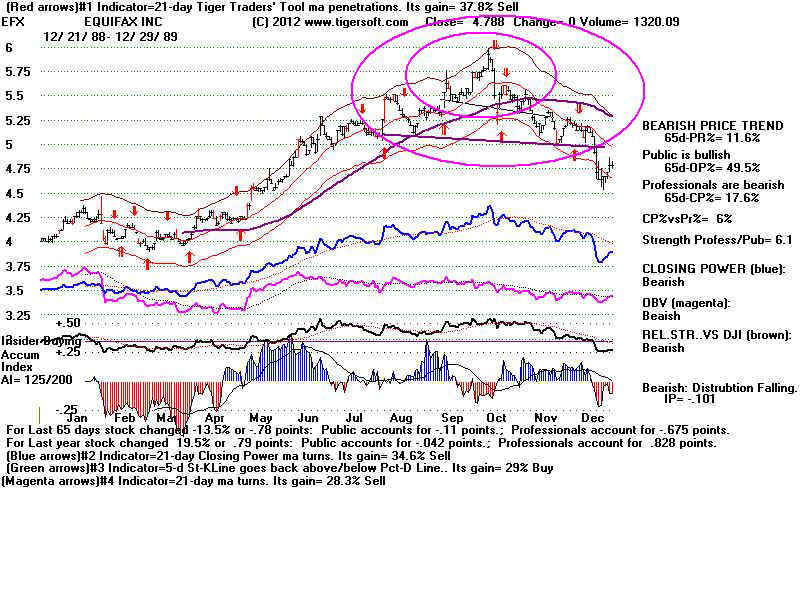
         EFX Oct     yes                       yes                             no, falling       5.25 to 4.6                 yes
        
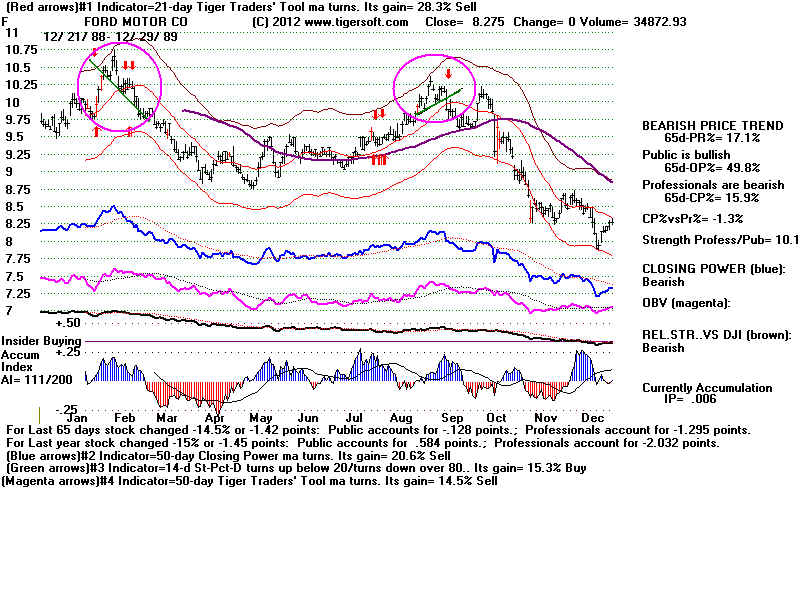
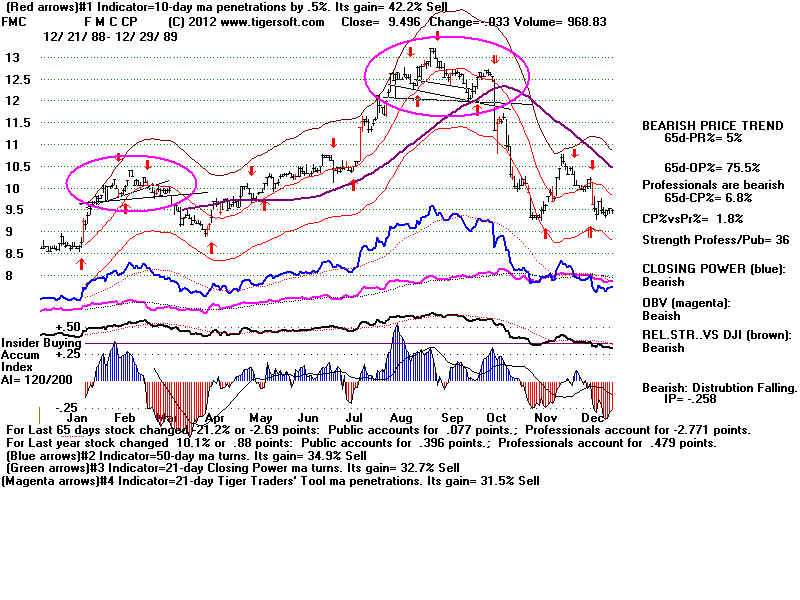
         FMC  Mar  yes                     no                              no, rising          9.6 to 8.95                  no
         FMC  Oct   yes                     yes                             no, rising         10.8 to 9.5                  no
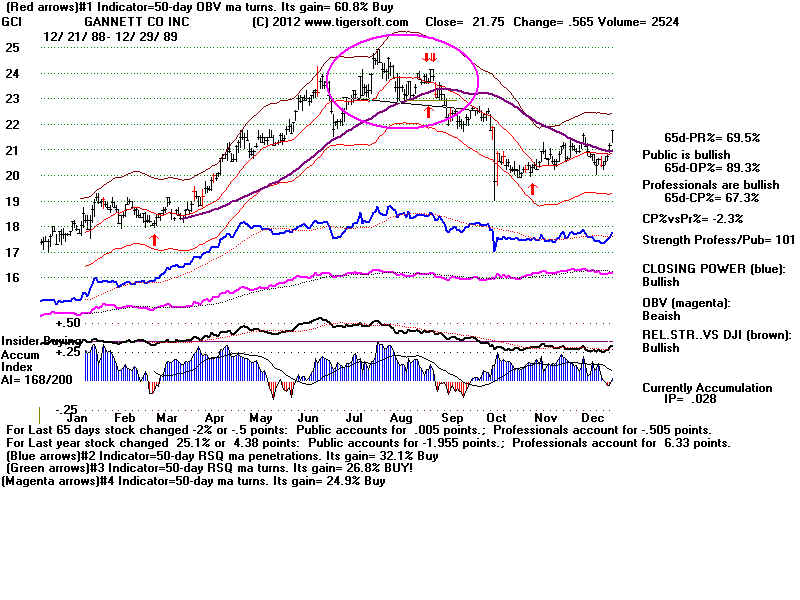
         GCI    Sept yes                      yes                             no, flat            22.1 to 19.5                yes   
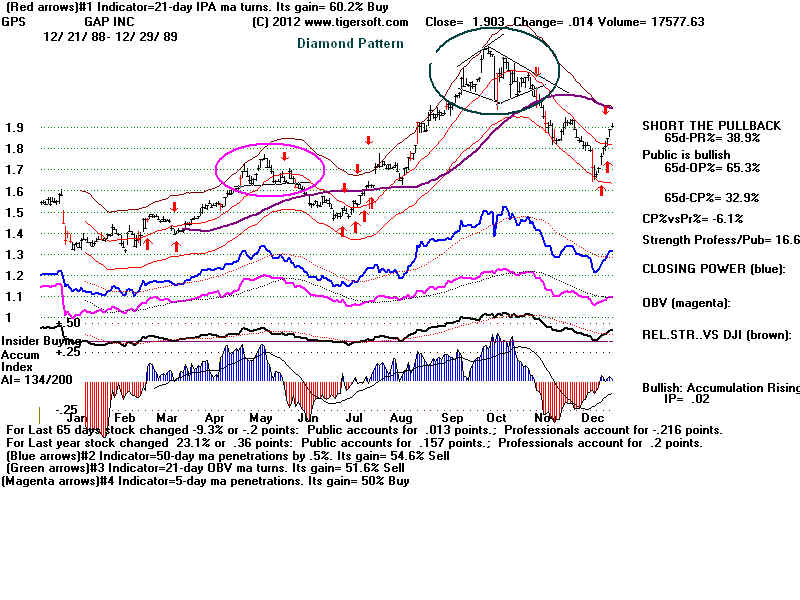
         GPS   June yes                      no                               no, flat             1.62 to 1.5                  no
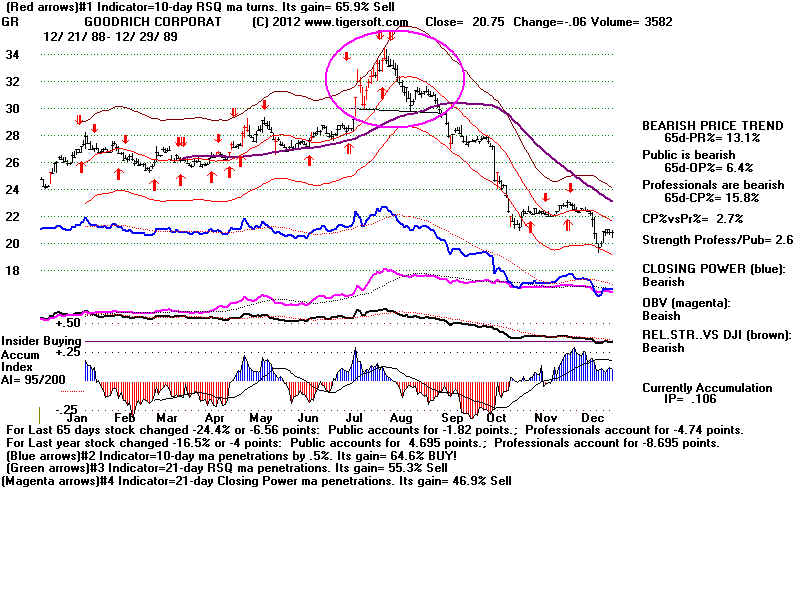
         GR    Sept  yes                      yes                             no, flat            
29.5 to 20                   no
                                      
Note heavy distribution on right shoulder
        
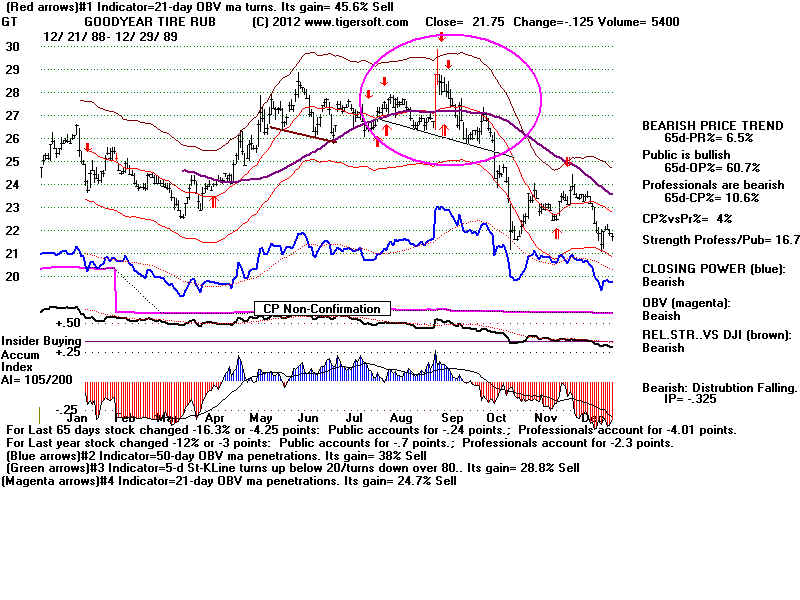
         GT    Sept  yes                      yes                             yes, falling      
25 to 21.5                   no
                                      
Note heavy distribution on right shoulder
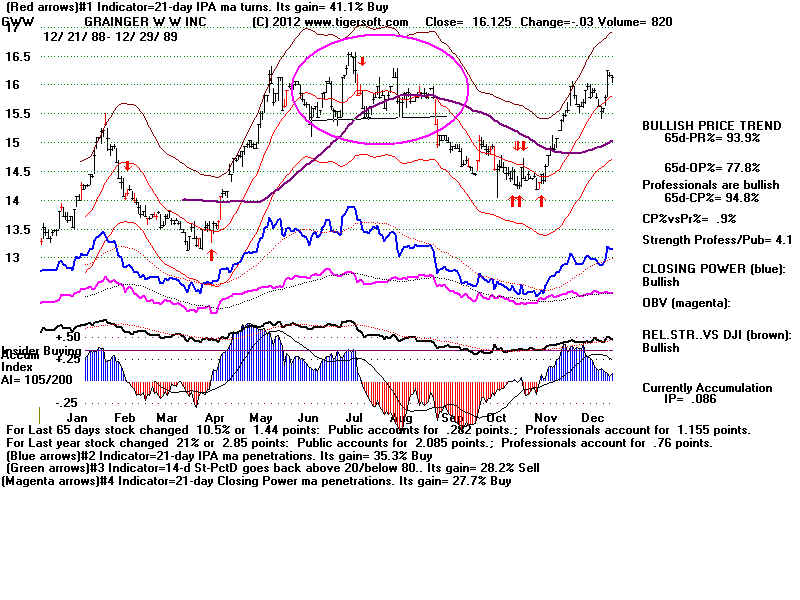
          GWW  Sept  yes                  yes                             no, flat            15.4 to 14.2                  no
                                     
Note heavy distribution on right shoulder
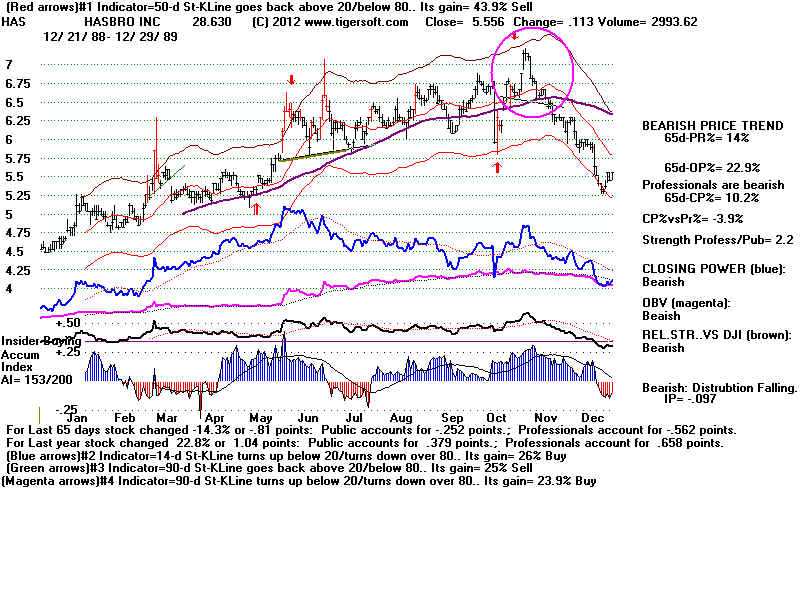
         HAS  Nov   yes                     yes                          no, falling         
6.3 to 5.3                    no
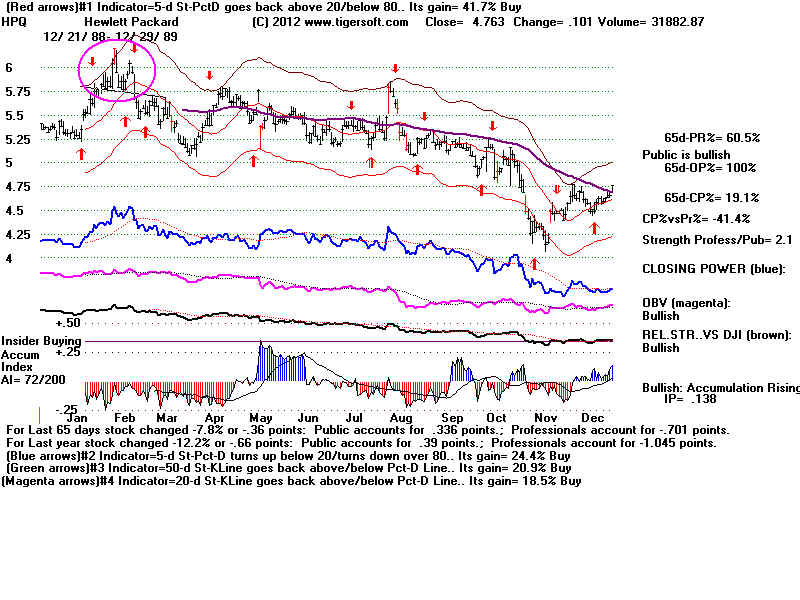
         HPQ   Feb   yes                      yes                          no, flat              5.6 to 5.2                    yes   
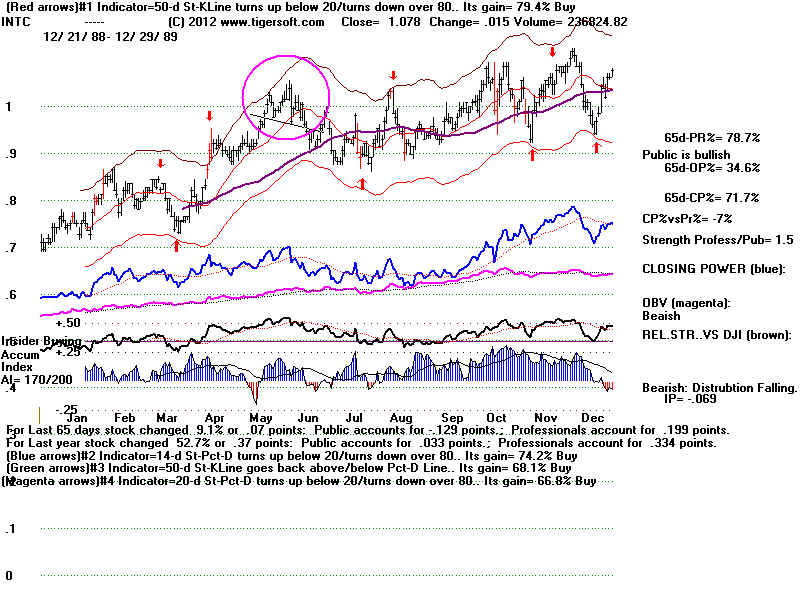
         INTC   June
no                        no                            yes, falling      .93 to .88                     yes  but failed
                           
IP21 = -.034 on breakdown
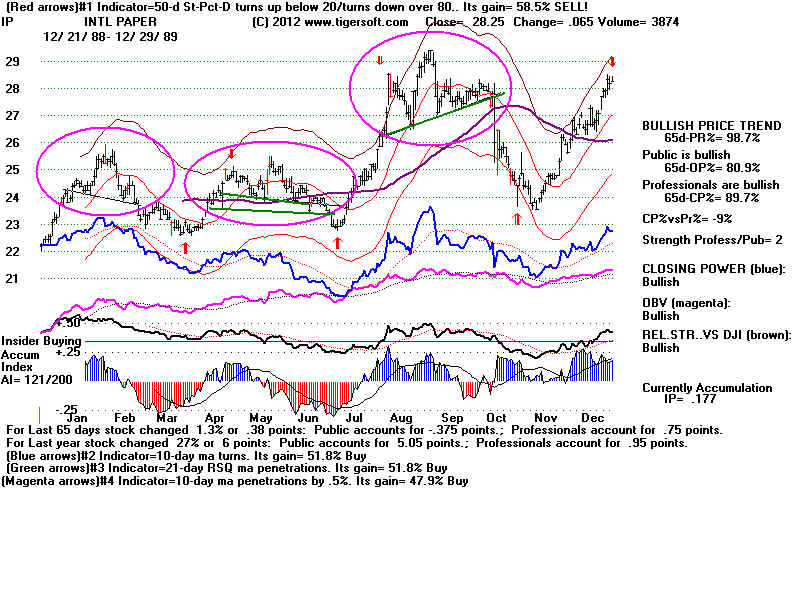
         IP         Feb  
no                      yes                           yes, flat          23.5 to 22.8                 yes but failed
                           
IP21 = -.169 on breakdown
         IP         June  
no                   yes                           no, flat            23.5 to 23.1                  no
                            
IP21 = -.161 on breakdown   
         IP         Oct yes                     yes                           yes, rising    
27.2 to 23.8             no
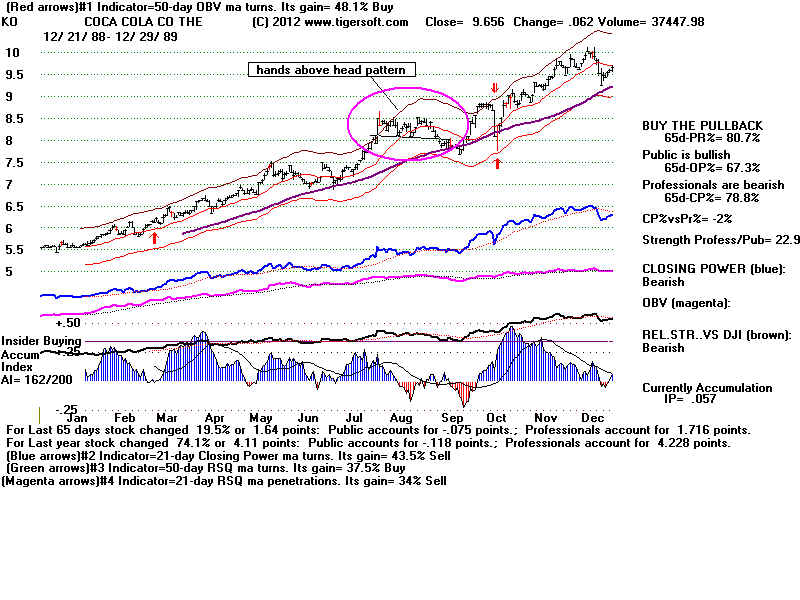
         KO     Sept
no                     no                            hands/above head  8 to 7.8                  no
                             
IP21 = -.02 on breakdown
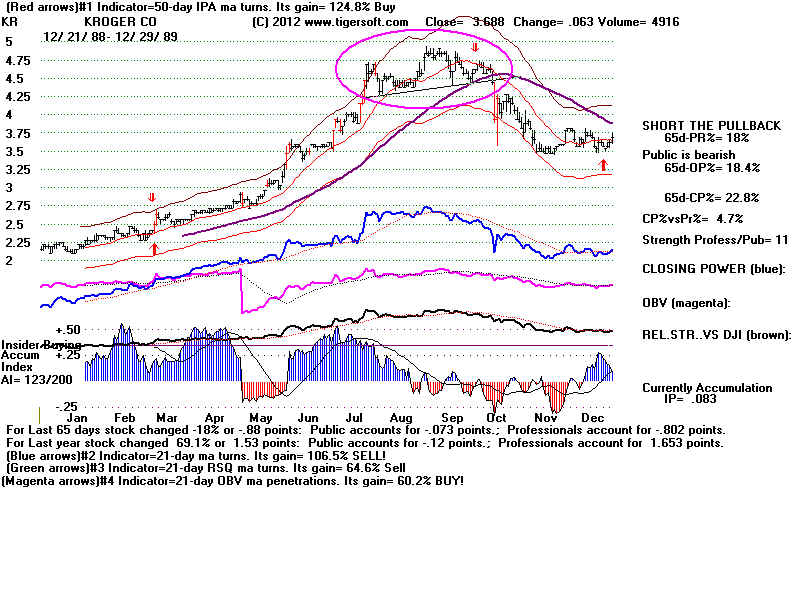
         KR    Oct   yes                    yes                          no, rising         
4.3 to 3.5                 no
                                   
   Accum turned very negative on breaking of necline.

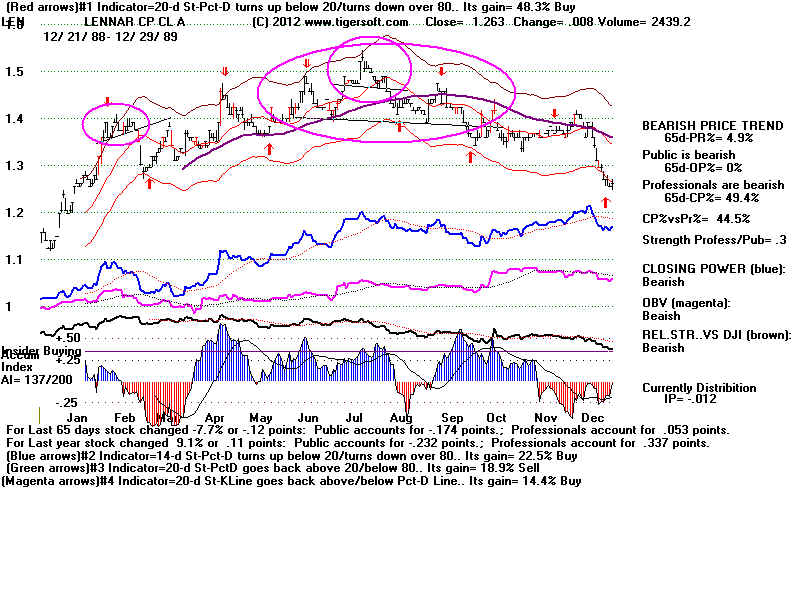
          LEN   Feb  yes                    no                           no, rising           1.6 to 1.28                   no
          LEN  Aug   yes                   yes                           yes, flat            1.45 to 1.25                  yes
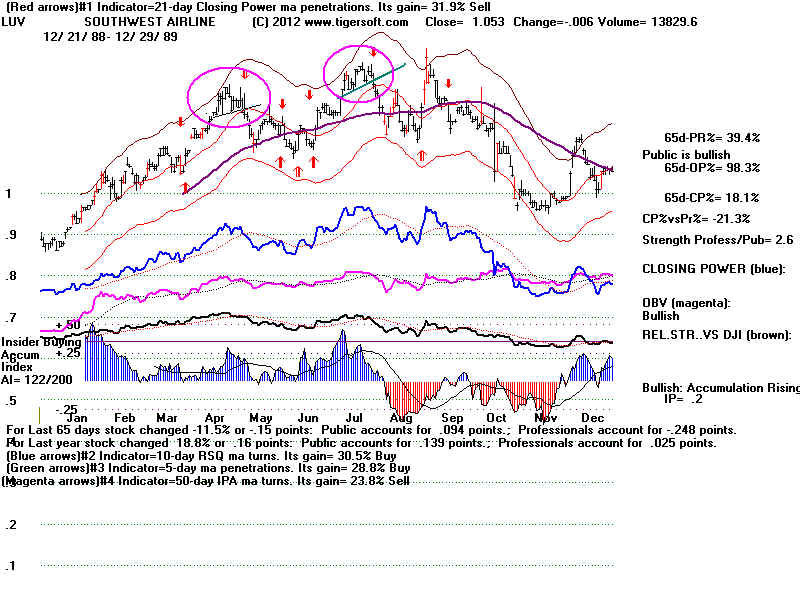
          LUV  May  yes                   no                            no, rising           1.21 to 1.12                 yes
          LUV  Aug   yes                   no                            no, rising           1.30 to 1.15                 yes
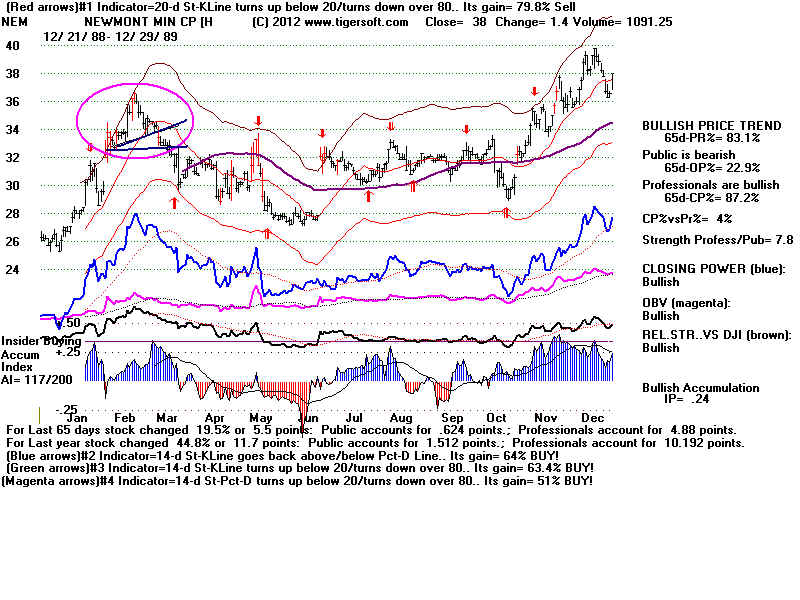
          NEM Feb  yes                    no                            no, rising         
32.1 to 27.6                yes
         
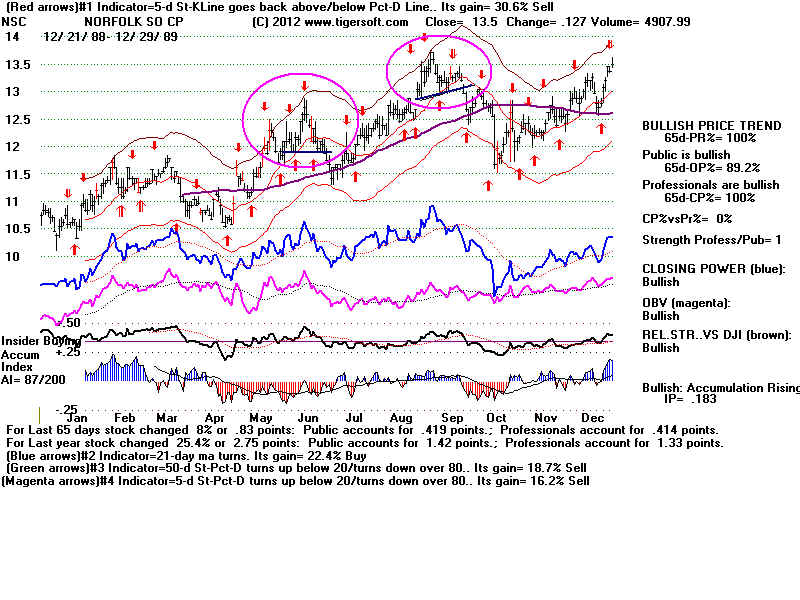
          NSC  June 
no                   no                            no, flat                11.9 to 11.4                 keeps rising
                          IP21 = -.048 on breakdown
          NSC  Sept yes                    no                            no, rising           13 to 11.6                   yes
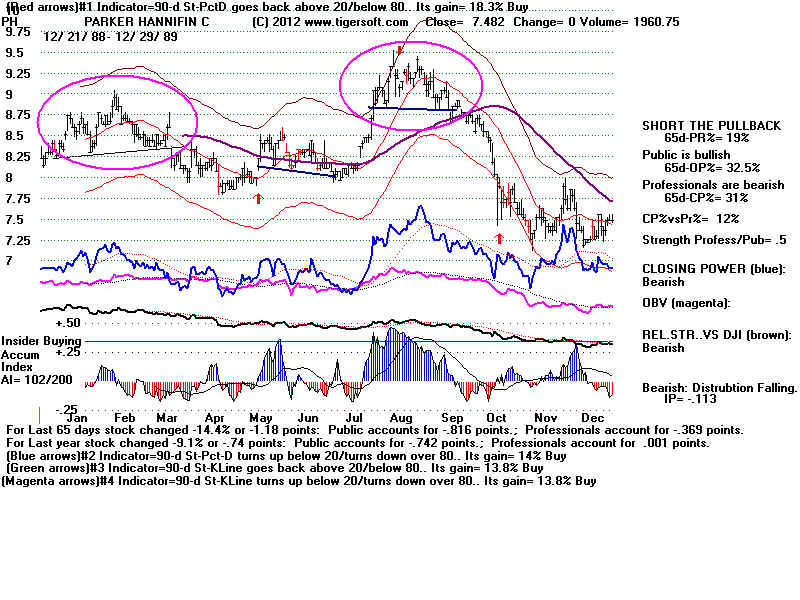
          PH    Mar
no                       yes                           no, rising           8.3 to 7.8                    yes but failed
                         
IP21 = +.055 on breakdown
          PH    Sept yes                    yes                           yes, flat             8.75 to 7.25                 yes
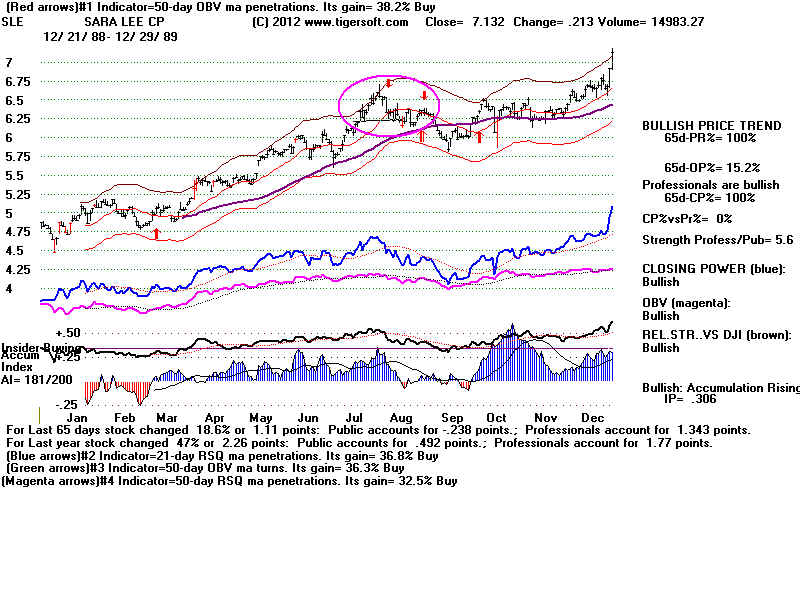
          SLE  Aug yes                     no                             no, flat              6.15 to 5.8                   yes
        
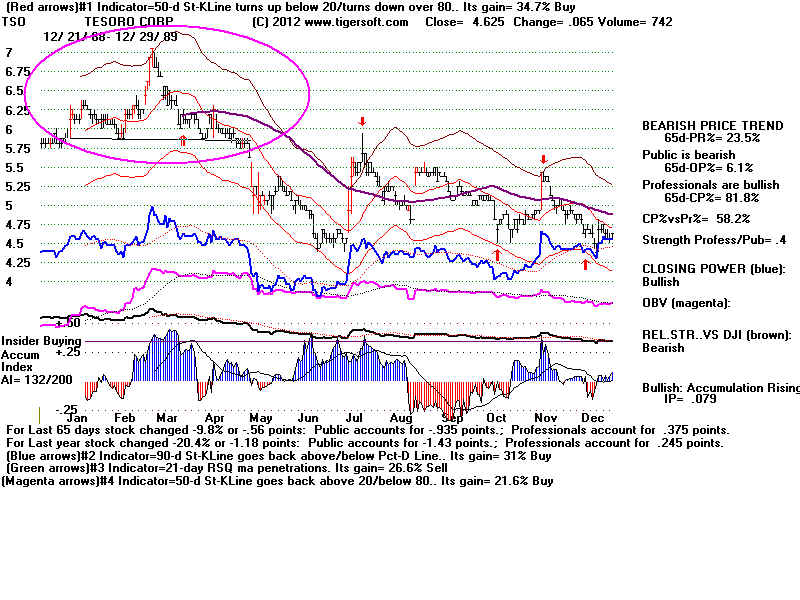
          TSO  May yes                   yes                           yes, flat          
  5.75 to 4.5             no
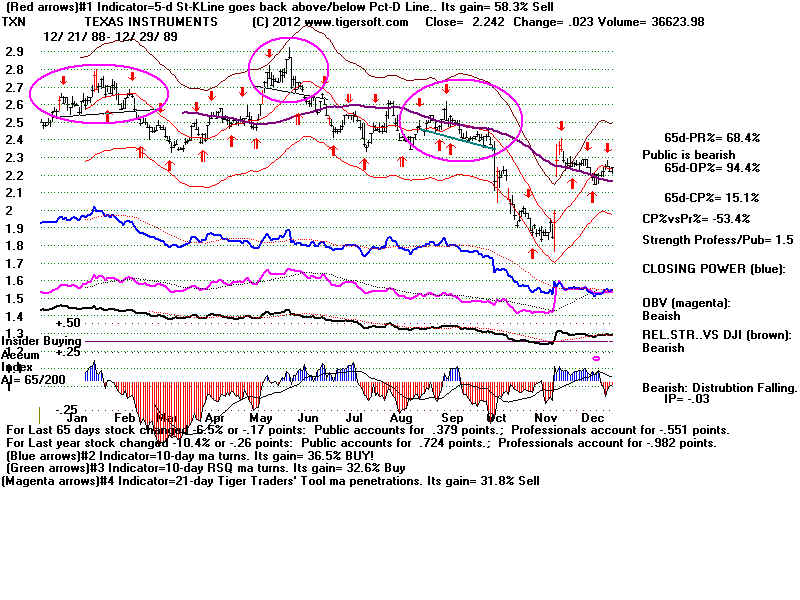
          TXN  Feb  yes                   yes                           yes, rising         2.53 to 2.35                 no
          TXN  June  yes                 yes                           no, falling         2.62 to 1.85                  yes
          TXN  Oct  yes                  yes     Continuation   yes, falling       2.32 to 1.85                 no
                                     
   Accum turned very negative on breaking of necline.   

           Only 11 of the 49 completed H/S patterns produced a decline of 15% or more.
           Pullbacks occurred in 4 cases of 11 before the low was made for the decline.

           5 of the 11 showed flat H/S necklines, 3 had a rising neckline, and in 2 instances
           the neckline was falling.  

           In 9 of the 11 more successful H/S patterns, the breaking of neckline occurred with
           the stock below the 65-dma at that time or a day or two later.  

           In 8 cases the IP21 was negative on the breakdown below the neckline.
           All but one of these had an IP21 below -.05.

           In only 3 of the 11 did the Tiger chart show red high volume.
          
          
                                           15% Declines or More below Neckline

           IP21 <0               IP21 on          65-dma broken       Classic &         3 month                   Pull Back
           on Breakdown    breakdown    and turned down     Symetrical       decline potential     before low
         ------------------------------------------------------------------------------------------------------------------------------------
           AAPL  Dec  yes   
-.054          yes                               yes, flat            10.5 to 8.5             no  
           BCR  June yes     
-.145           no                                no, flat              11.8 to 10            yes
           BK  Sept     yes    
-.175          yes                                yes, rising        6.3 to 4.7             yes
                                            
Red high volume on neckline break.
           DNB Oct    yes     
 -.008          yes                             no, flat              10.15 to 7.54         yes  
           GR    Sept  yes       
-.094           yes                             no, flat             29.5 to 19.69          no
                                      
Note heavy distribution on right shoulder        
       
            GT    Sept  yes      
-.187        yes                             yes, falling       25 to 21.38                  no
                                      
Note heavy distribution on right shoulder
            HAS  Nov   yes      +.199        yes                          no, falling         
6.44 to 5.26                    no
            IP         Oct yes     
-.113         yes                           yes, rising     27.2 to 23.8                      no
            KR     Oct   yes     
-.327    yes                          no, rising          4.3 to 3.5                             no
                                   
   Accum turned negative on right shoulder
                                      Red high volume on neckline break.
            NEM Feb  yes      +.069       no                            no, rising          32.1 to 27.6                  yes  
                                     
Red high volume on neckline break.   
   
            TSO  May yes       +.052      yes                           yes, flat          
  5.81  to 4.5                      no


AAPL89.jpg (123763 bytes)
ADM89.BMP (1440054 bytes)
APD89.jpg (124373 bytes)
 BA.BMP (1440054 bytes)

BCR89.jpg (117893 bytes)
BK89.jpg (122312 bytes)
 CEG.BMP (1440054 bytes)

CI.BMP (1440054 bytes)

tCSC89.JPG (122921 bytes)
 CSX.BMP (1440054 bytes)

CTL.BMP (1440054 bytes)

DE89.jpg (116147 bytes) DNB.BMP (1440054 bytes)

 DOW89.jpg (122628 bytes)
DUK.BMP (1440054 bytes)
ED.BMP (1440054 bytes)
EFX89.jpg (119427 bytes)
                   Neither of these patterns are counted because the slope of the neckline
                   was considered too steep.

F.BMP (1440054 bytes)
FMC.BMP (1440054 bytes)
GCI.BMP (1440054 bytes)
GE.BMP (1440054 bytes)
GPS.BMP (1440054 bytes)
GR.BMP (1440054 bytes)
GT.BMP (1440054 bytes)
GWW.BMP (1440054 bytes)
HAS.BMP (1440054 bytes)
HPQ.BMP (1440054 bytes)
INTC.BMP (1440054 bytes)
IP.BMP (1440054 bytes)
KO.BMP (1440054 bytes)
KR.BMP (1440054 bytes)
LEN.BMP (1440054 bytes)
LUV.BMP (1440054 bytes)
NEM.BMP (1440054 bytes)
NSC.BMP (1440054 bytes)
PH.BMP (1440054 bytes)
SLE.BMP (1440054 bytes)
TSO.BMP (1440054 bytes)
TXN.BMP (1440054 bytes)
                      OTHER CHARTS FROM 1989 - Not included in H/S Study
FSCSX.BMP (1440054 bytes)
FSDAX.BMP (1440054 bytes)
FSELX.BMP (1440054 bytes)
FSLBX.BMP (1440054 bytes)
FSPTX.BMP (1440054 bytes)