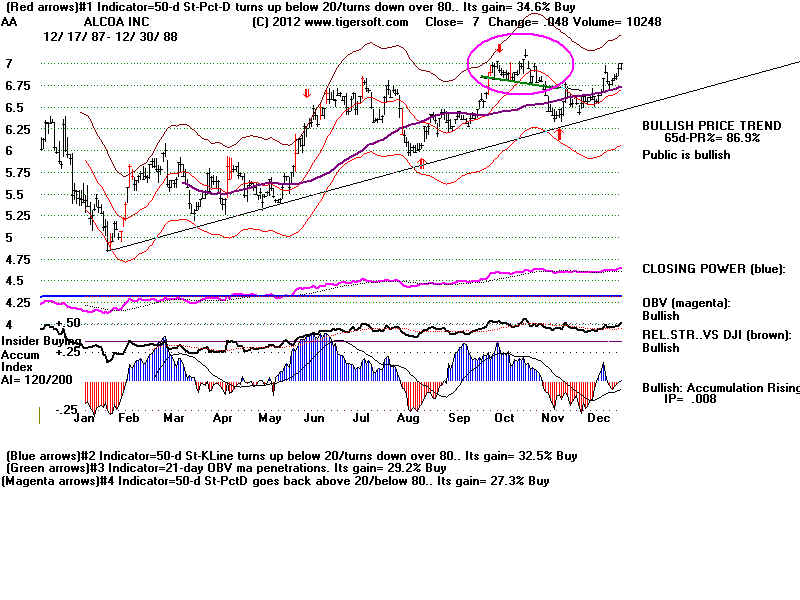
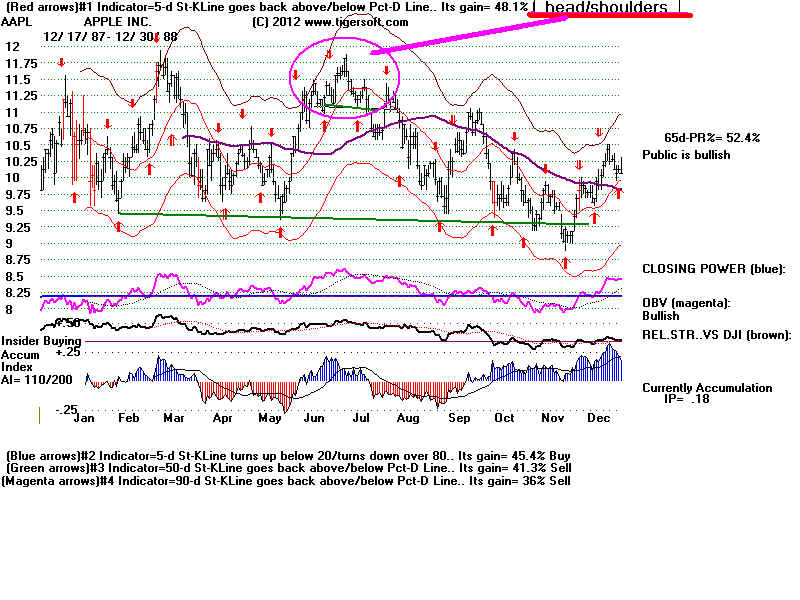
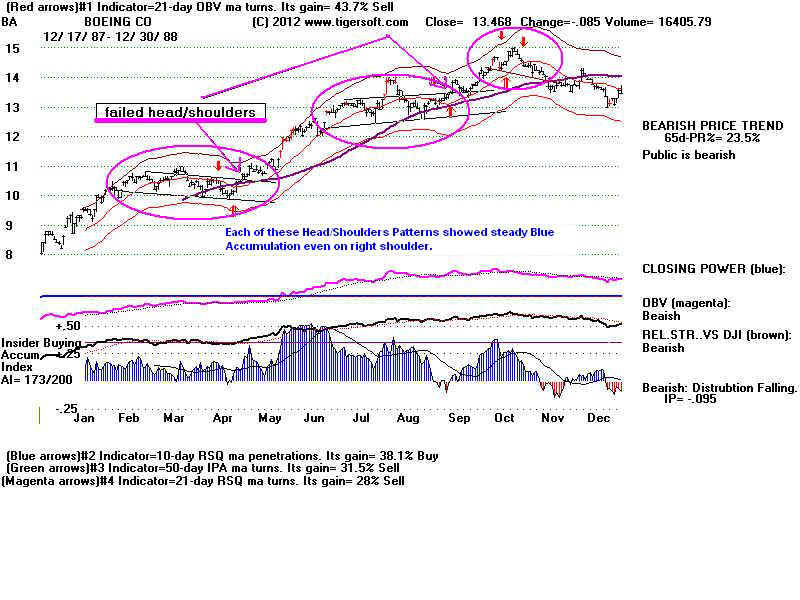
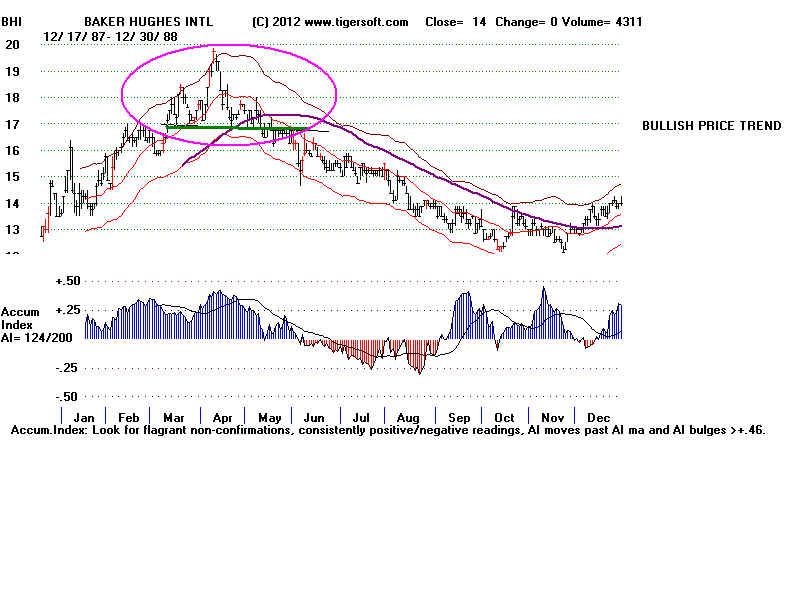
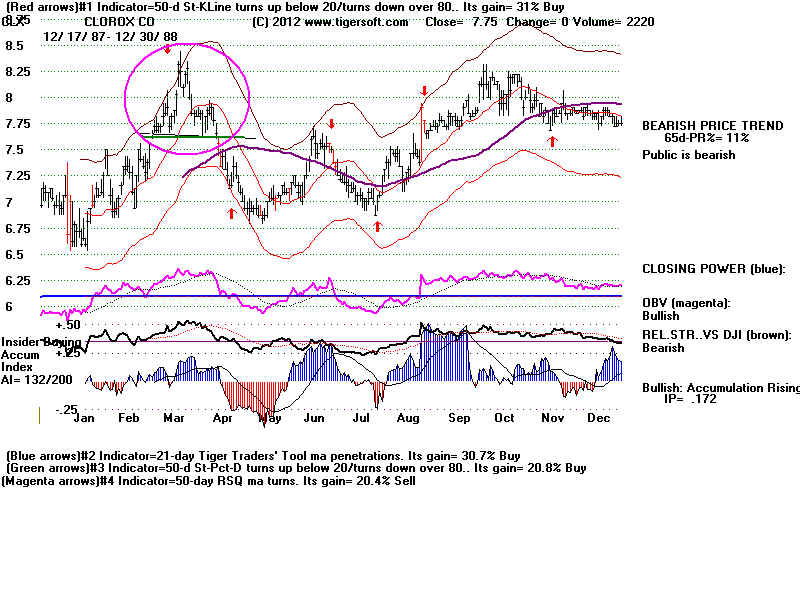
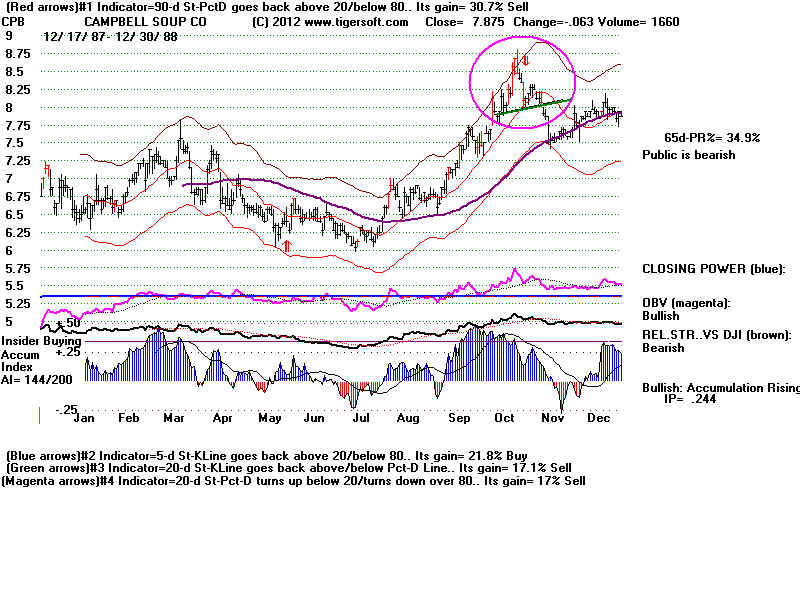
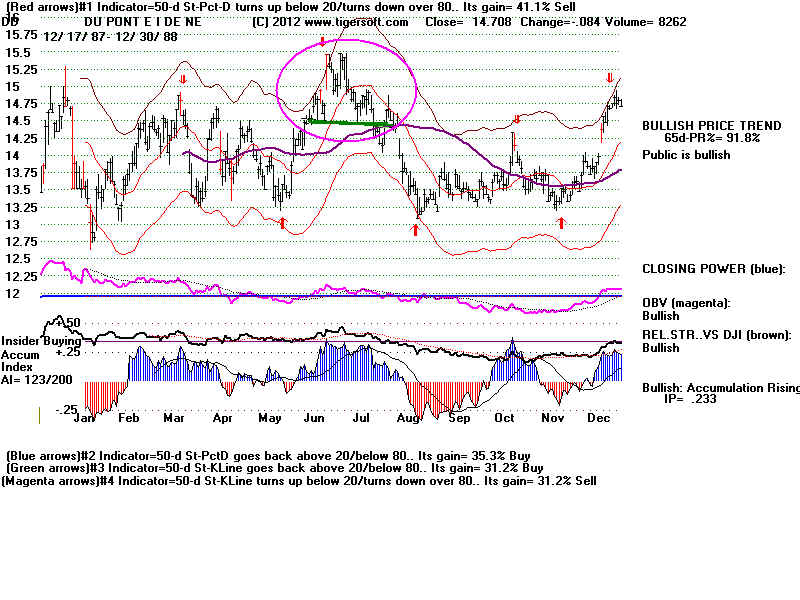
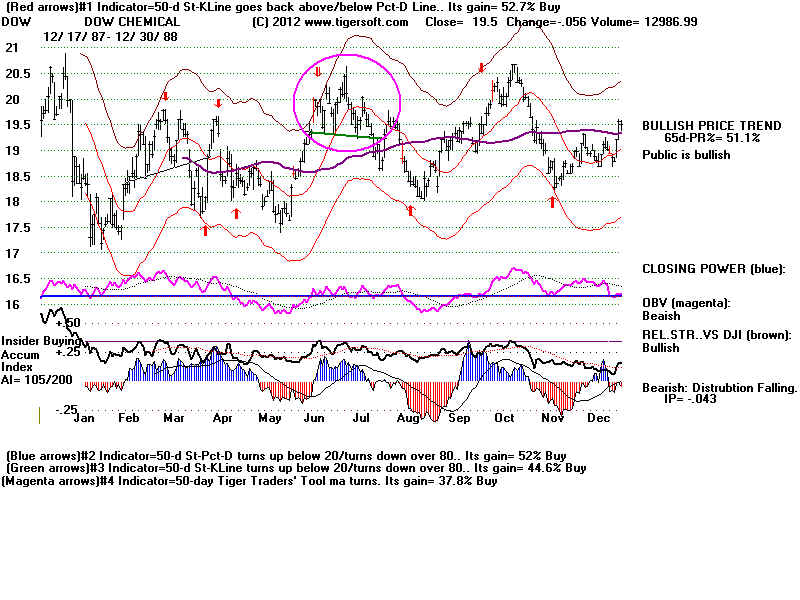
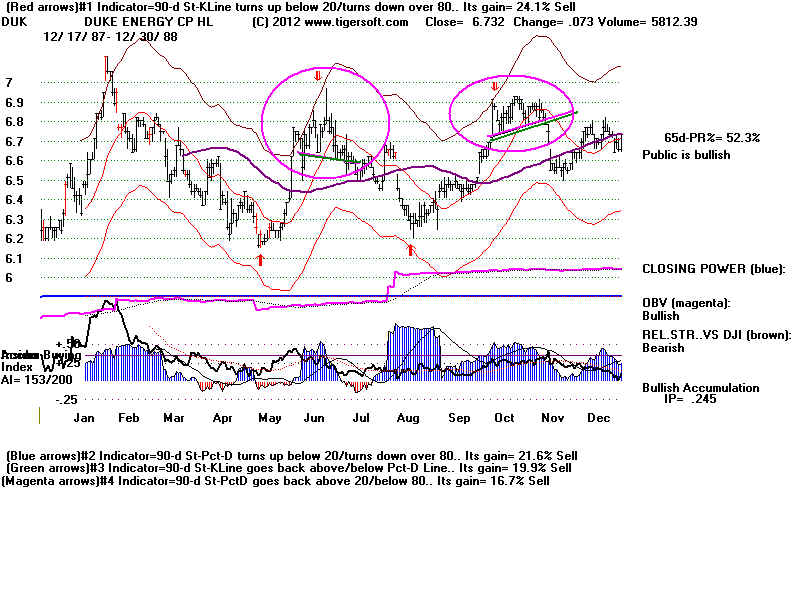
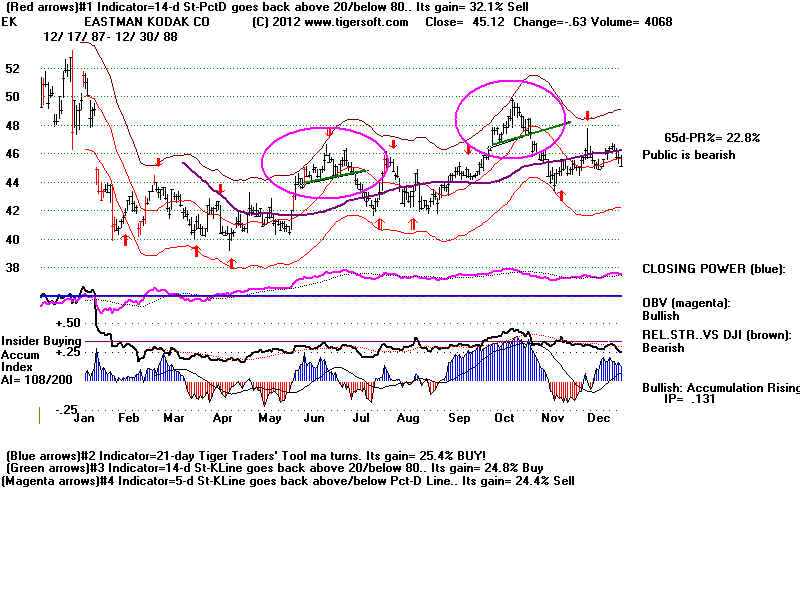
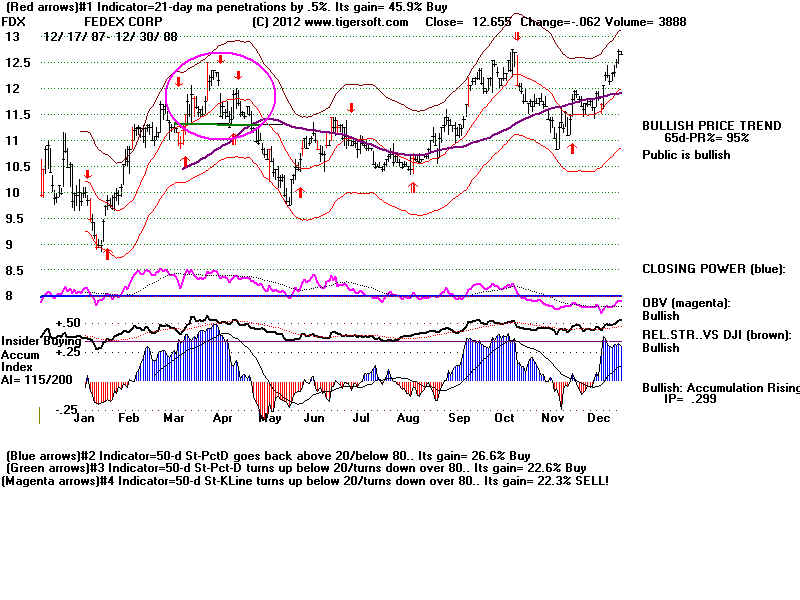
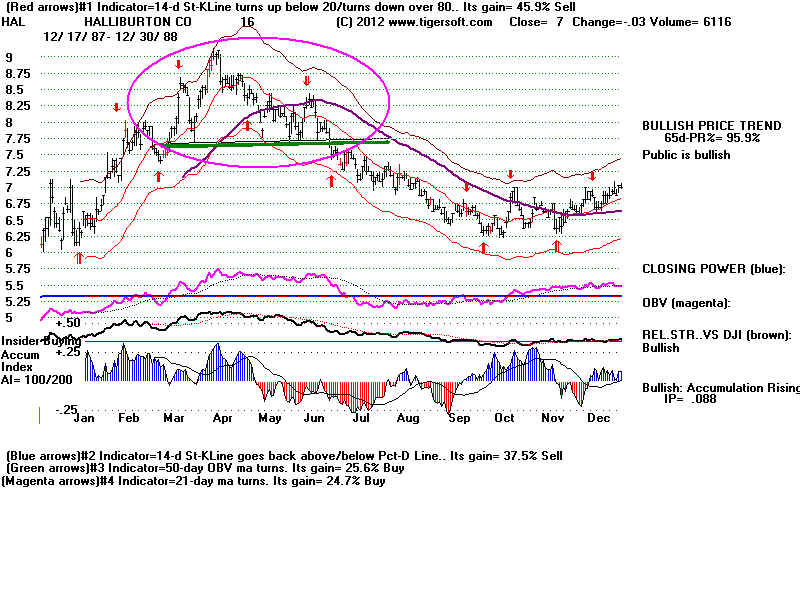
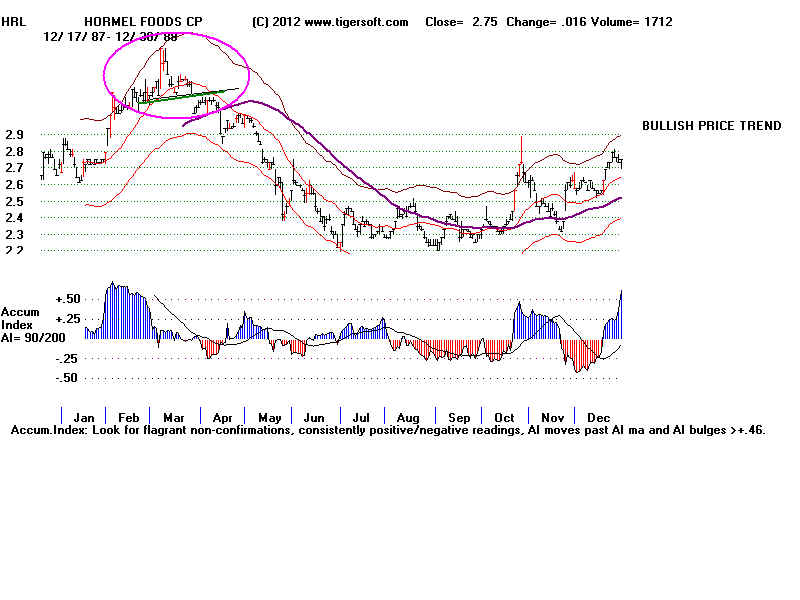
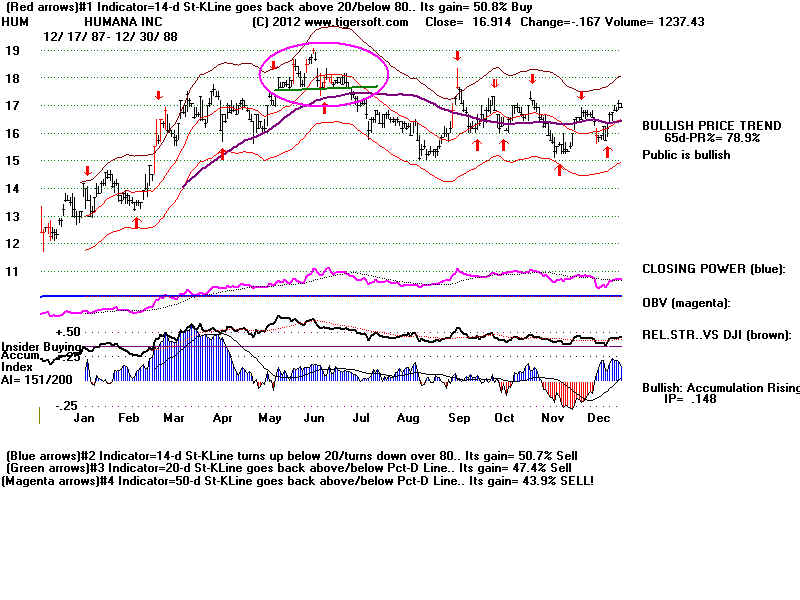
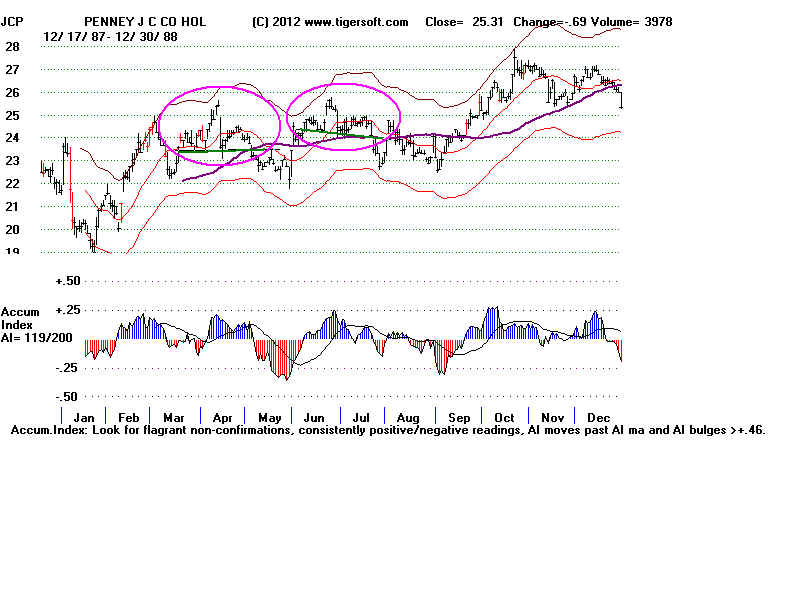
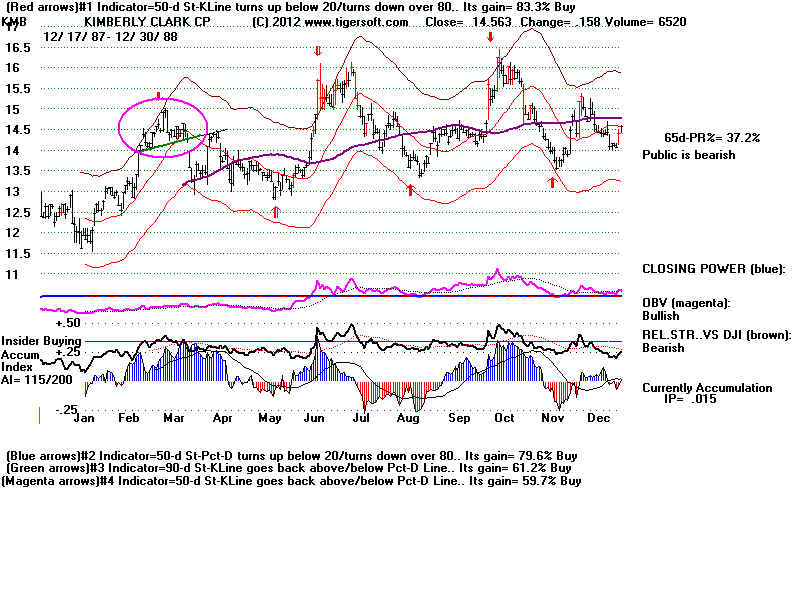
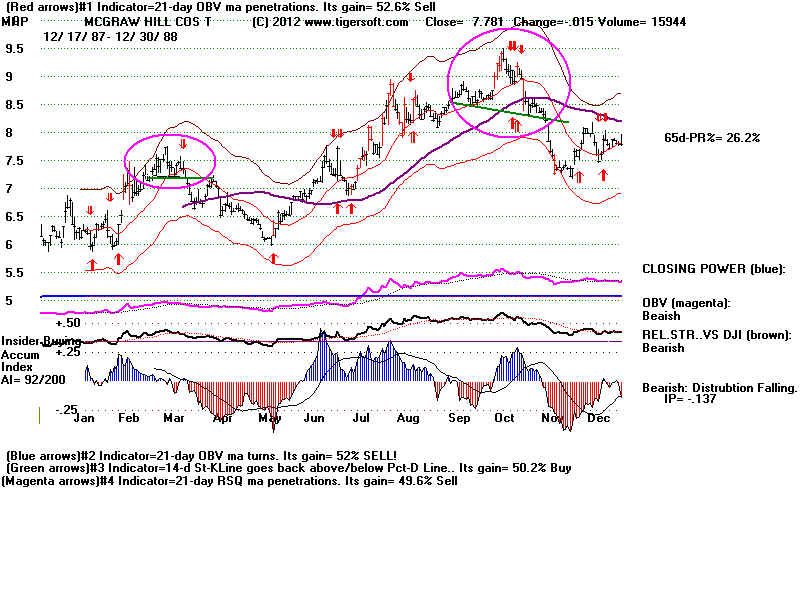
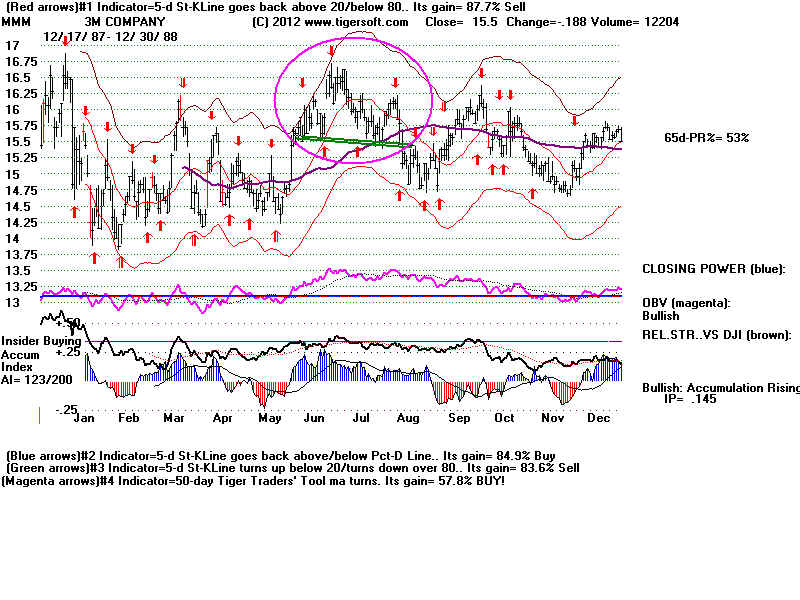
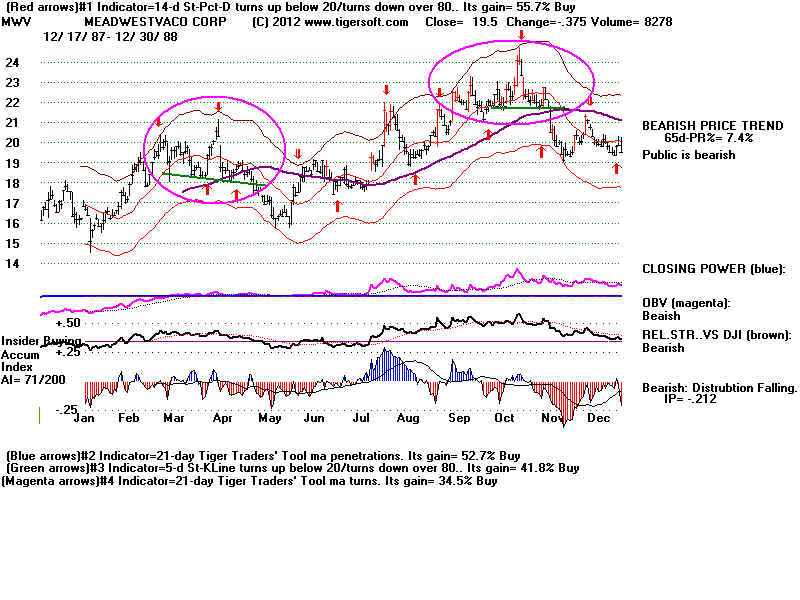
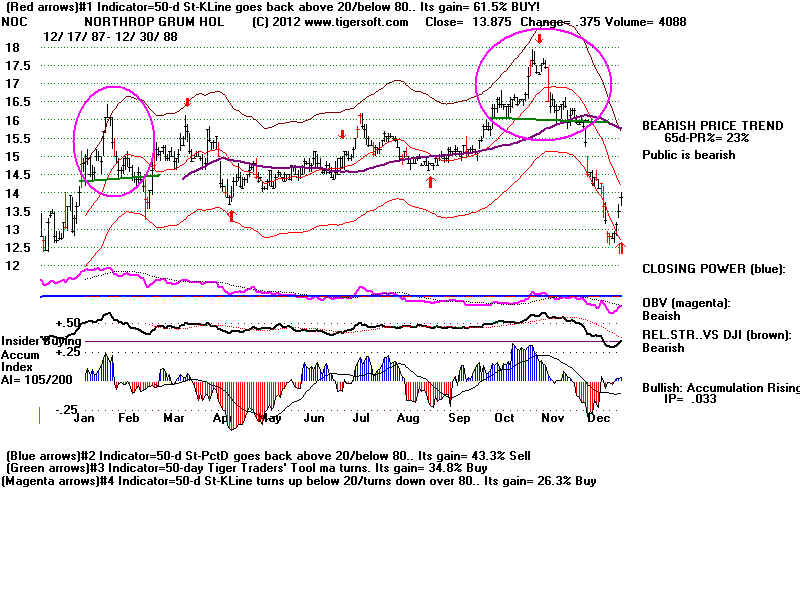
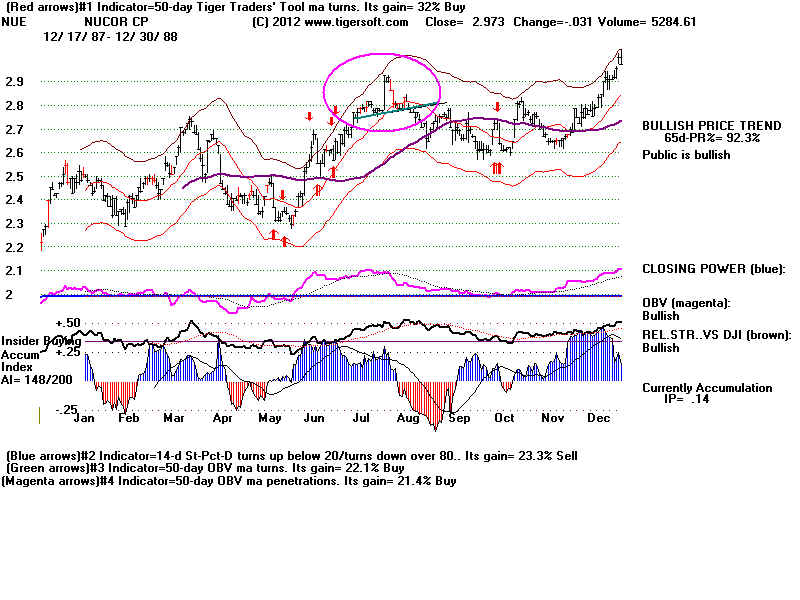
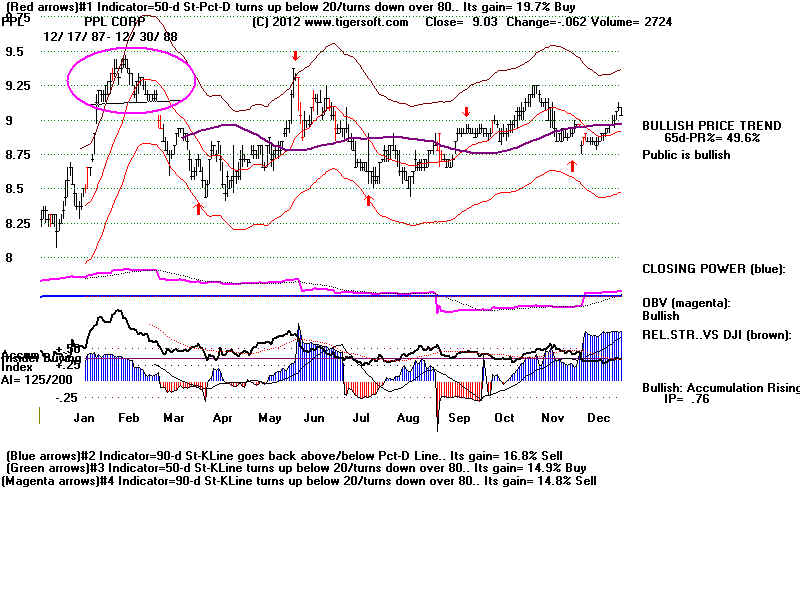
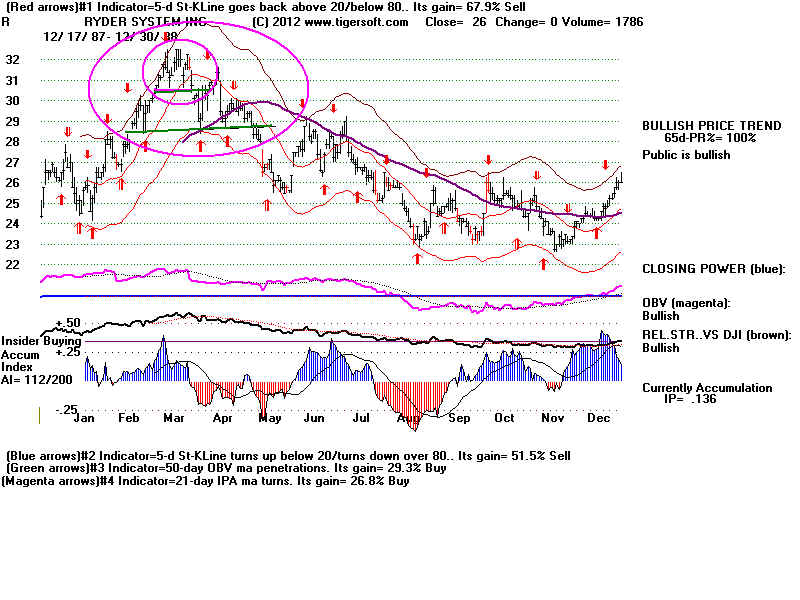
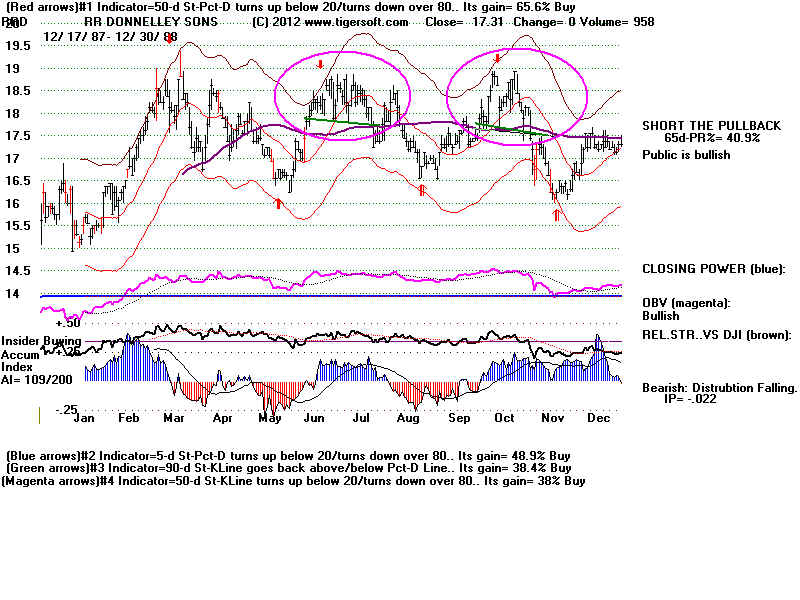
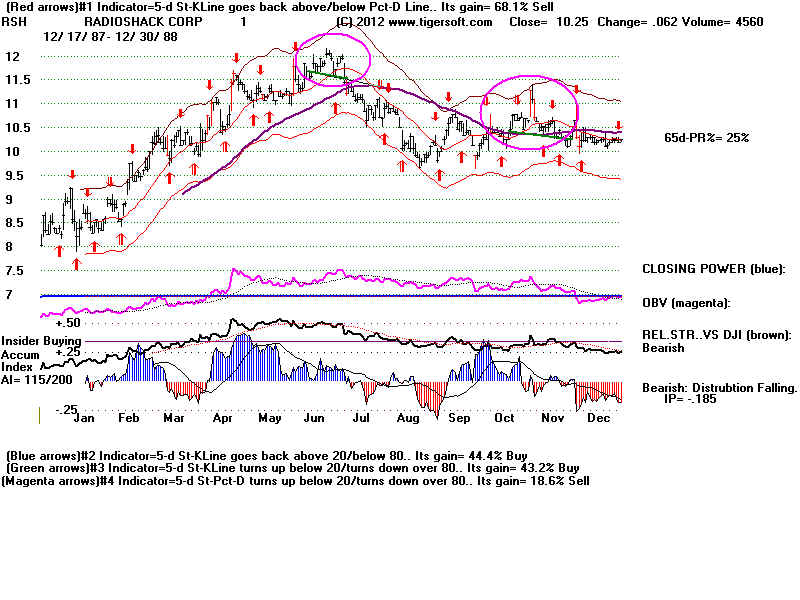
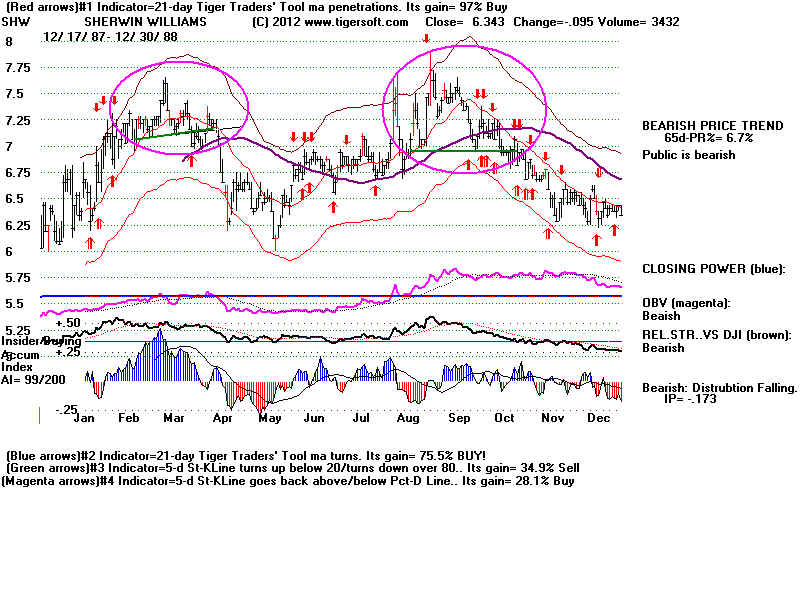
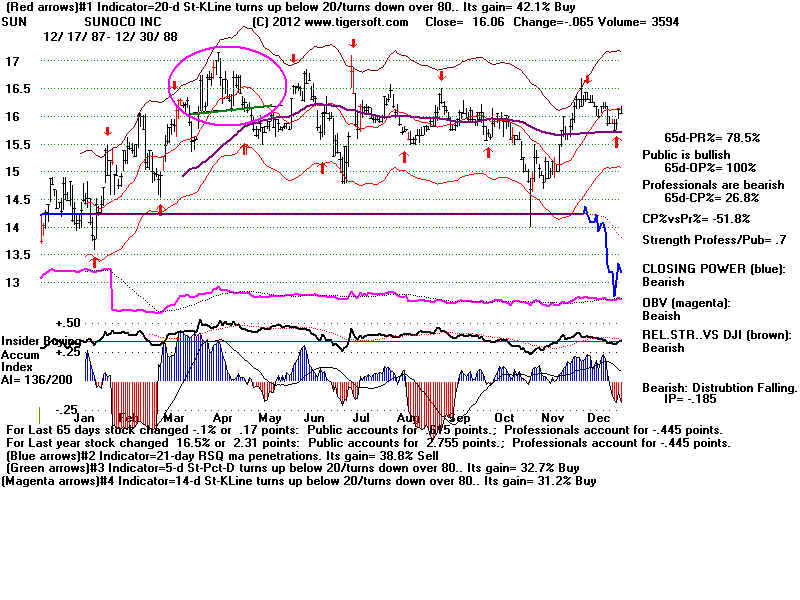
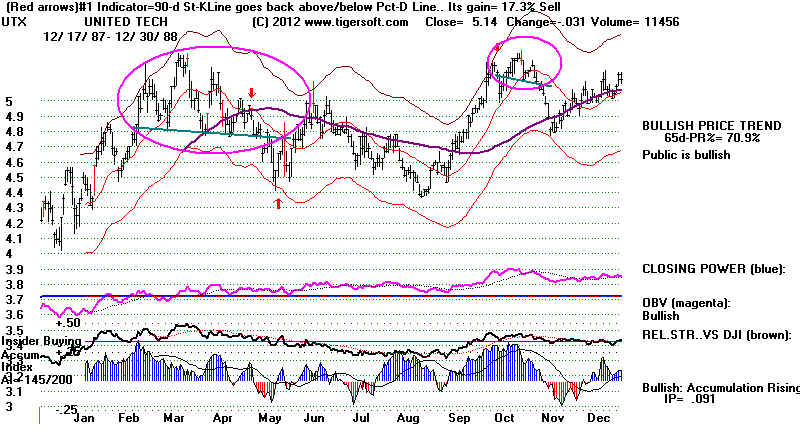
Head and Shoulders or Hands-the Head Patterns are seen below in 28 of the 227 SP-500
stocks from 1988.
There were 36 completed head/shoulders patterns identified here and circled in the charts.
(BA has two incomplete H/S patterns circled to emphasize the importance of waiting
for the pattern to be completed when there is heavy blue Accumulation. )
20 of the 36 completed head/shoulders pattterns show pull-backs to
neckline before the minimum downside objective was reached.
Of these 20 pull-backs, in 14 cases, the stock turned down and reached
its mimium downside objective, the height of the H/S pattern from peak to neckline
subtracted from the neckline where the latter was broken.
Only 6 of the 36 did not fall at least to their minimum downside objective.
But most of the declines were small and ended abruptly. Remember, these patterns
are most potent when there has previously been a big advance. They need something
to reverse. October 1987 had already achieved that.
Mininimum 65-dma broken Classic & 3 month Pull Back
Objective Met and turned down Symetrical decline potential before low
--------------------------------------------------------------------------------------------------------------------
AA yes no no, flat 6.7 to 6.4 after low
AAPL yes no yes, flat 11 to 9.5 yes
BA yes no yes, falling 13.9 to 13. yes
BHI yes yes no, flat 16.8 to 12.5 yes
CLX yes yes yes, flat 7.5 to 6.8 after low
CPB no no yes, rising 8 to 7.5 after low
DD yes no yes, flat 14.4 to 13.2 yes
DOW yes no no, flat 19.1 to 18.05 yes
DUK yes no no, falling 6.55 to 6.3 yes
DUK yes no no, rising 6.75 to 6.5 after low
EK yes no no, rising 44 to 42 after low
FDX yes yes yes 11.25 to 9.7 after low
HAL yes yes no, flat 7.5 to 6.25 yes
HRL yes no yes 3.1 to 2.2 yes
HUM yes yes no, flat 17.5 to 15 after low
JCP yes yes yes, flat 23.2 to 22 after low
JCP yes yes no, flat 23.5 to 22.8 after low
KMB yes no no, flat 14 to 12.9 after low
MGP yes no yes, flat 7.1 to 6 yes
MGP yes yes yes, falling 8.1 to 7.2 after low
MMM no yes yes, flat 15.3 to 14.75 after low
MWV no yes no, falling 17.7 to 16.0 after low
MWV yes yes no, flat 21.5 to 19.2 after low
NOC no no yes, flat 14.2 to 13.5 after low
NOC yes yes yes, flat 16.0 to 12.6 no (a hesitation at neckline)
NUE yes no yes, flat 2.75 to 2.6 yes
PPL yes no no, flat 8.75 to 8.3 after low
R yes yes no, flat 28 to 23 yes
RRD no yes no, flat 17.6 to 16.6 yes
RRD yes yes no, flat 17.5 to 16.1 yes
RSH yes yes no, falling 11.5 to 9.7 yes (only 1 day)
SHW no yes yes, flat 7.1 to 6.1 yes
SHW yes no no, flat 6.8 to 6.3 yes
SUN no yes no, flat 16 to 14.9 yes
UTX yes no no, flat 4.7 to 4.3 yes
UTX yes yes no, falling 5.05 to 4.8 after low
Only 6 of the 36 completed H/S patterns produced a decline of 15% or more.
Pullbacks occurred in all these cases before the low was made for the decline.
5 of the 6 showed flat H/S necklines. In 4 of the 6 the breaking of neckline
occurred with the stock below the 65-dma at that time or a day or two later.
In 4 cases the IP21 was negative on the breakdown below the neckline.
15% Declines or More
IP21 <0 65-dma broken Classic & 3 month Pull Back
on Breakdown and turned down Symetrical decline potential before low
--------------------------------------------------------------------------------------------------------------------
BHI no yes no, flat 16.8 to 12.5 yes
IP21 was positive on neckline breakdown
HRL yes no yes. flat 3.1 to 2.2 yes
IP21 was negative on neckline breakdown
MGP yes no yes, flat 7.1 to 6 yes
IP21 was negative on neckline breakdown
NOC yes yes yes, flat 16.0 to 12.6 no (a hesitation at neckline)
IP21 was negative on neckline breakdown
R yes yes no, flat 28 to 23 yes
IP21 was negative on neckline breakdown
RSH no yes no, falling 11.5 to 9.7 yes (only 1 day)
IP21 was slightly positive on neckline breakdown
