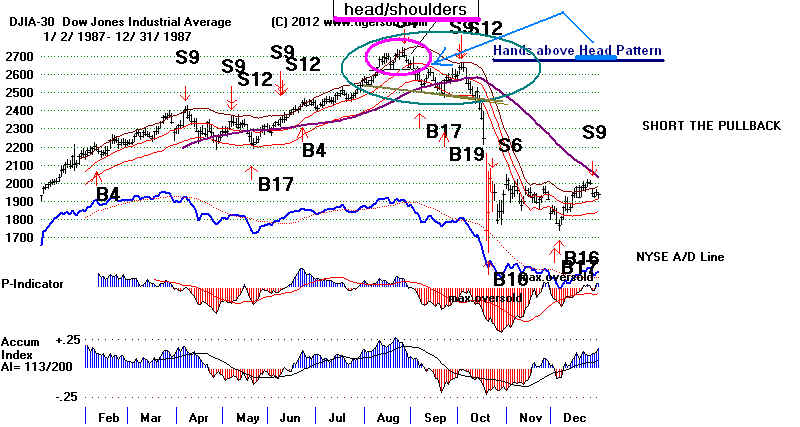
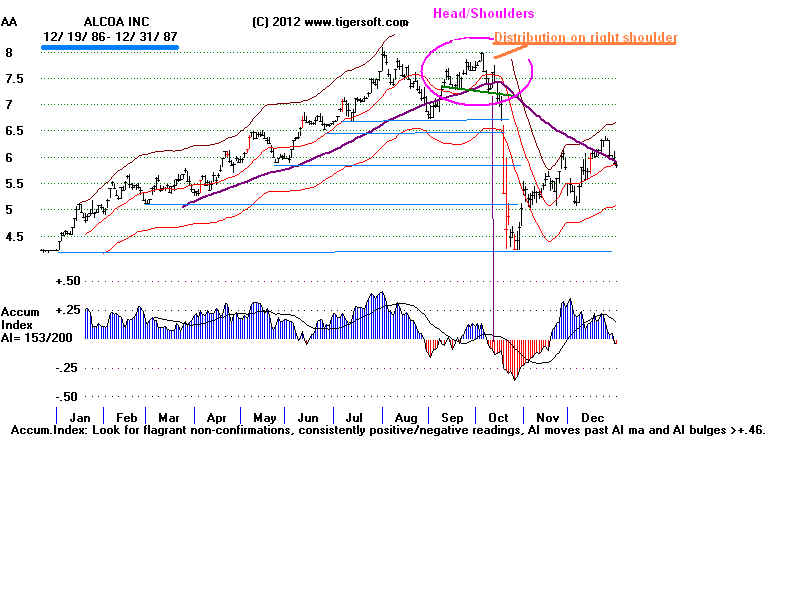
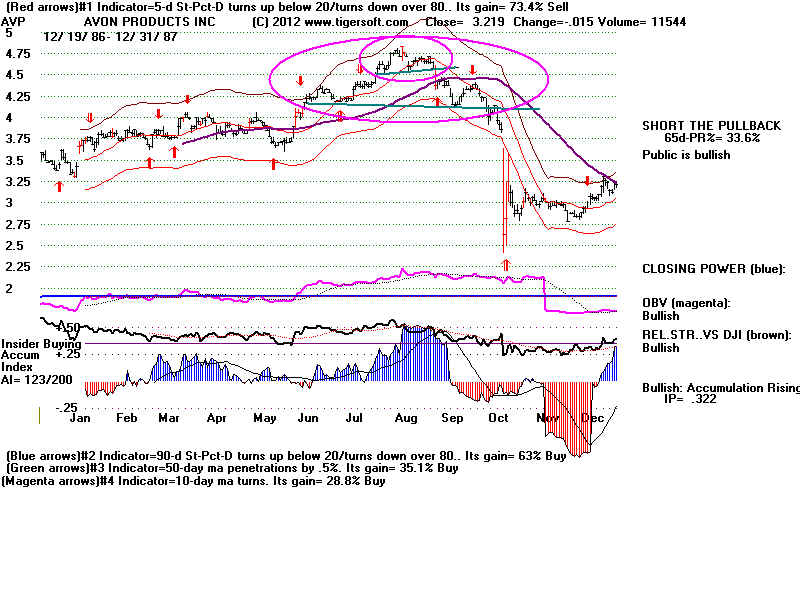
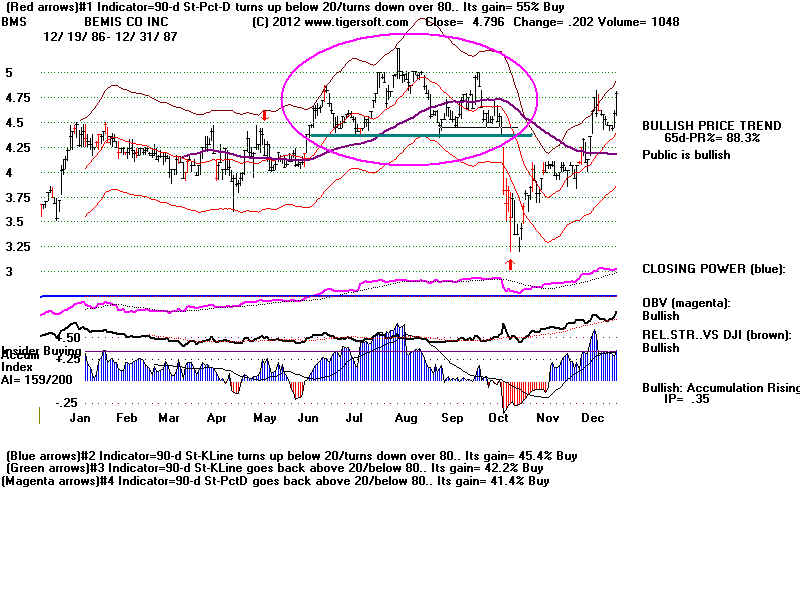
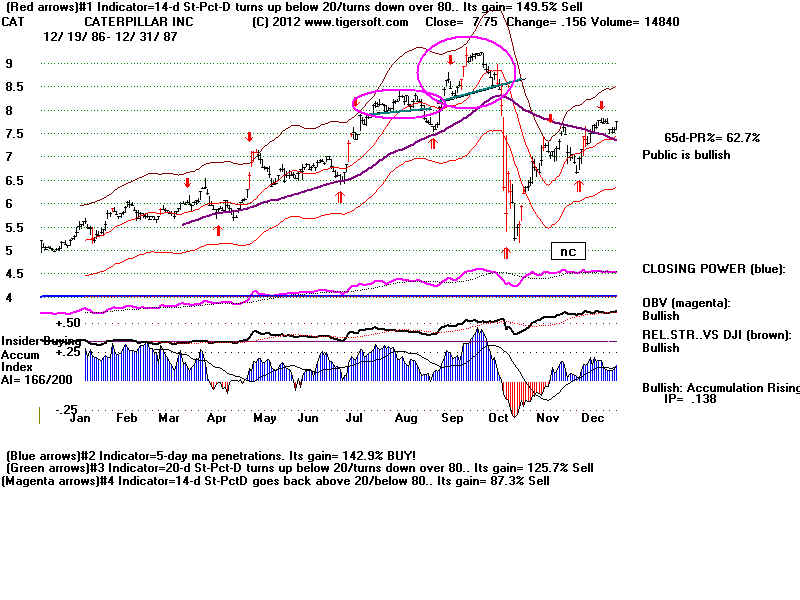
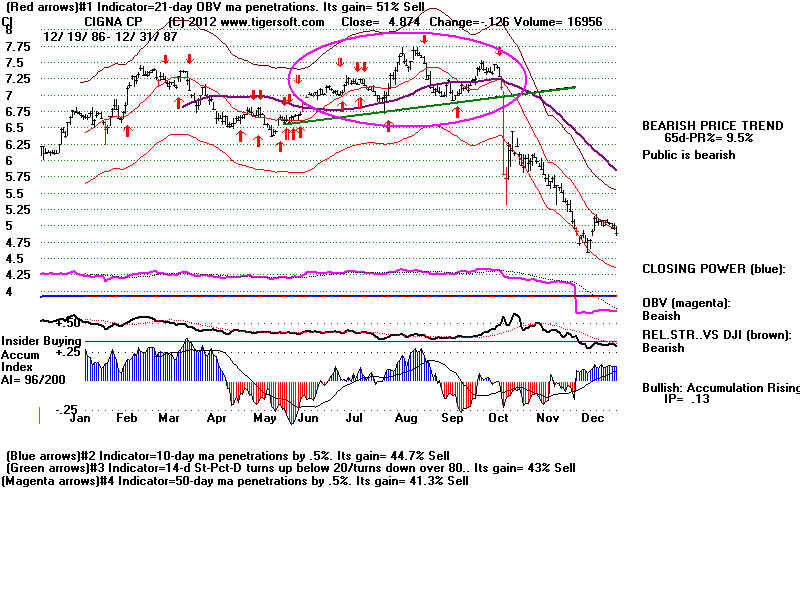
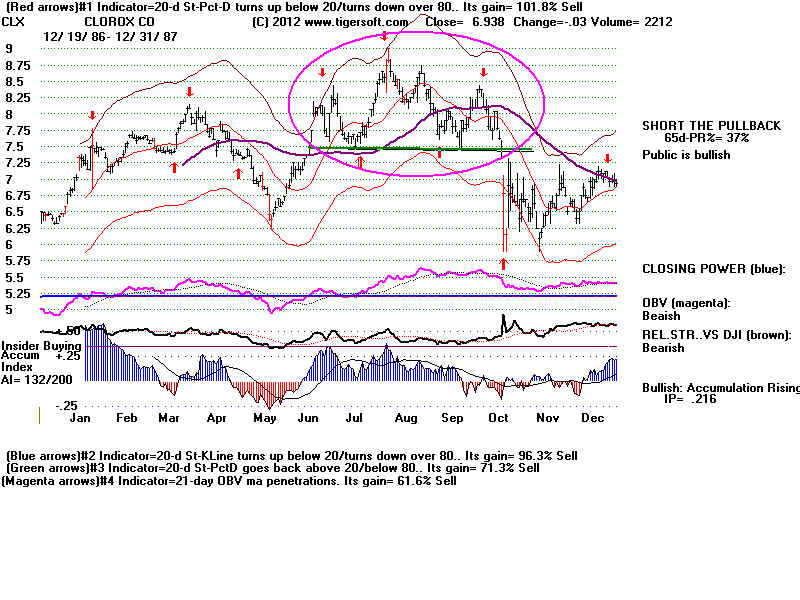
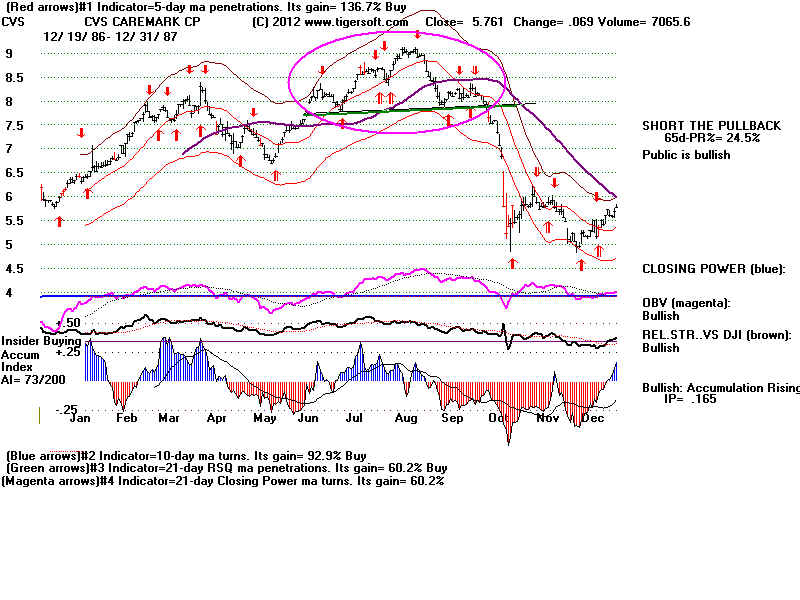
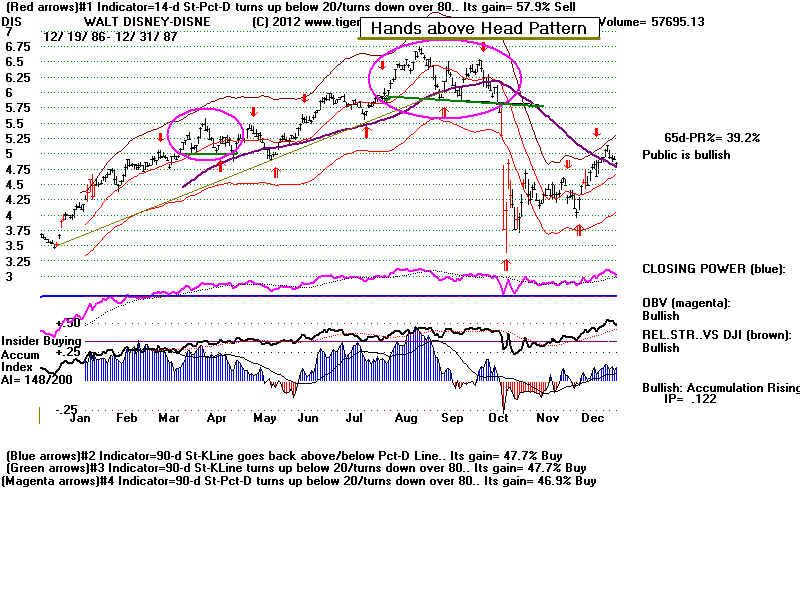
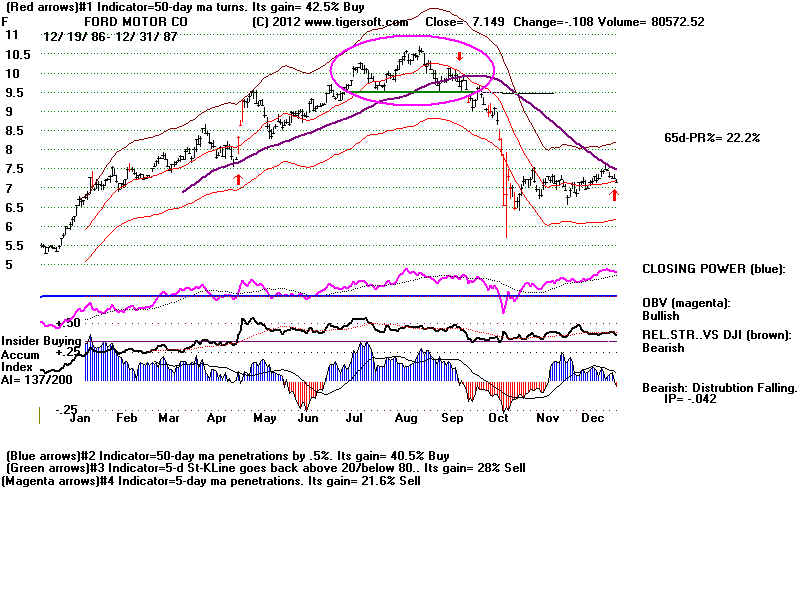
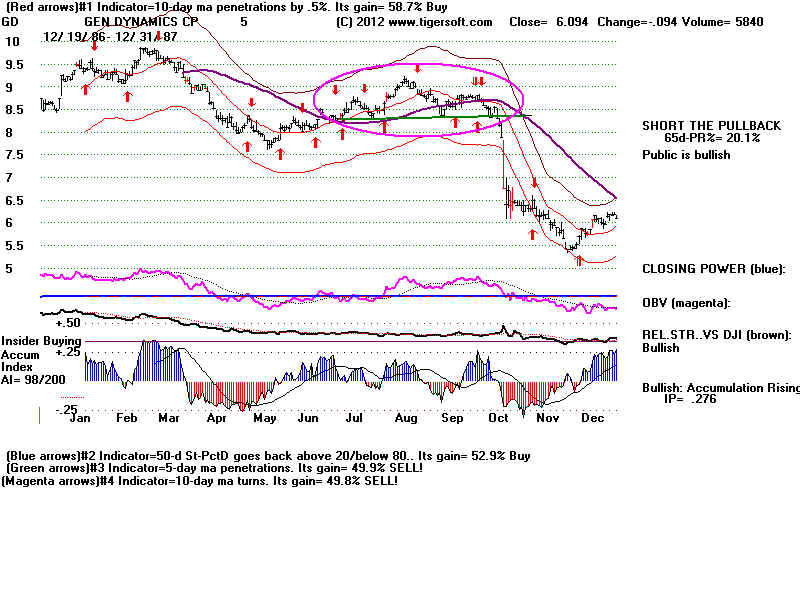
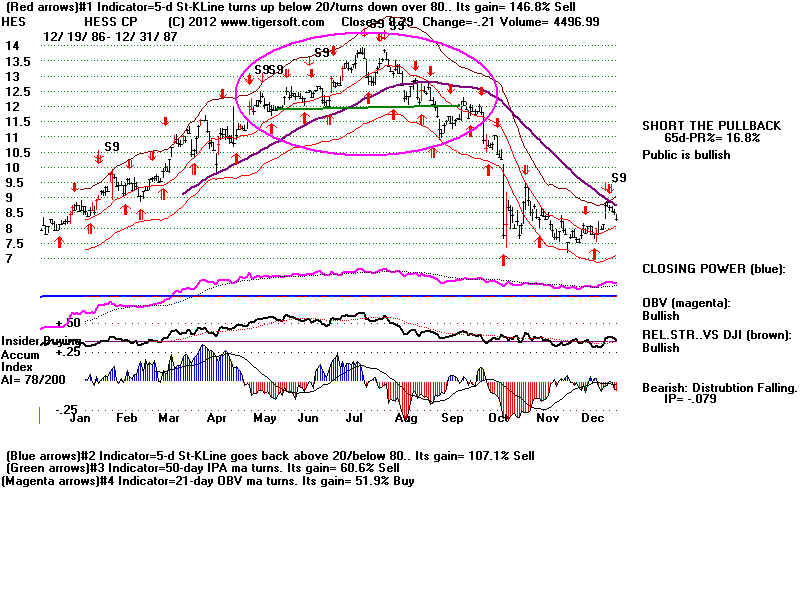
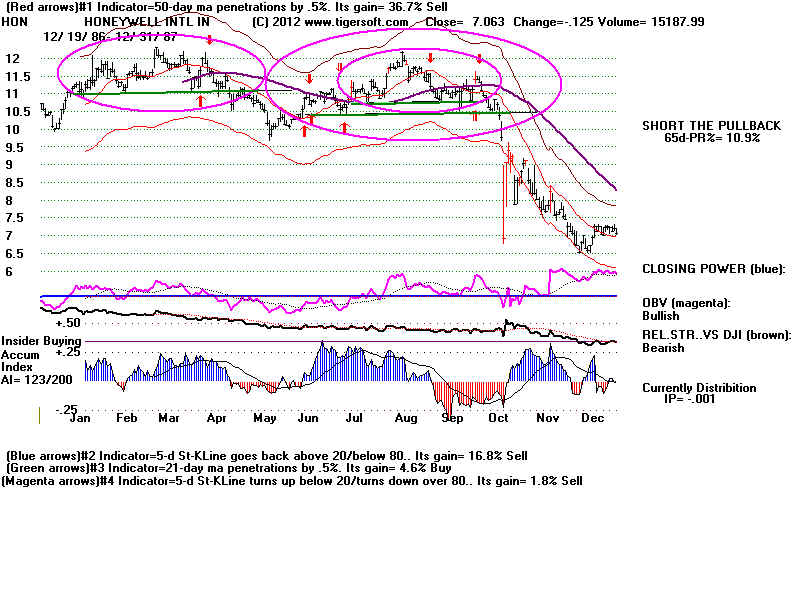
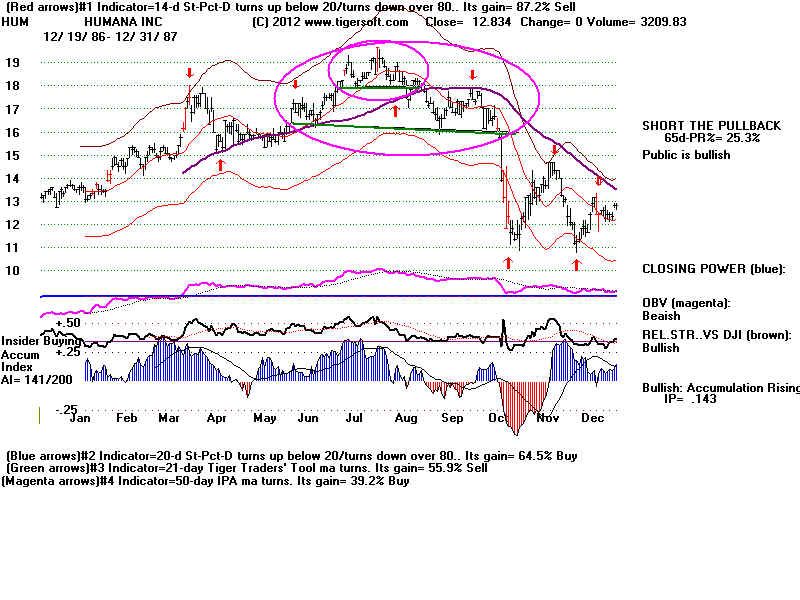
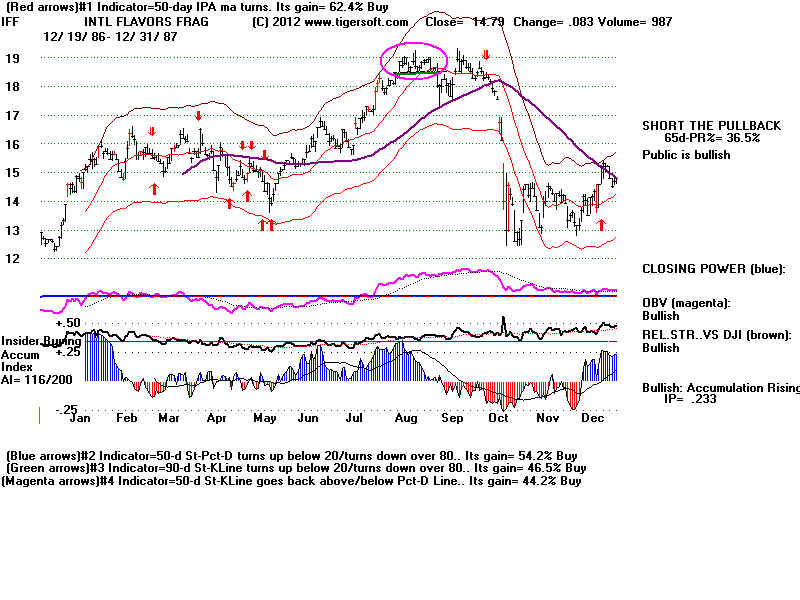
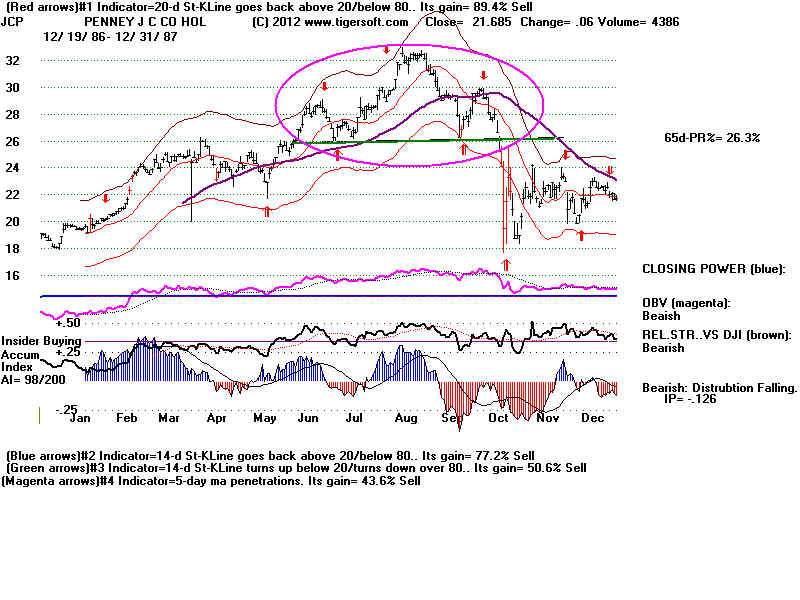
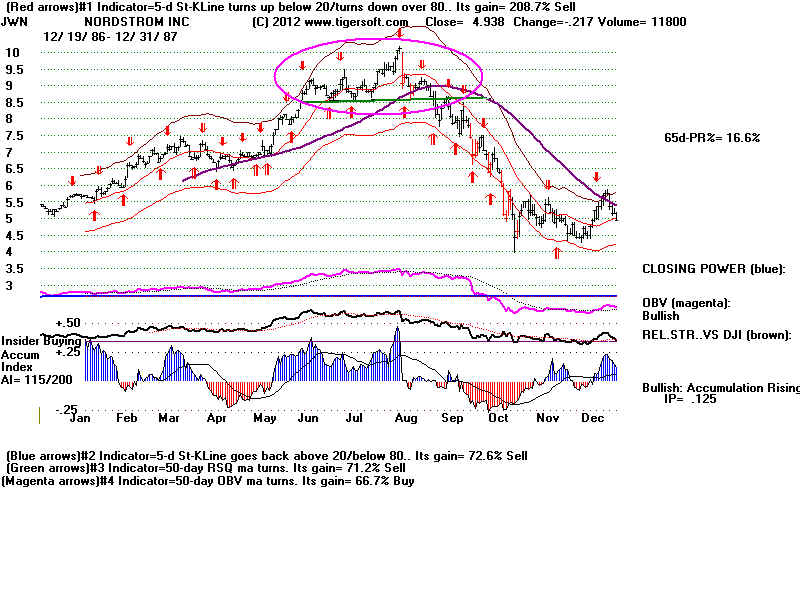
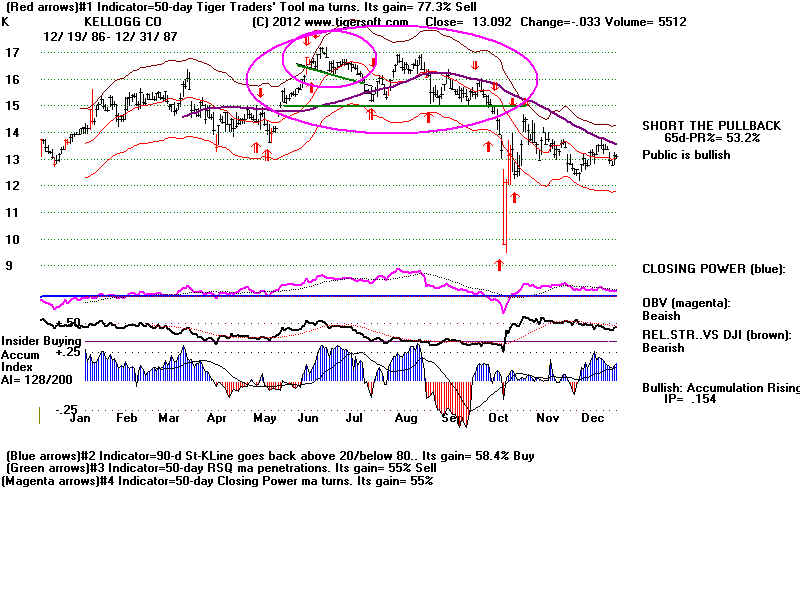
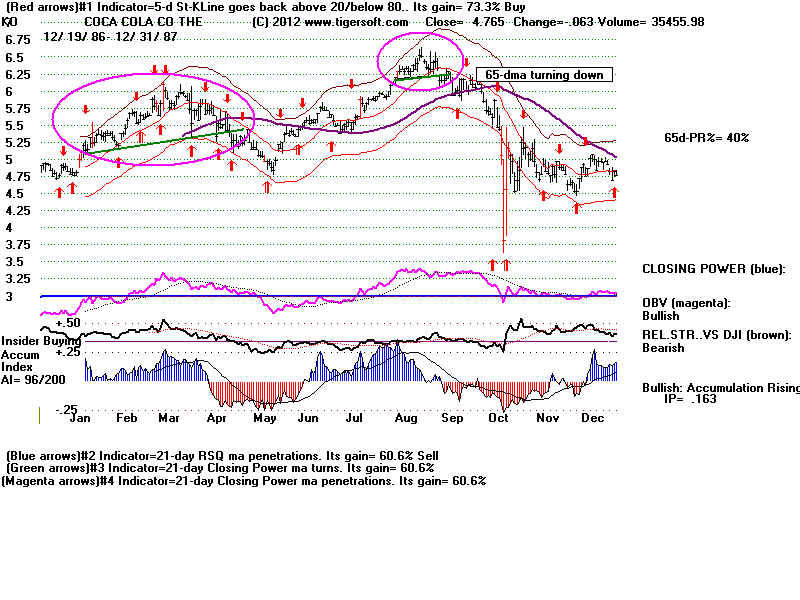
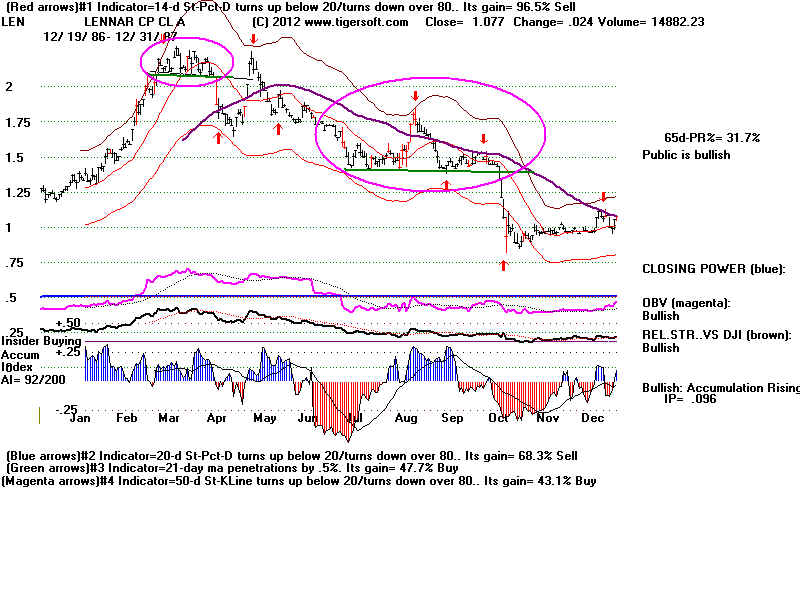
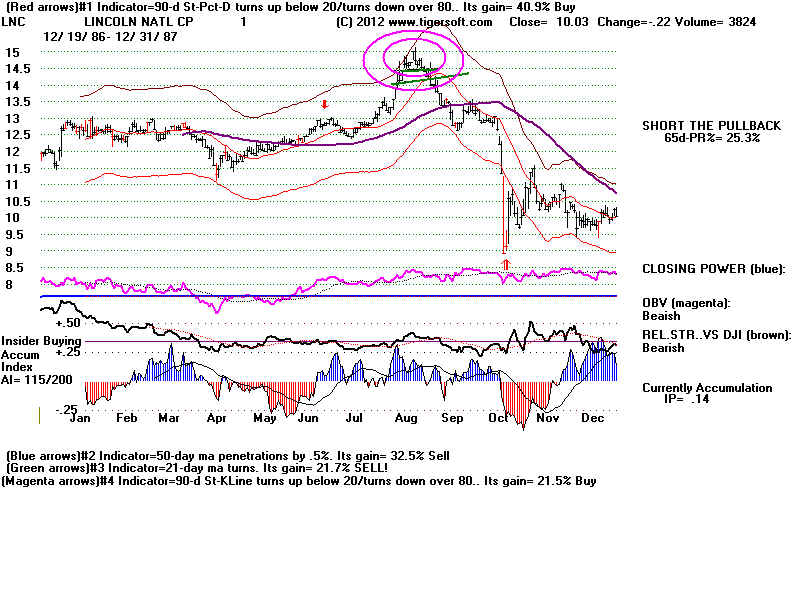
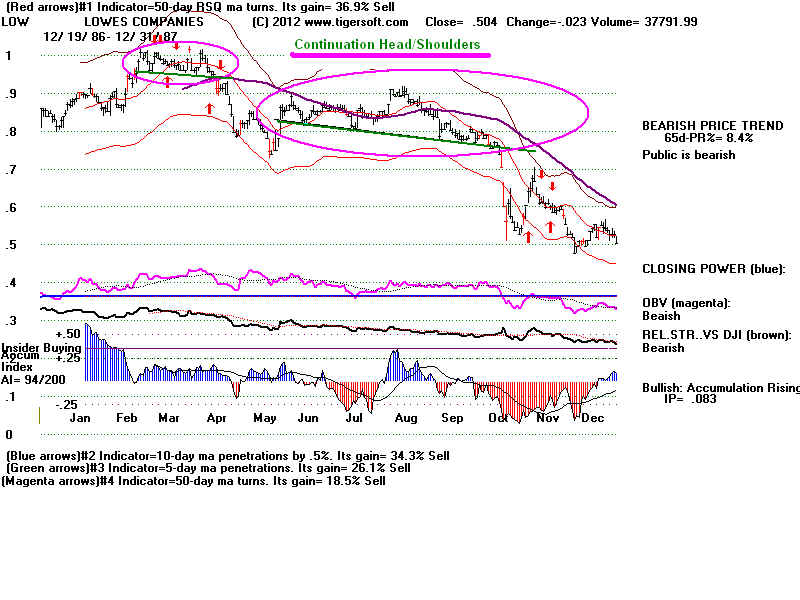
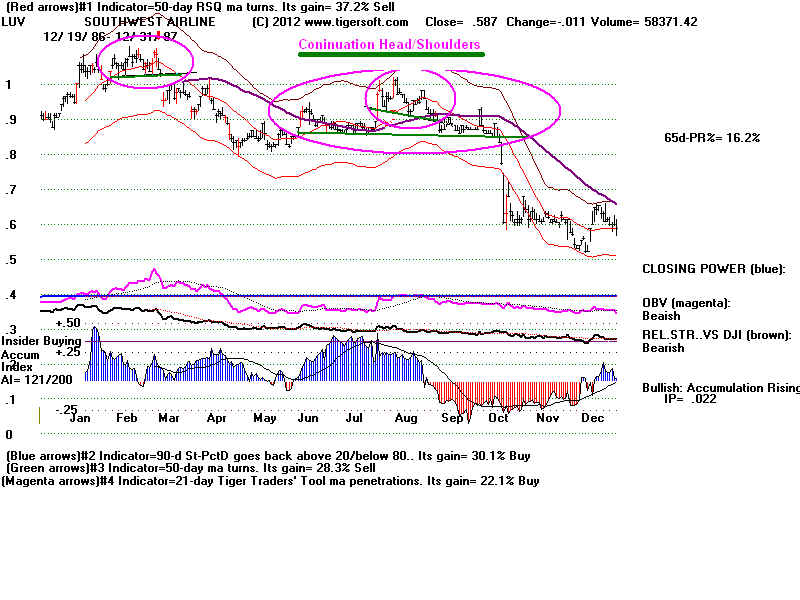
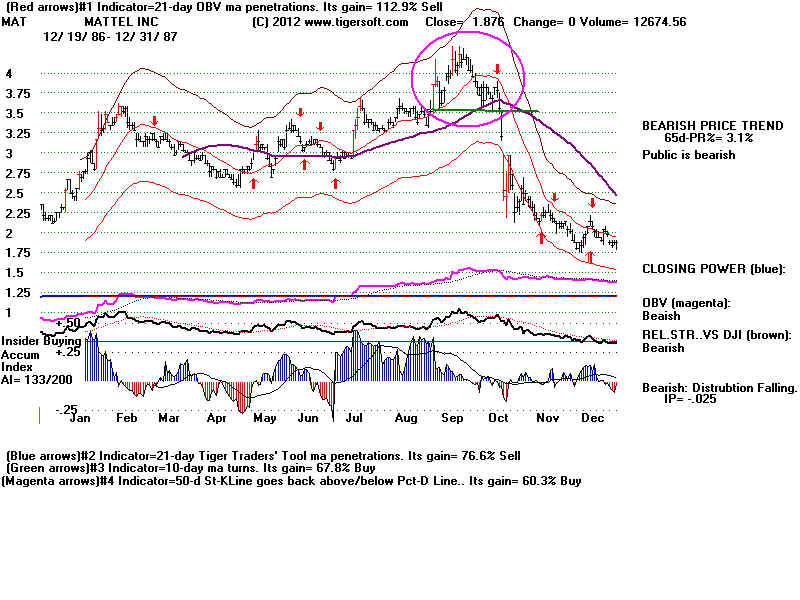
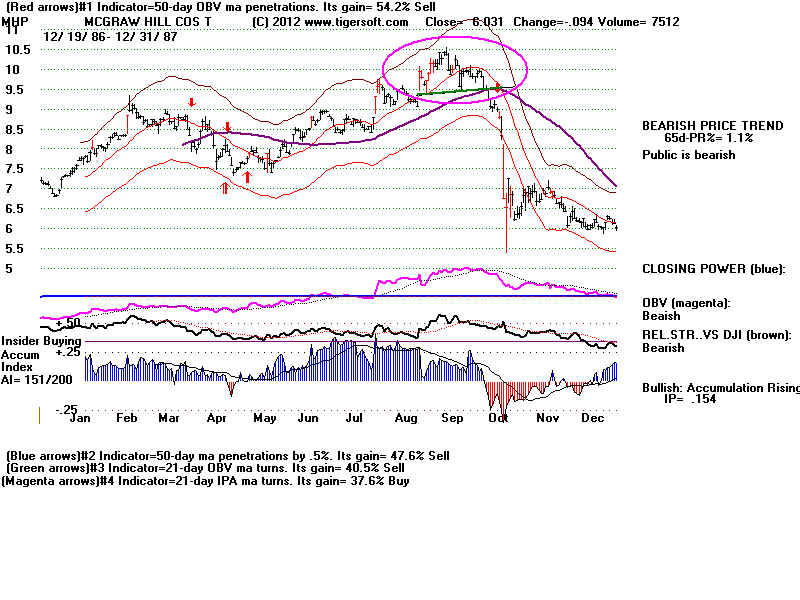
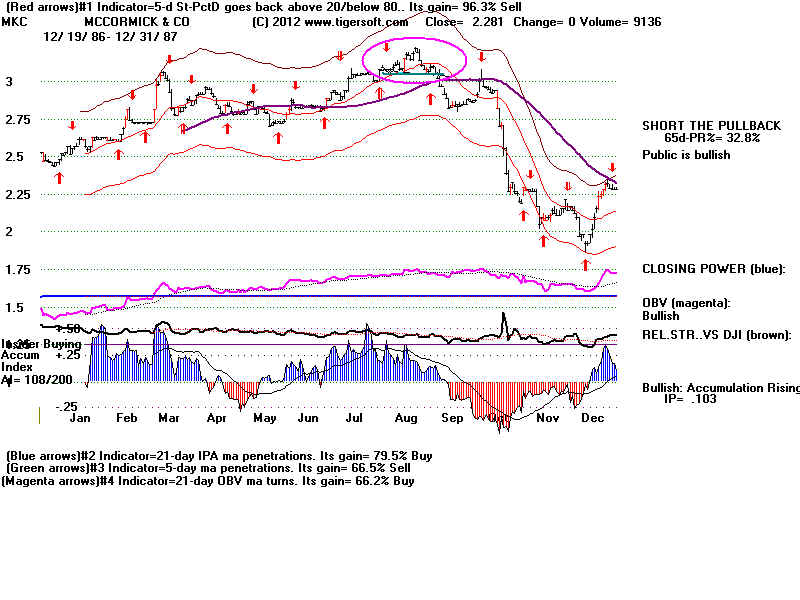
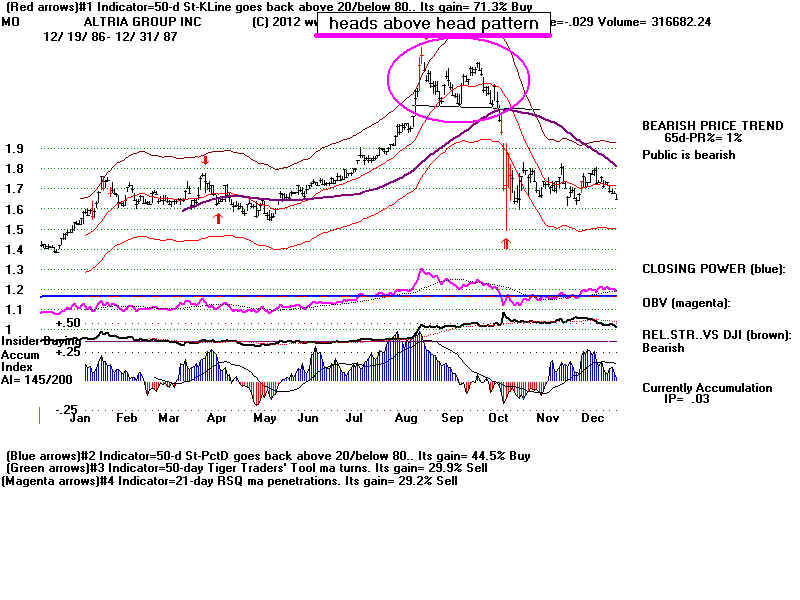
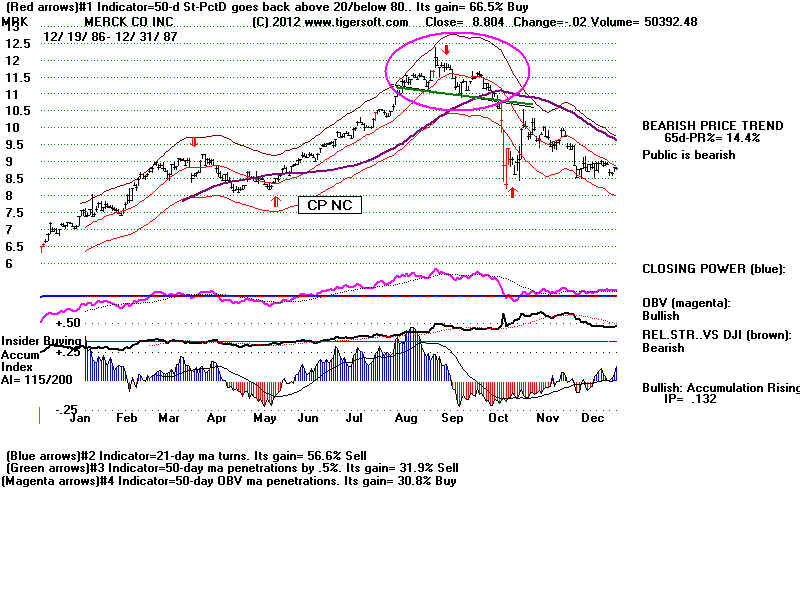
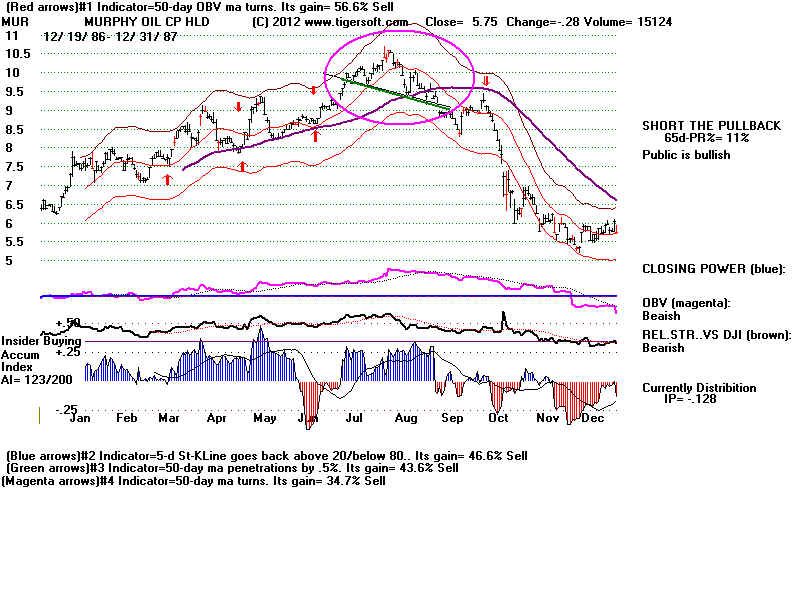
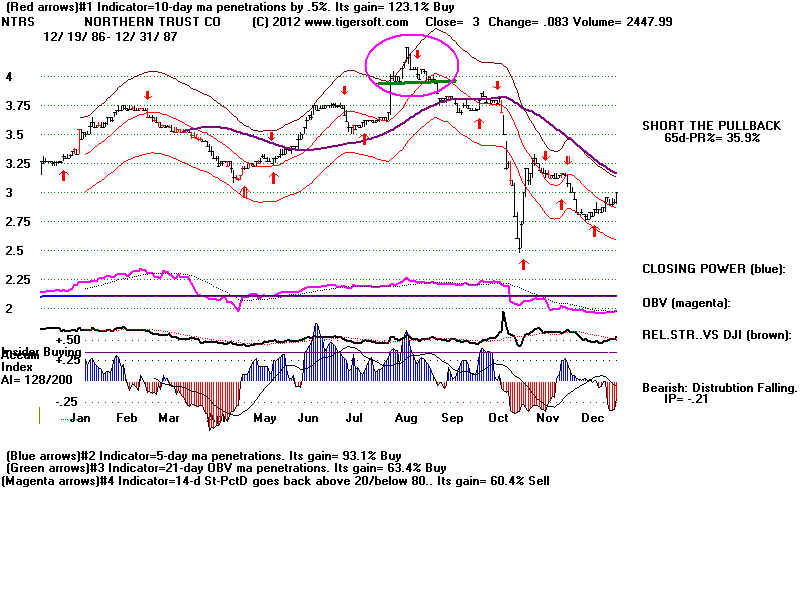
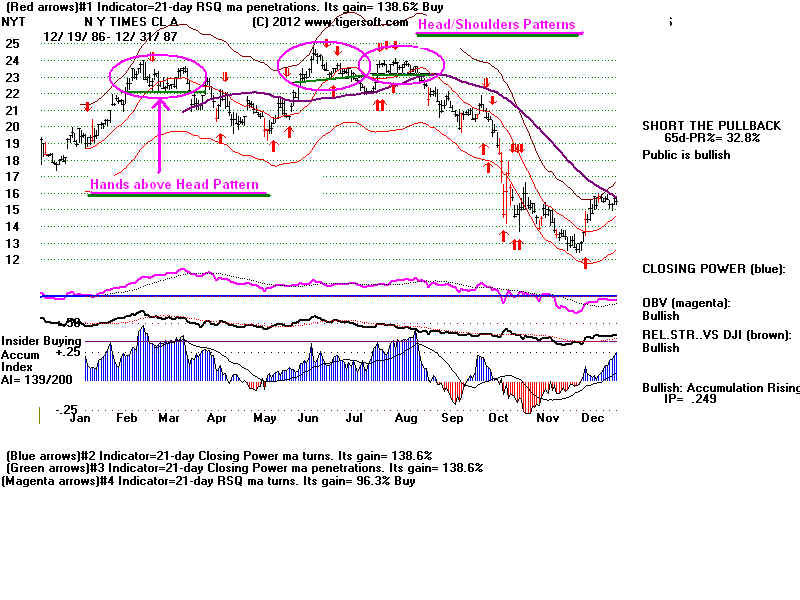
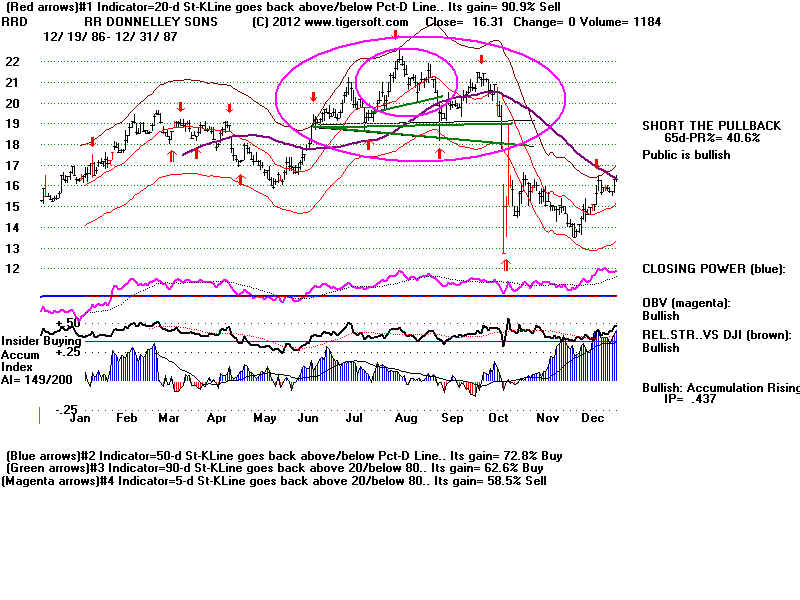
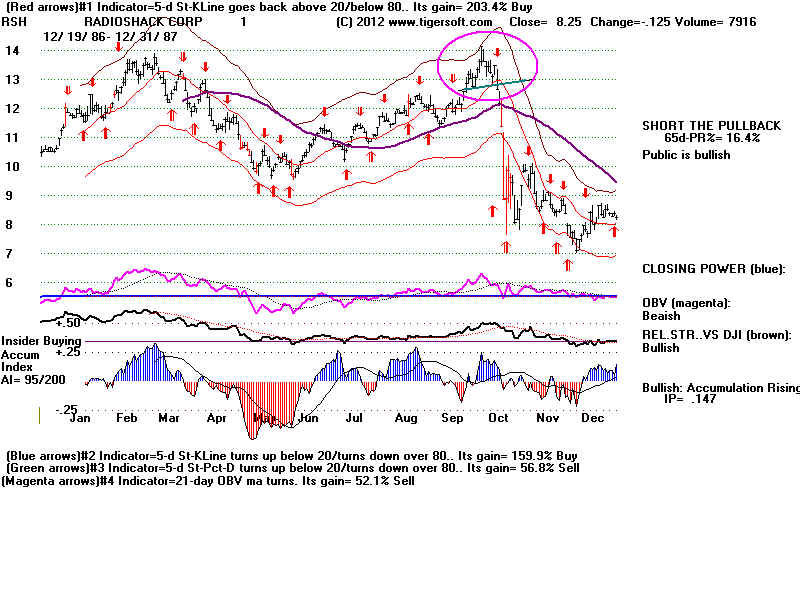
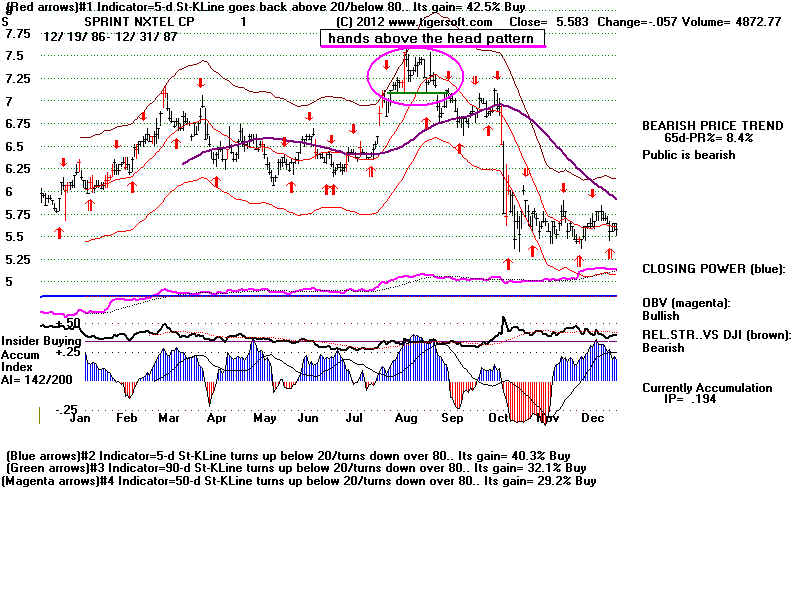
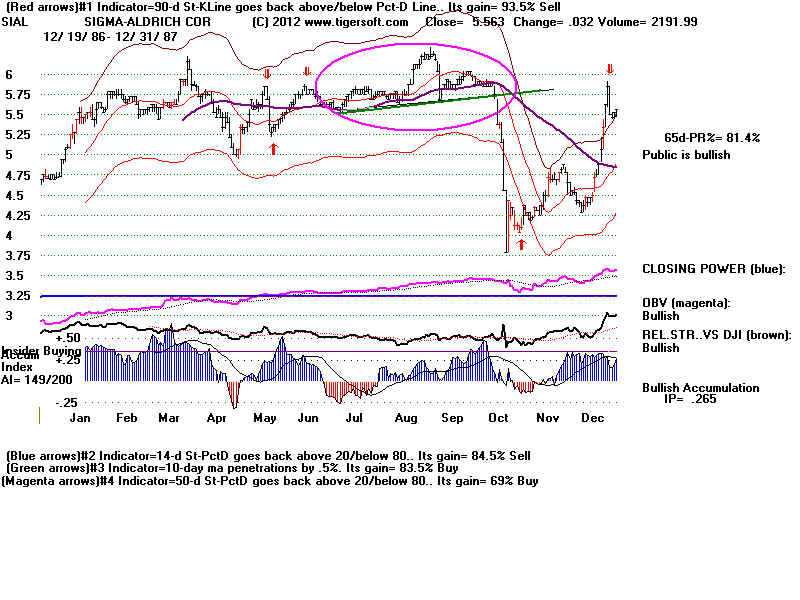
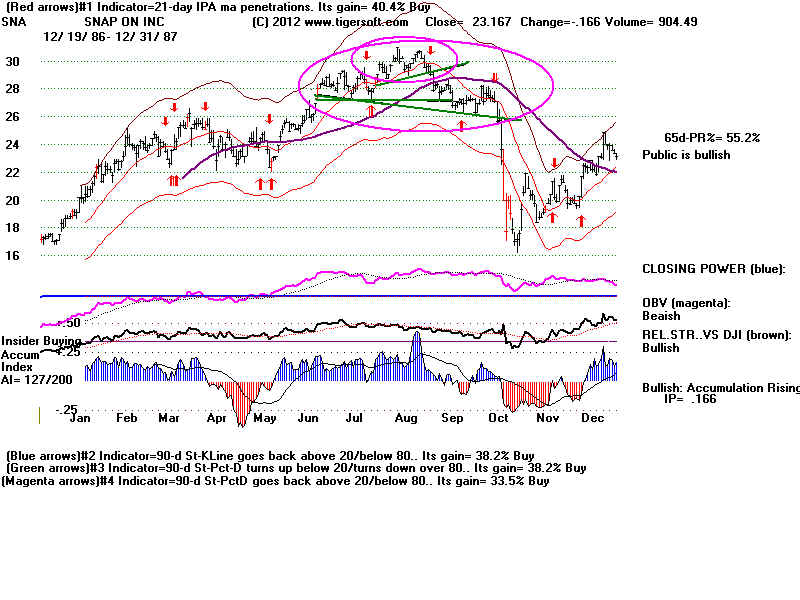
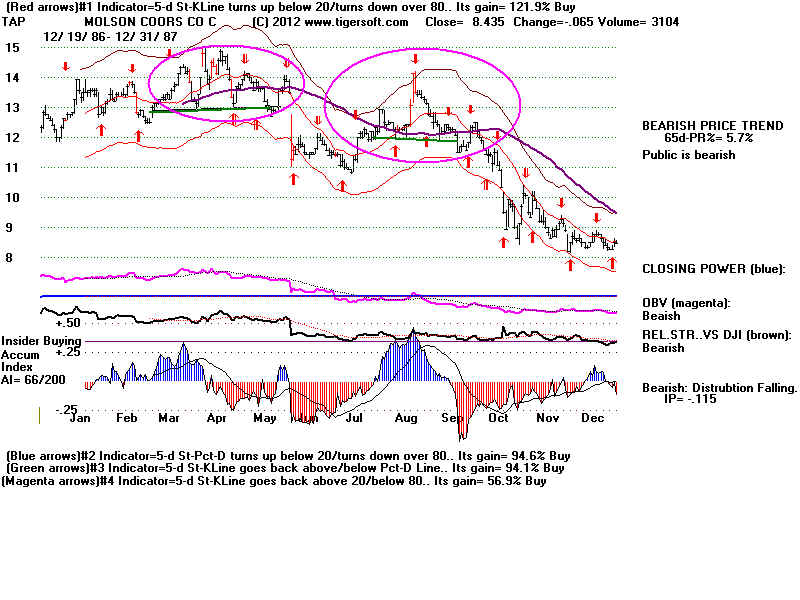
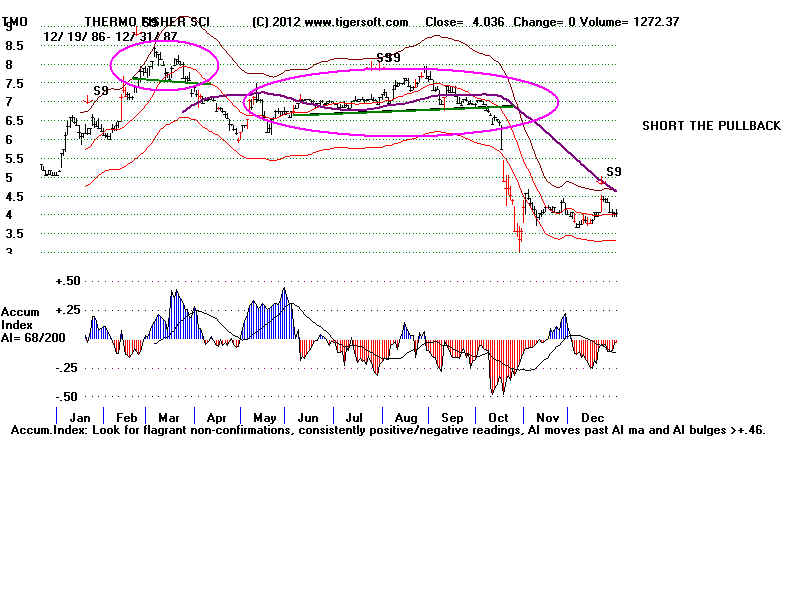
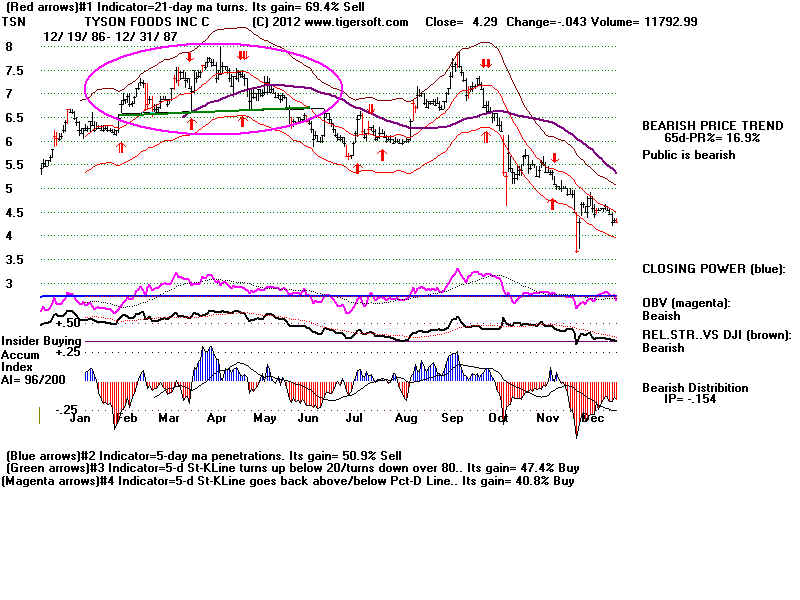
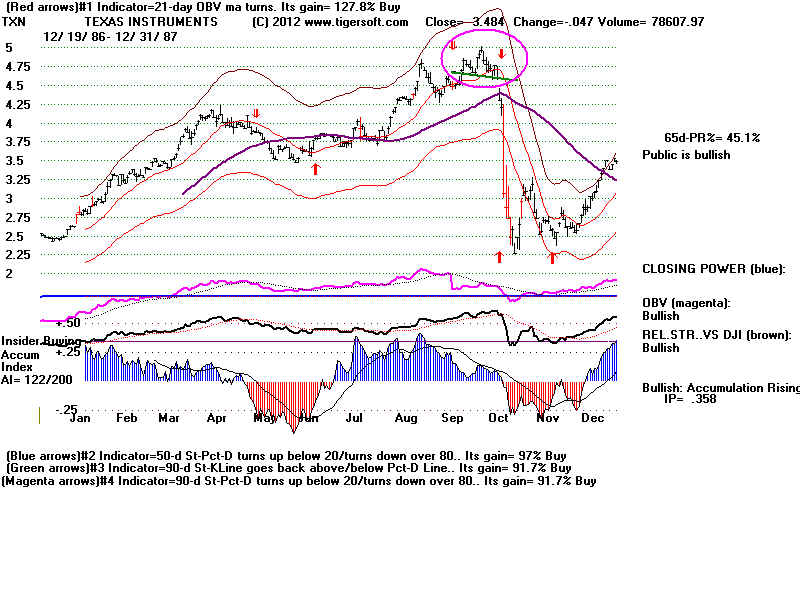
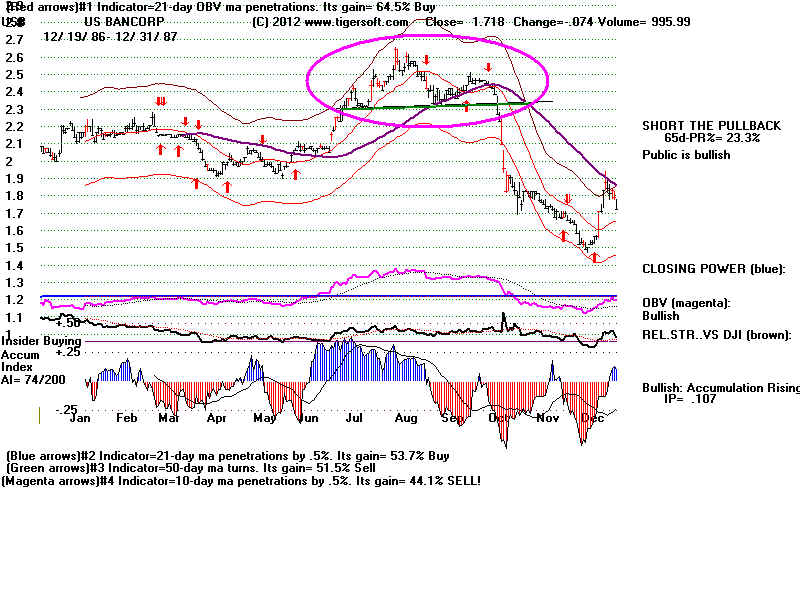
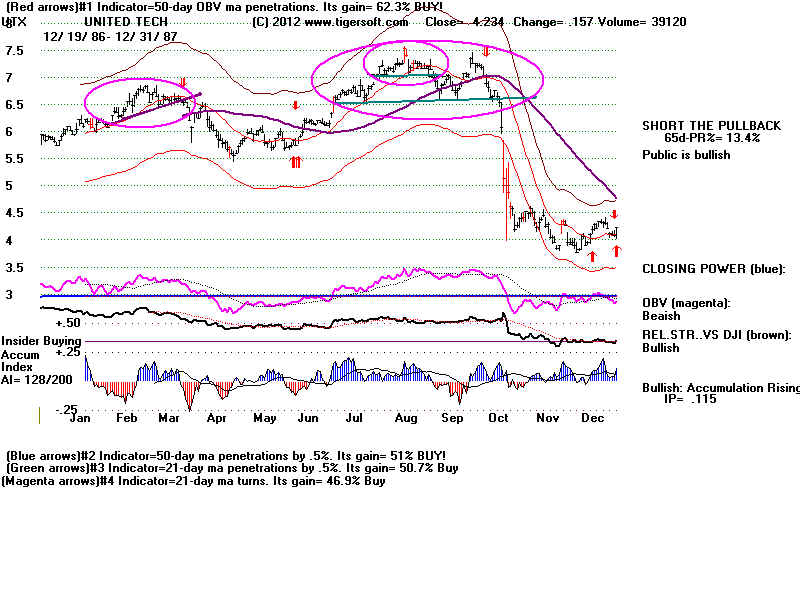
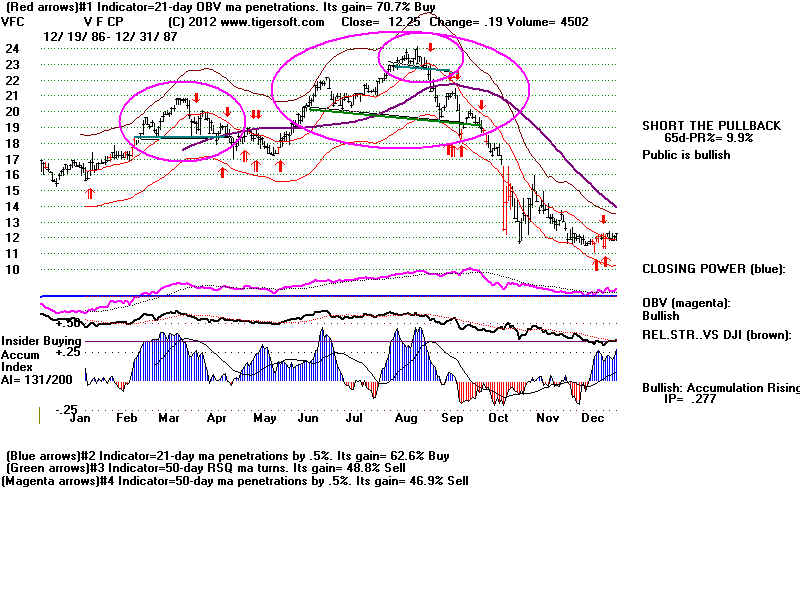
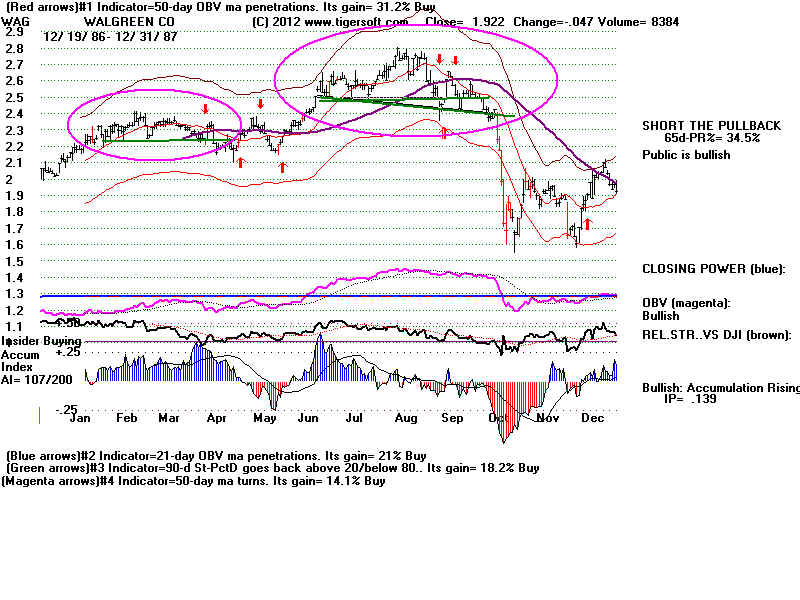
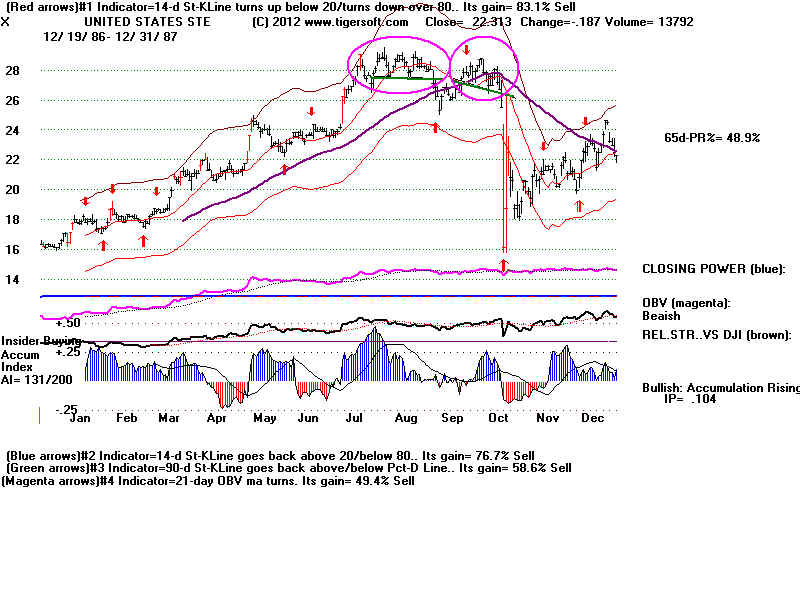
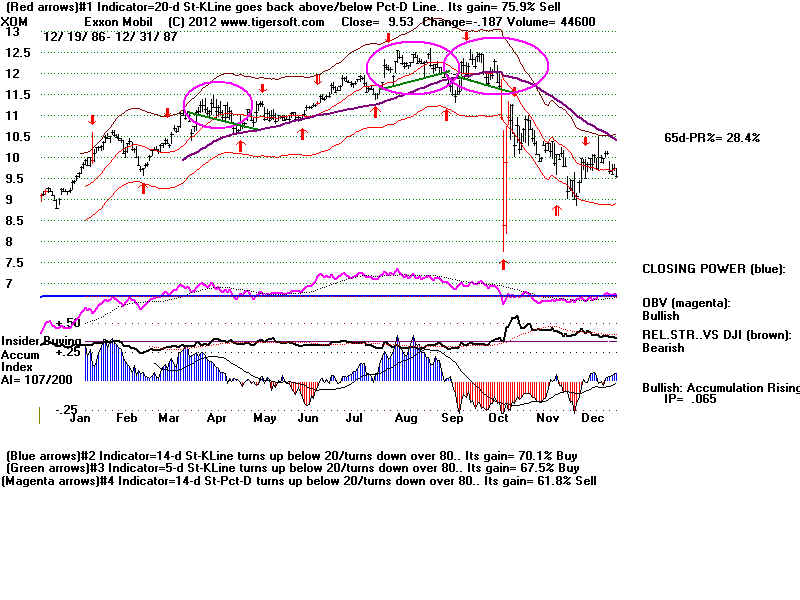
Head and Shoulders or Hands-theHead Patterns are seen below in 44 of the 224 stocks
from 1987 that have survived and thrived, so that they are now included in the SP-500 by 2012.
Most showed red distribution on the right shoulder of the H/S patterns.
Head and shoulders come in a lot more forms or varieties than the classic fom depicted
in technical analysis manuals. All forms are potent. So, the proficient technician should
be able to recognize them in their many variations.
Conclusions:
1987 Only 45/224 current SP-500 stocks traded back then
show one or more head/shoulders patterns as recognized here.
These 45 stocks produced 68 different completed head/shoulders
patterns.
30 of the 45 completed head/shoulders pattterns show pull-backs to
neckline. Usually a sharp break in prices followed. But in 5 cases
(CAT, F, LEN, UTX and XOM) the pull-back turned into an advance
that took prices above the right shoulder apex. In all 5 cases the
65-dma was rising and the initial penetration of the H/S neckline
did not take prices above the 65-dma..
Pullbacks before the minimum downside objective is met are much more likely
when the break in the neckline takes place above the support of the rising 65-dma.
Compare HUM, IFF, KO, S (where there is a pullback) with GD, JCP, MAT, MRK,
SIAL (where steep declines follow the breaking of the neckline). But just because
a stock is still above its 65-dma does not guarantee a pull-back rally. Look at the
huge sell-off in TXN below.
Classic Head/Shoulders patterns brought average drops about the same as the DJI.
The DJI fell 700 points after breaking its 2400 neckline support. This drop of 28.5%
compares closely with the 29% average drop from the necklines in the classic multi-month
head/shoulders patterns.
Gains are calculated by taking the percent change from a point just below the neckline
to the next major low, which here was the low for the rest of 1987.
One month, "mighty mouse" head/shoulders patterns resulted in average 25% declines
even though the patterns were quickly formed and heavy red distribution (from the
Accumulation Index) was not usually present. These patterns should be watched for,
heeded and exploited.
The biggest declines typically came when a stock had already shown an earlier H/S
in the same year or completed a complex of nested head/shoulder patterns. There were 15
such cases in the stocks looked at here. The average gain was 34.9%.
Classic 2-4 Months' Head/Shoulders
Length Neg Dist. Neckline Break Size Drop from neckline
of neckline on right was below 65-dma to lowest level afterwards
shoulder in this year.
------------------------------------------------------------------------------------------------ ----------------- ------------
AVP 1987 16 wks yes yes 40% 8 days
There was a pullback to the neclline.
-------------------------------------------------------------------------------------------------------------------------------
BMS 1987 16 wks yes yes 24% 7 days
-------------------------------------------------------------------------------------------------------------------------------
CLX 1987 10 wks yes yes 17% 1 day.
---------------------------------------------------------------------------------------------------------------------------------
F 1987 8 wks no yes 32% 3 wks
There was a pullback to the neclline.
---------------------------------------------------------------------------------------------------------------------------------
GD 1987 10 wks yes yes 31% 6 wks
- --------------------------------------------------------- --------------------------------------------------------------------------
HESS 1987 15 wks yes yes 38% 6 wks.
There was a recovery back to neckline before plunge.
------------------------------------------------------------------------------------------------------------------------------
(Continuation H/S)
JCP 1987 10 wks yes yes 28% 4 days
- -------------------------------------------------------------------------------------------------------------------------------
LEN 1987 10 wks yes yes 38% 4 days
---------------------------------------------------------------------------------------------------------------------------------
SNA 1987 14 wks no yes 32% 8 days
---------------------------------------------------------------------------------------------------------------------------------
TSN 1987 14 wks no yes 14% 4 wks.
There was a recovery back to neckline before plunge.
--------------------------------------------------------------------------------------------------------------------------------------
N=10 Avg. = 29.4% drop
5 weeks or Shorter Classic Head/Shoulders
Length Neg Dist. Neckline Break Size Drop from neckline
of right was below 65-dma
shoulder
------------------------------------------------------------------------------------------------ ----------------- ------------
IFF 1987 20 days yes no 5% 2 days
Decline stopped at rising 65-dma.
There was a recovery back above apex of right shoulder
-------------------------------------------------------------------------------------------------------------------------------
LUV 1987 22 days no yes 16% 8 weeks.
Gap breakdown and small recovery.
------------------------------------------------------------------------------------------------------------------------------
MKC 1987 23 days no yes 38% 12 wks
There was a recovery to neckline before collapse.
-------------------------------------------------------------------------------------------------------------------------------
NTRS 1987 23 days no no 34% 8 wks
There was a month long hesitation at the rising 65-dma
until prices turned down.
------------------------------------------------------------------------------------------------------------------------------
RS 1987 15 days no no 36% 8 wks
-------------------------------------------------------------------------------------------------------------------------------
N=5 Avg = 25.8%
2 or More Different H/S Patterns in the Same Year.
HON Oct 1987 32% 2 days
KO Oct 1987 Above 65-dma. There was a Pullback 38% in 4 weeks.
LEN Oct 1987 35% in 4 days
LUV Oct 1987 28% in 8 weeks
VFC Aug 1987 Above 65-dma. 45% in 14 weeks.
WAG Oct 1987 33% in 11 days
X Oct 1987 38% in 2 days
XOM 1987 - 3 H/S patterns 30% in 2 days
------------------------------------------------------------------------------------------------------
N=8 Avg = 34.9%
Complex Patterns with Multiple Nested H/S Patterns
(H/S Patterns within H/S Patterns)
AVP Oct 1987 pullback to the neclline. 40% in 8 days
HON Oct 1987 35% in 2 days
HUM Oct 1987 38% in 10 days
K Oct 1987 32% in 2 days
RRD Oct 1987 30% in 2 days
SNA Oct 1987 34% in 8 days
VFC Sept 1987 pullback above neclline. 35% in 6 weeks.
-----------------------------------------------------------------------------------------------------
N=8 Avg = 34.9%
Up-Sloping Neckline
CAT Oct 1987 34% in 7 days
CI Oct 1987 30% in 10 wks
KO 1987 pullback above neclline. 28% in 3 weeks
SIAL Oct 1987 32% in 5 days.
-------------------------------------------------------------------------------------------------------
N=4 Avg = 34.9%
Downsloping Neckline
LOW Oct 1987 32% in 8 weeks.
MUR Sept 1987 pullback above neclline. 40% in 12 weeks.
MRK Oct 1987 19% in 6 days
SNA Oct 1987 34% to 16.5 in 8 days
-------------------------------------------------------------------------------------------------------
N=4 Avg = 31.3%
Hands above Head Pattern
DIS Oct 1987 35% in 4 days
MO Oct 1987 22% in 4 days
NYT March 1987 pullback above neclline. Above 65-dma. 7% in 7 weeks.
-------------------------------------------------------------------------------------------------------
N=3 Avg = 21.3%
Asymmetrical Patterns
Bigger Right Shoulders
HUM 1987
MUP 1987
NYTS 1987
RRD 1987
S 1987
TMO 1987
USB 1987
UTX 1987
Bigger Left Shoulders
LOW 1987
TAP 1987
TMO 1987
TSN 1987
End of a lateral move
SIAL 1987
TMO 1987
Quickly formed H/S with very quickly formed right shoulders
RSH 12.5---> 8 wks.
TXN 4.5 ---> 1.25 8 days
Negative/Big Change in Accum Index from left shoulder to right
and classic pattern bring big drops.
--------------------------------------------------------------
AVP
CVS
HON
JCP
LEN
MRK
TMO
USO
Oddities pecliar to individual stocks
TAP pullback and spring back to apex of right shoulder
and then sell-off
DJI's Top in 1987
