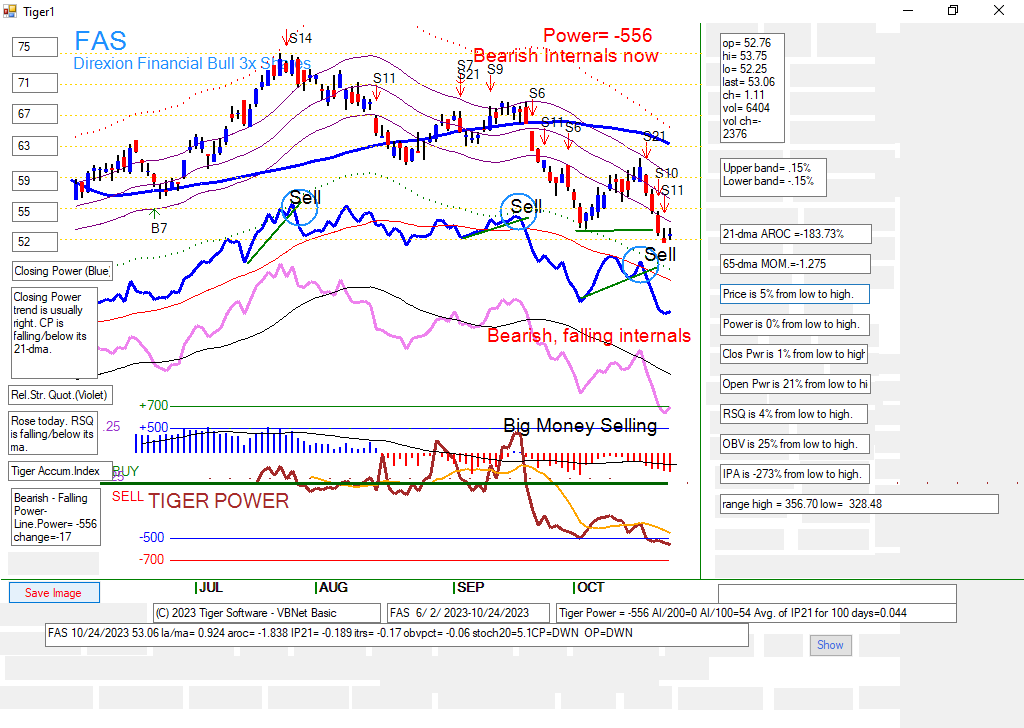
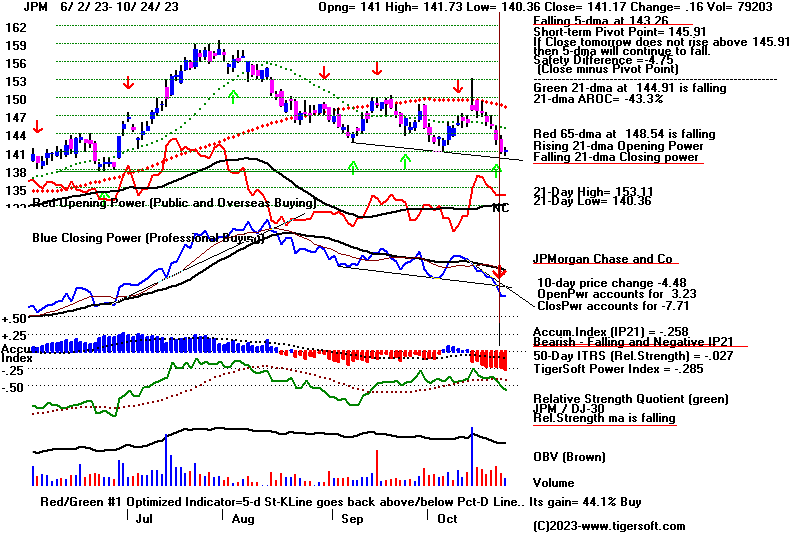
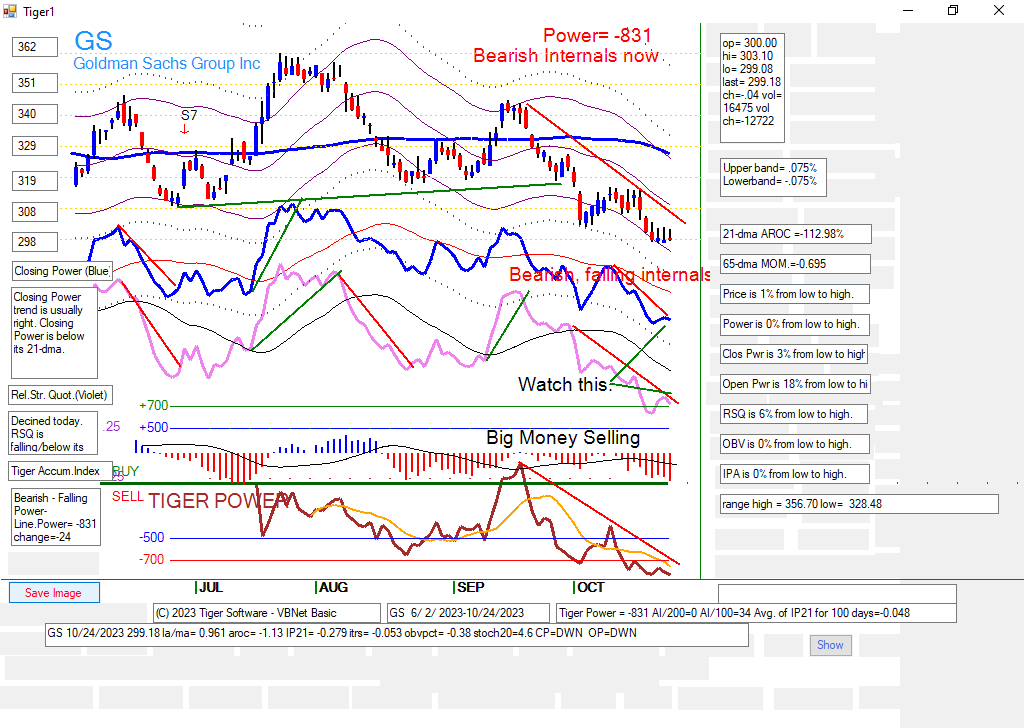
JPM and the big banks (FAS) could not manage much of a bounce.
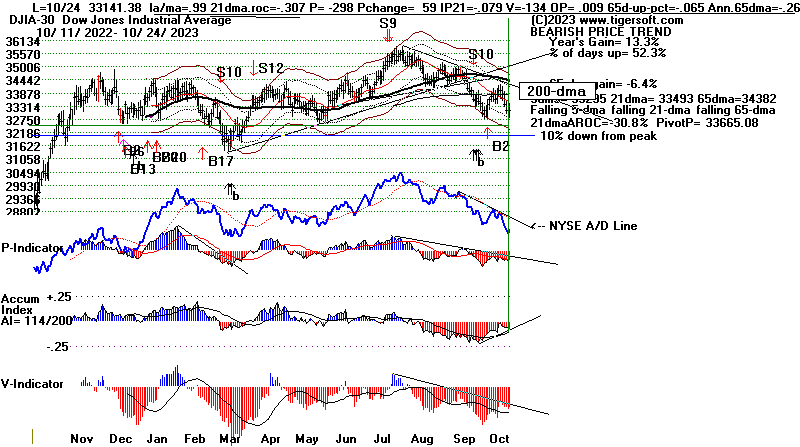
This calls into question any rally at this time. More testing
of key support levels is likely. There are oo many new lows now
and too much overhead resistance to try to make money on the
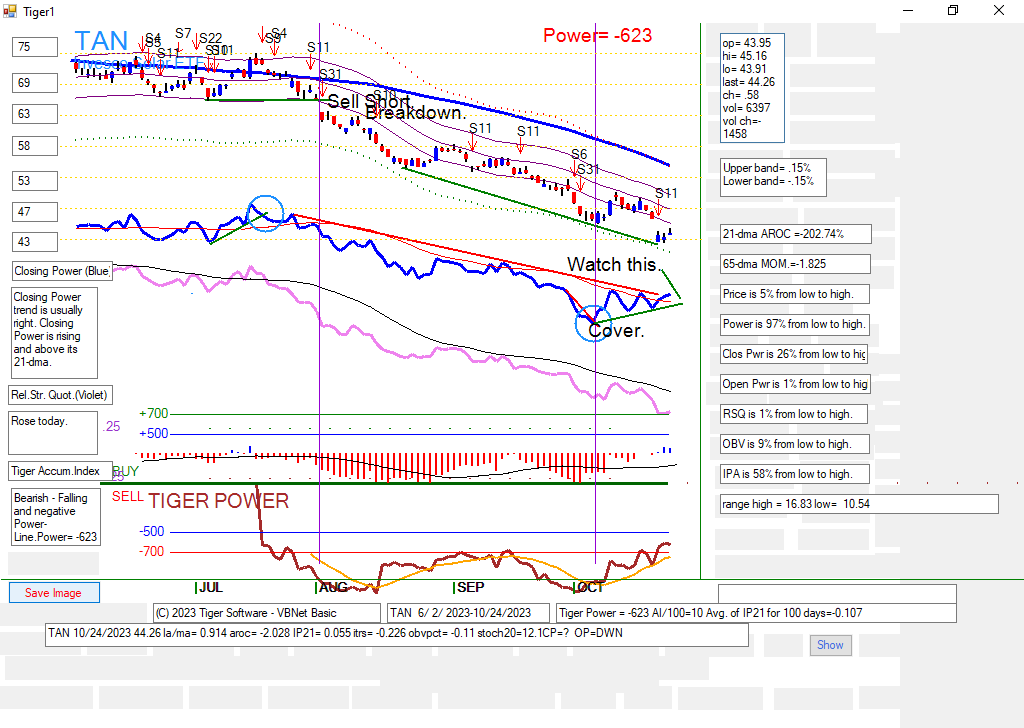
long side. The bearish MINCPs are safer, but cover any that rise
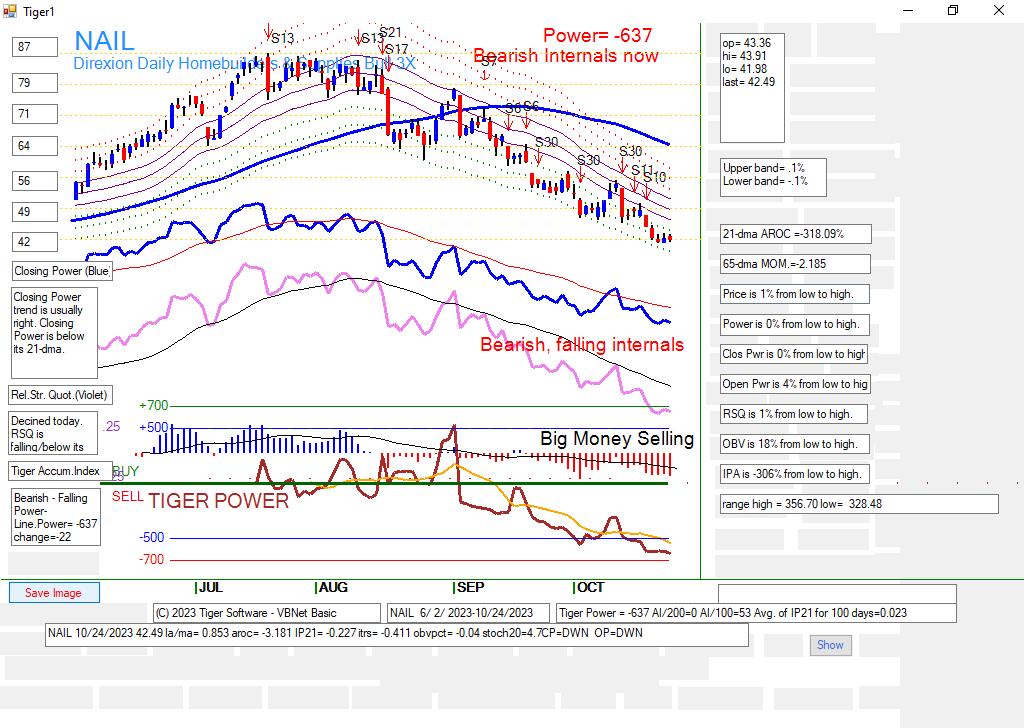
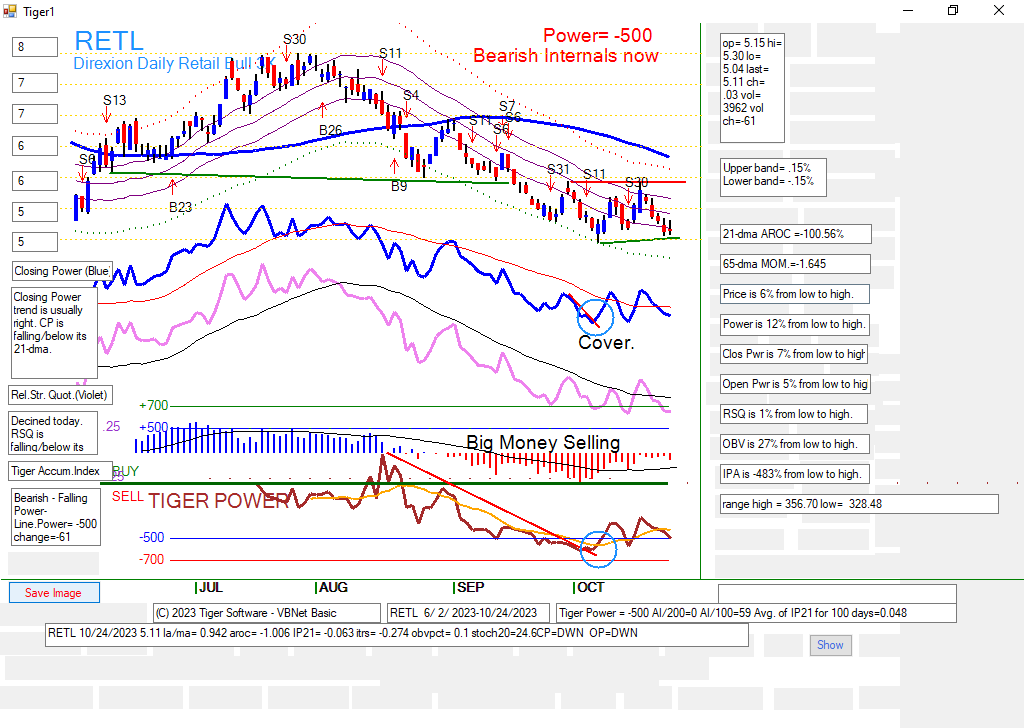
above their falling Closing Power downtrends, as shown below in
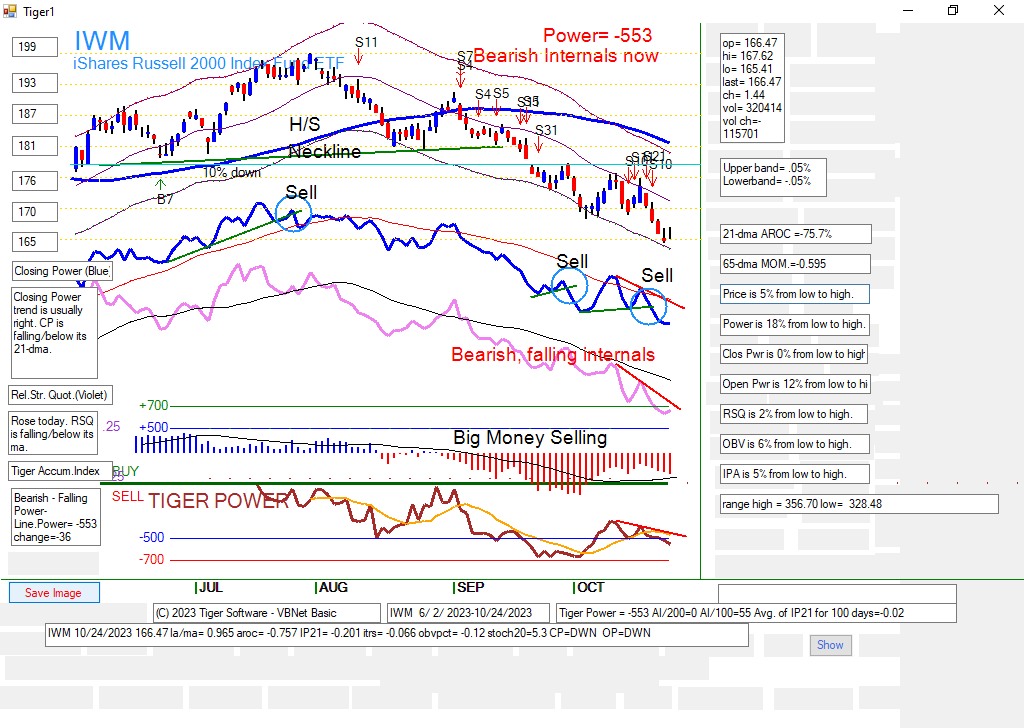
TAN and RETL for examples. IWM, JETS and smaller caps
remain under heavy selling pressure.
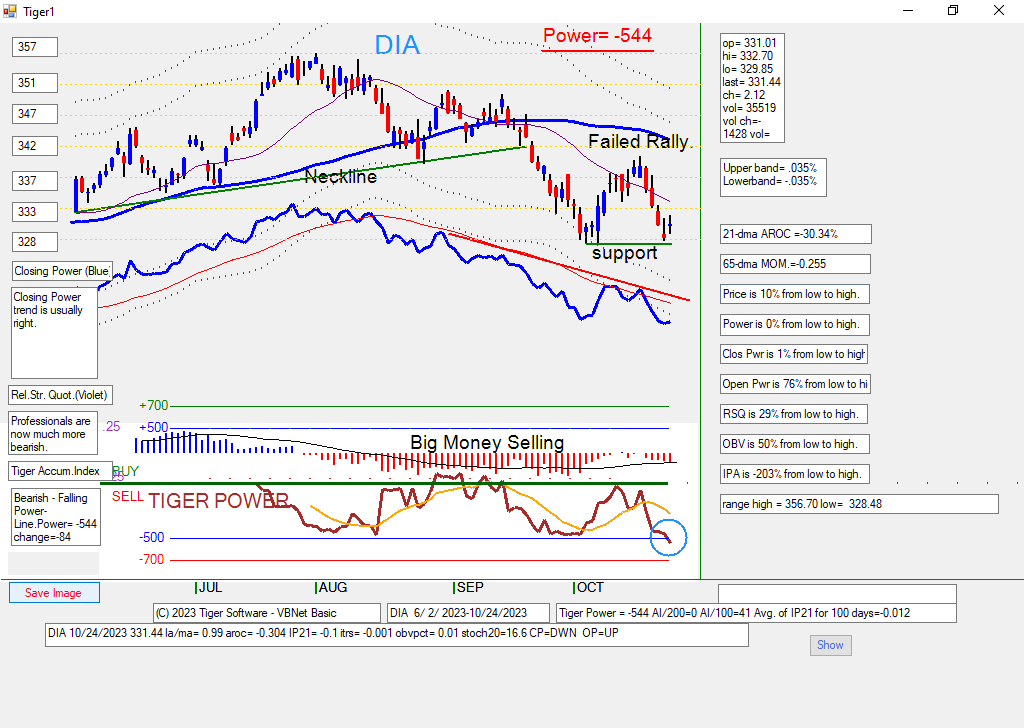
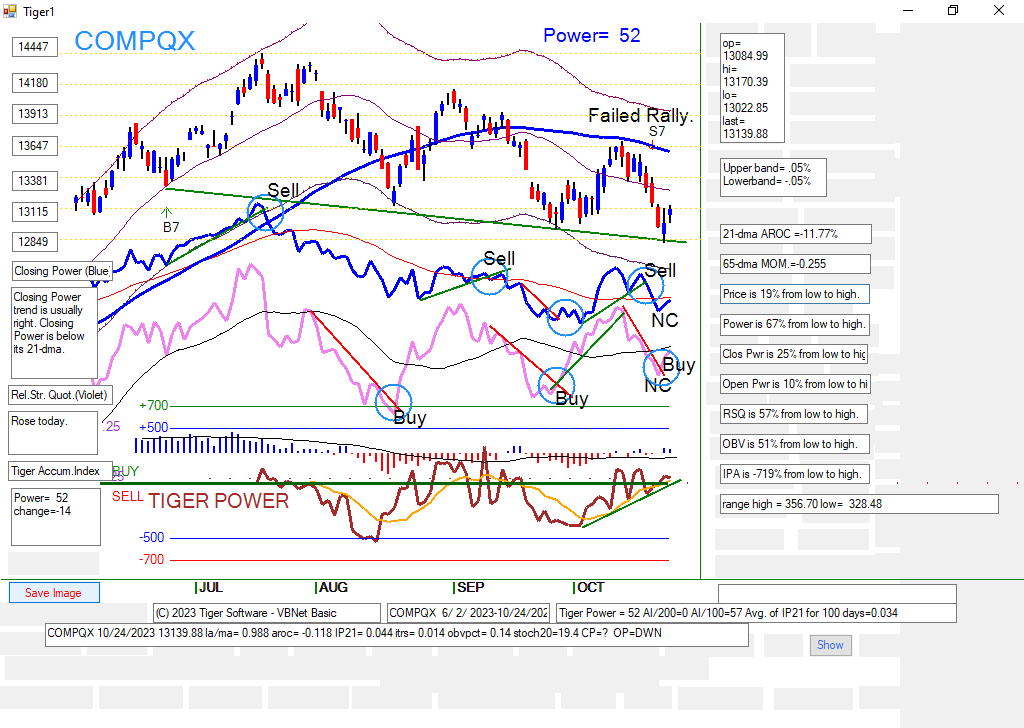
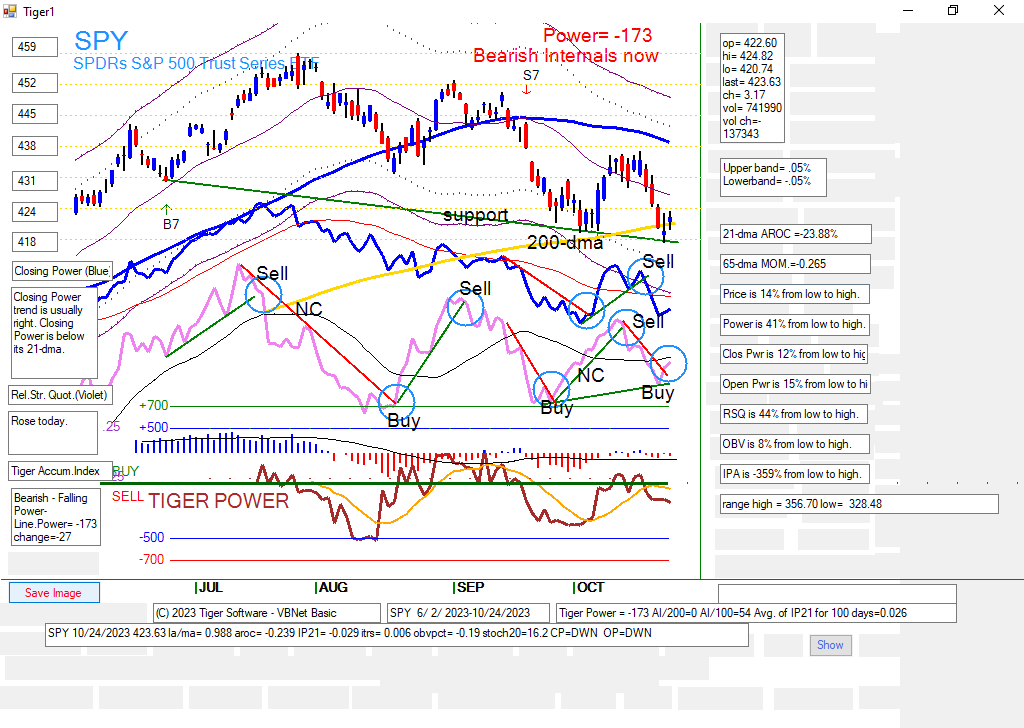
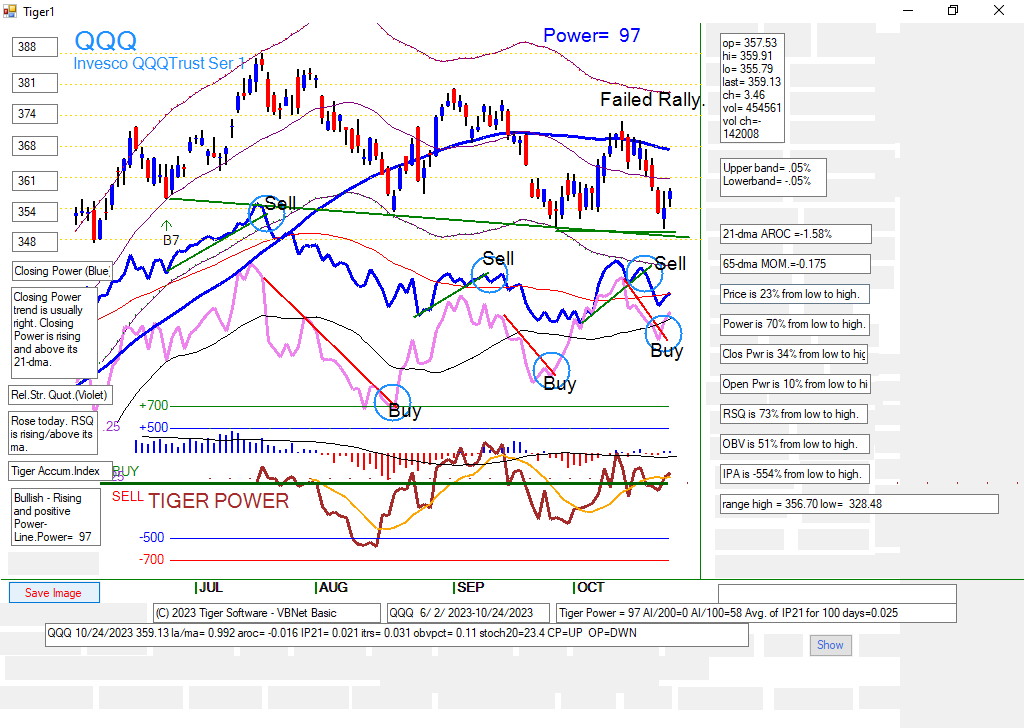
Watch COMPQX, SPY and QQQ to see if they can continue to hold
above their key support levels. Their Relative Strength Lines are
favorable, but Professionals are still very cautious.
The 5% yield on a 10-year bond appears to be an important resistance point.
Its retreat has so far not been significant. A minor retreat will show us
the FED is not shifting away from its hawkish tightening.
Most of the rest of the market, especially small caps, are in
bear market territory and at or close to making new yearly lows.
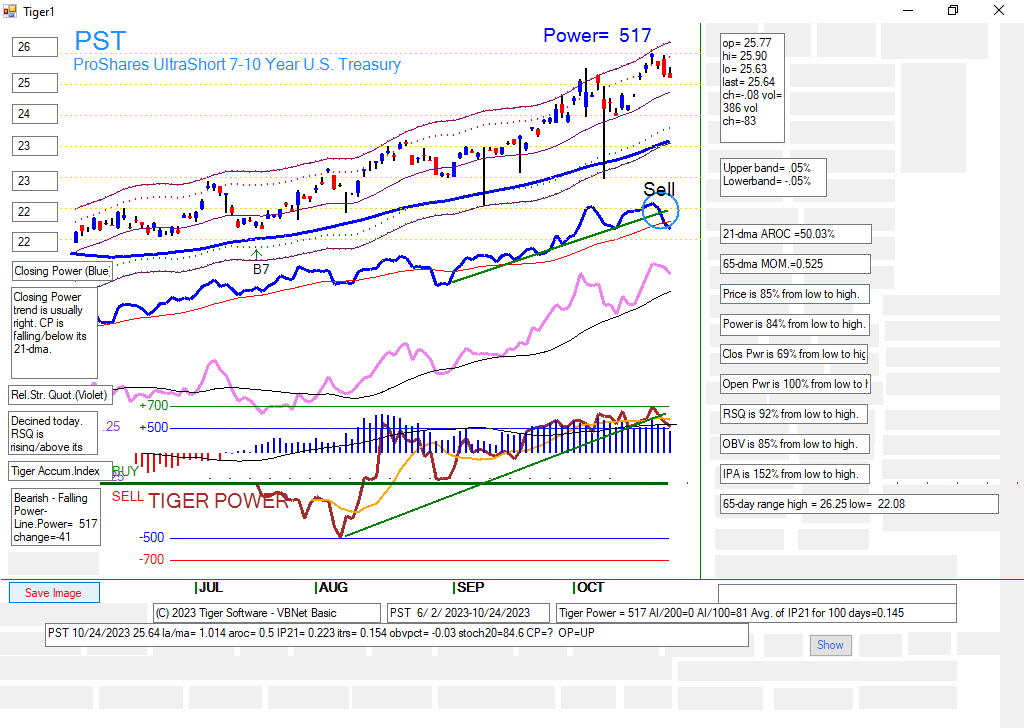
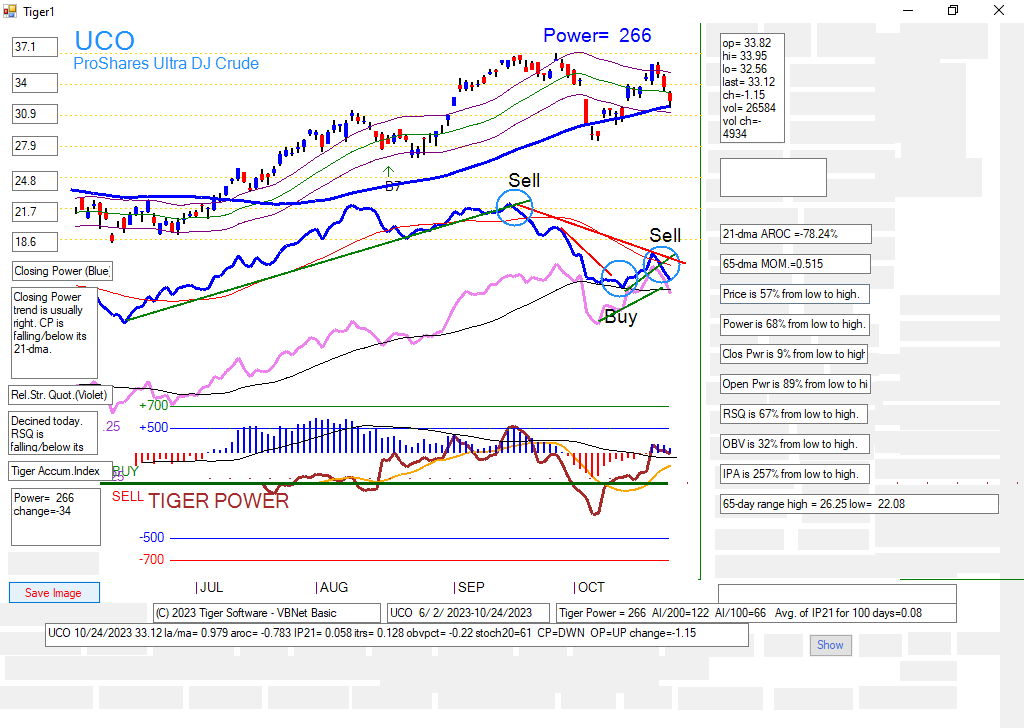
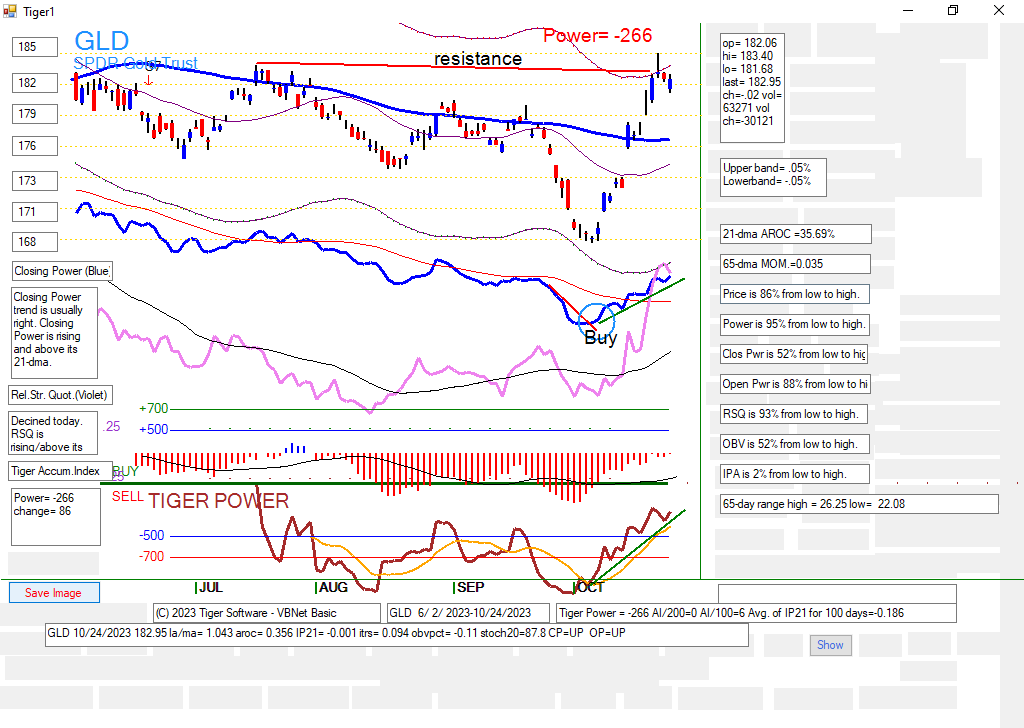
Crude Oil has given a Closing Power sell and Gold reversed at overhead resistance.
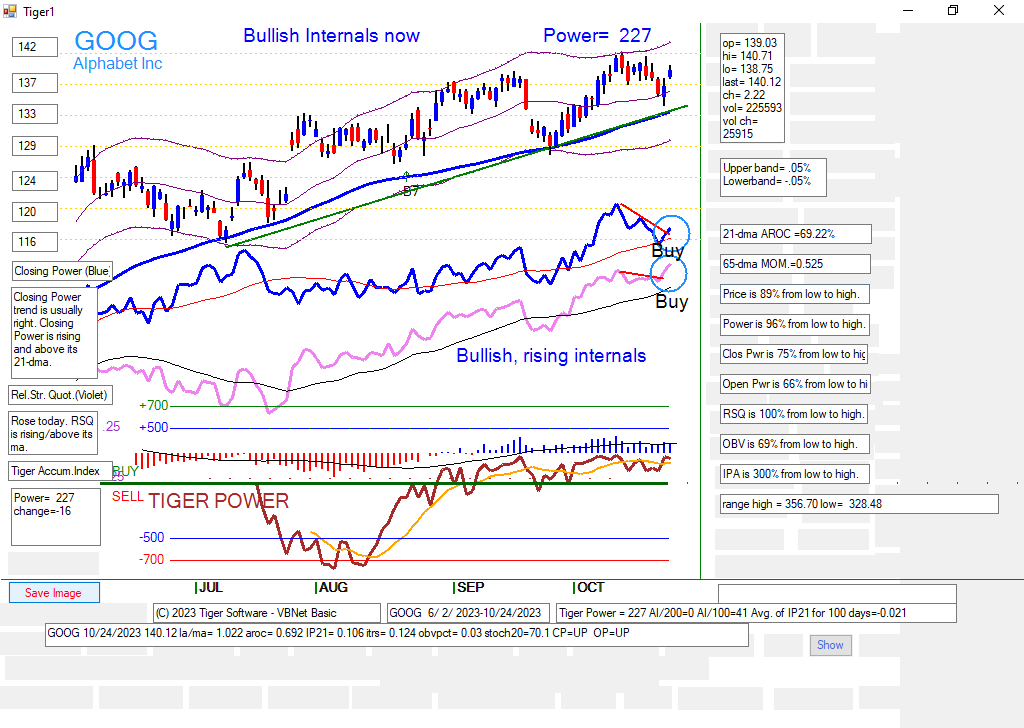
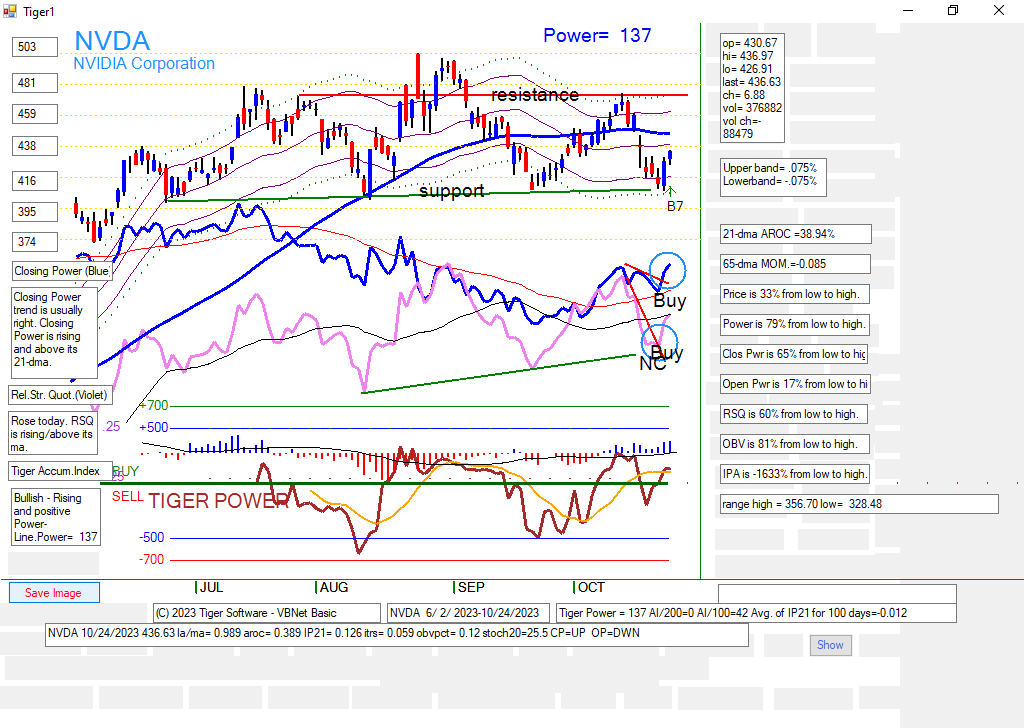
NVDA continues to be the leader of many tech stocks. It is asking a lot for
one stock to play such a big role. It is vital that GOOG and Facebook stay strong,
too.
The other charts are posted to help new users of our Window10
candle-stick charts.
Interpretation of Charts
---- When you look at a stock or ETF, focus on the trend of its Closing Power
and Relative Stength. See which of these show trendbreaks that give
the best signals. Volatile stocks and ETFs trade very well using our RSQ's
trend-breaks.
---- If stock is below falling 65-dma and its IP21 is negative, don't buy, though
shorts should be covered when Closing Power downtrend is broken. Reshort
these negative Power stocks, when the minor CP uptrend-line is broken.