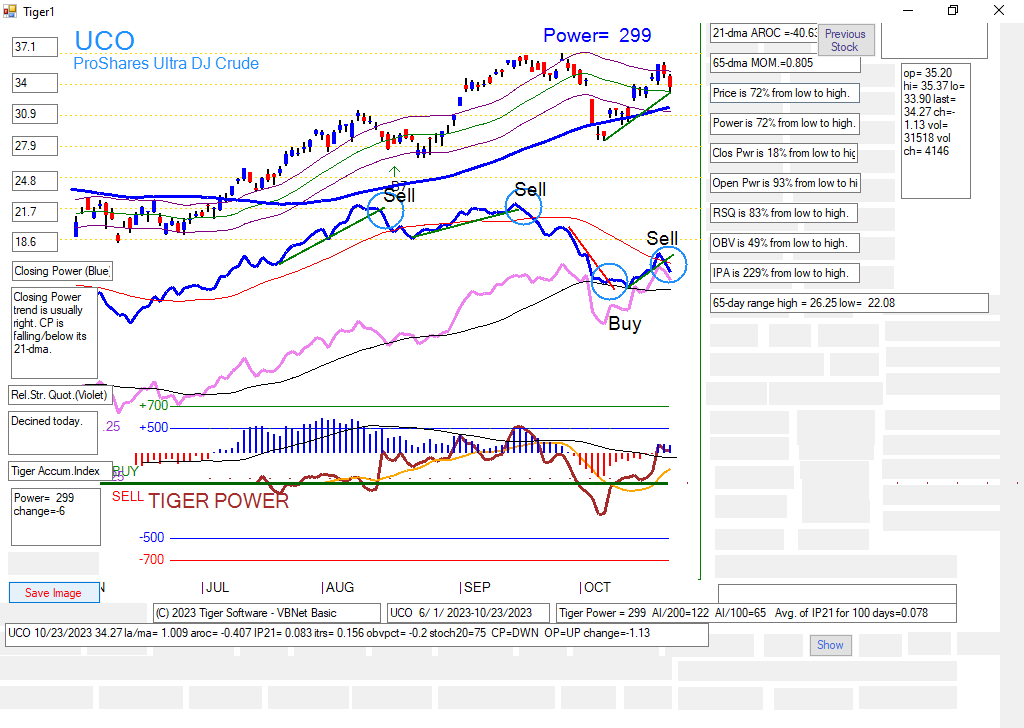
A bounce is shaping up. Oil and Gold turned down with Cude Oil's
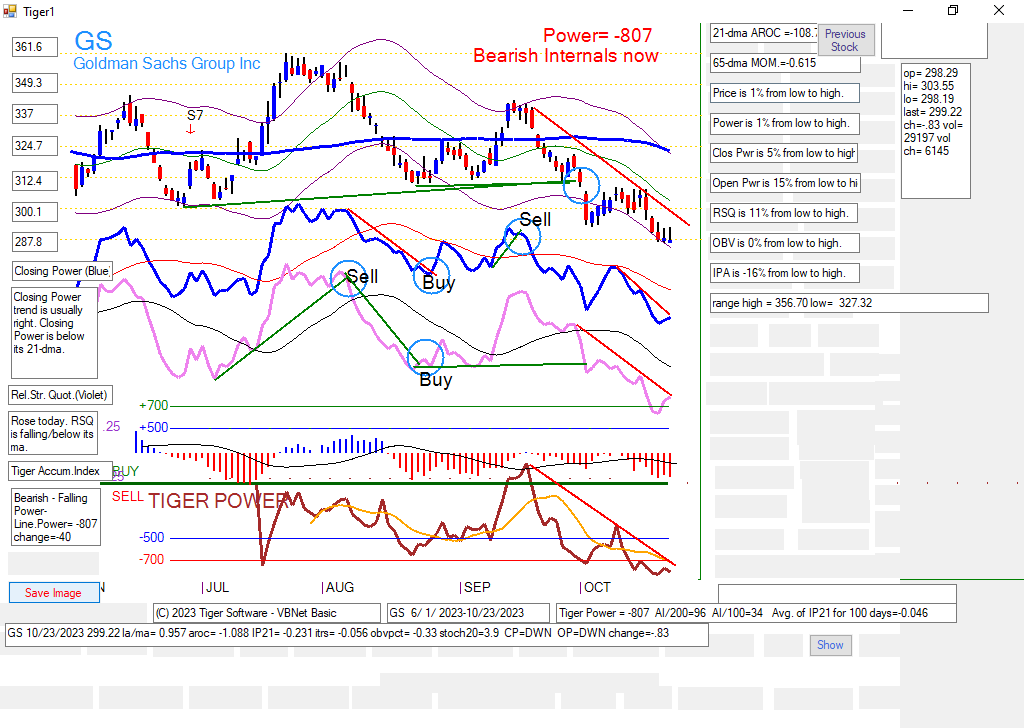
Closing Power uptrend being violated. Big banks are now complaining
about the Fed's tight money policies. Most of the rest of the market
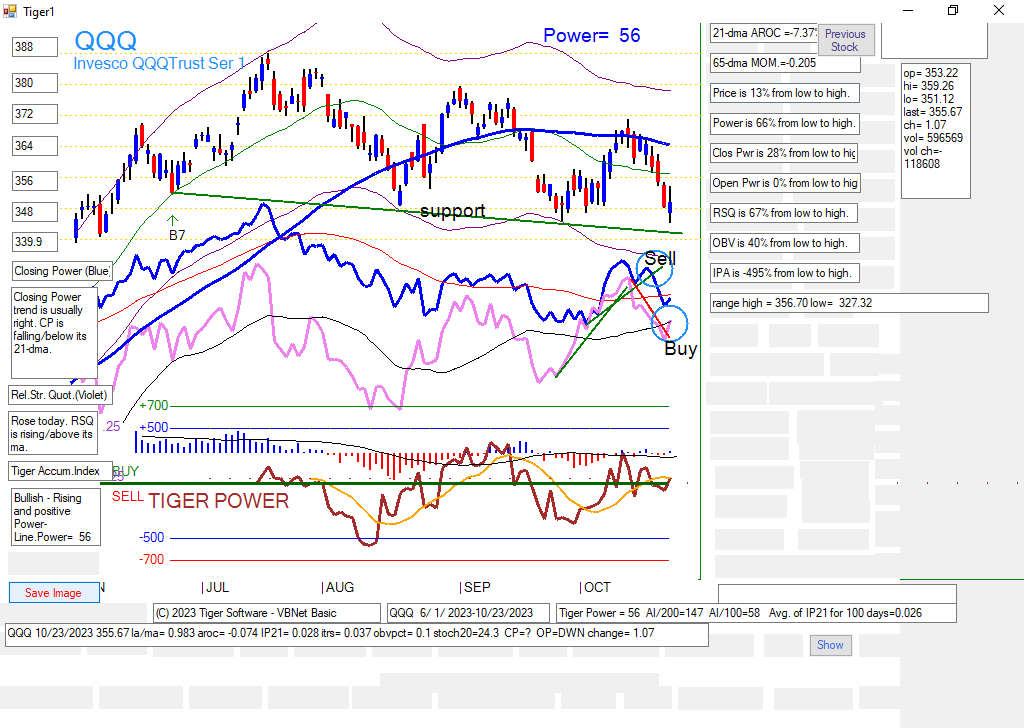
declined. But QQQ and SPY's Relative Strength Lines improved enough
to break their steep downtrends. This is short-term bullish. The Peerless
Buy B2 only delivered a recovery a little past its falling 21-day ma on its
first rally attempt. It is not clear, it can do even this much if it tries again.
Breadth is too negative and most stocks and ETFs have not shown
any signs of bottoms.
The 5% yield on a 10-year bond appears to be an important resistance point.
Let's see how much it can retreat. A minor retreat will show us the FED is
not shifting away from its hawkish tightening.
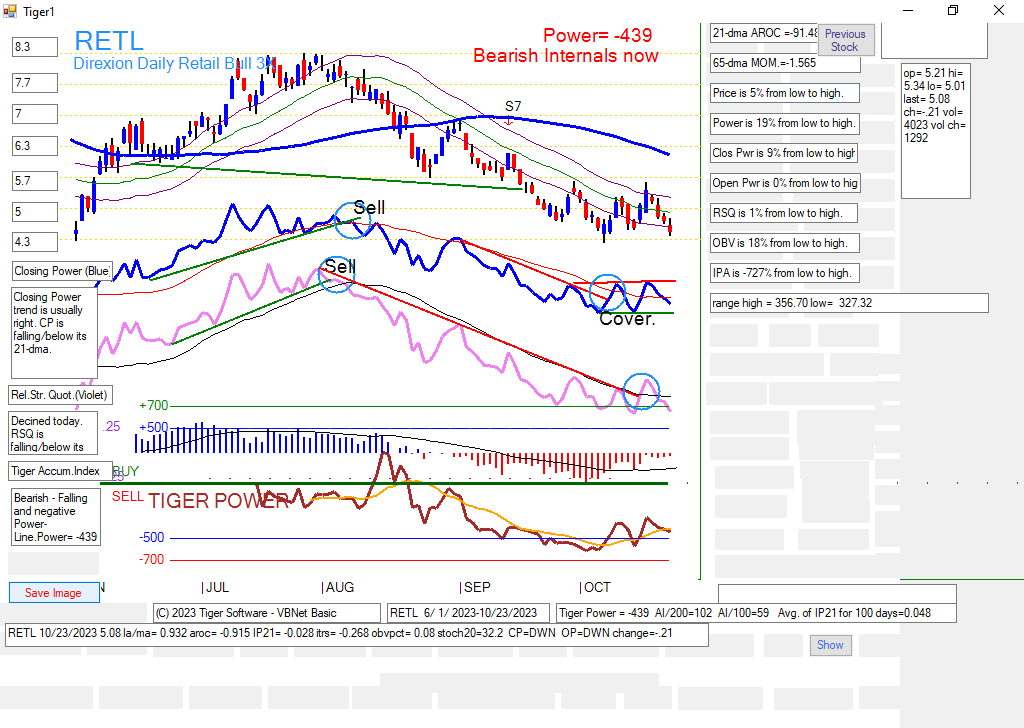
Most of the rest of the market, especially small caps, are in
bear market territory and at or close to making new yearly lows.
Crude Oil has given a Closing Power sell and Gold reversed at overhead resistance.
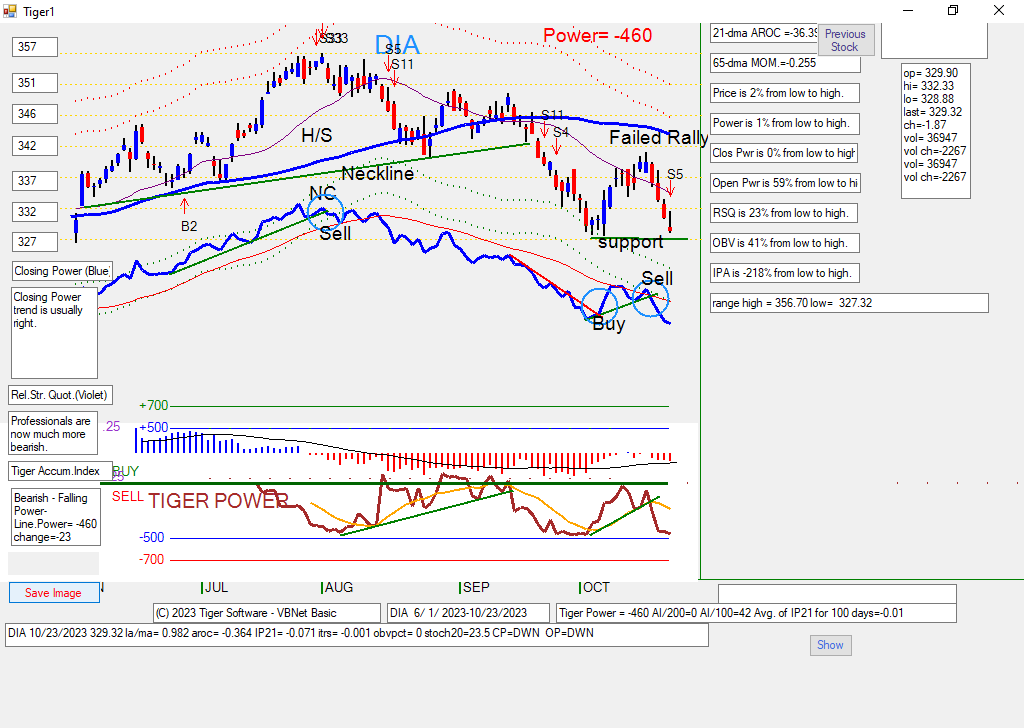
See in the DIA chart, how the uptrending Closing Power line was violated.
The DJI will need to first successfully re-test is recent lows
and the NYSE A/D Line downtrend will have to be broken before much
of a bounce is likely/ Since there is ample overhead resistance
in the DJI chart, including the falling 65-dma, it should be avoided.
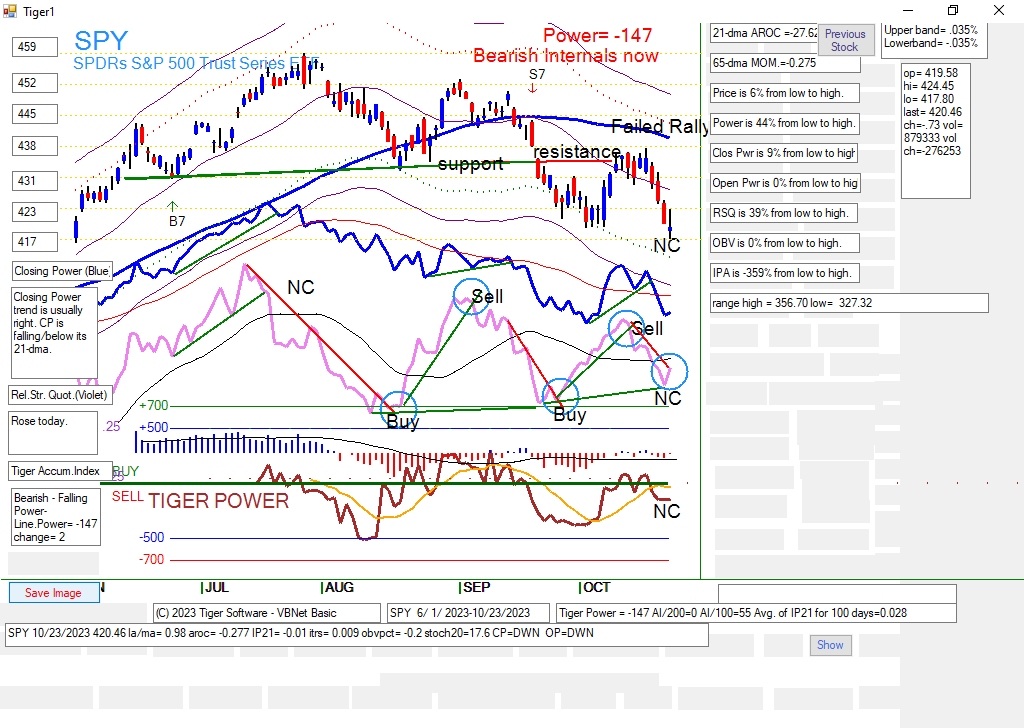
SPY is now at the support of its rising 200-dma. It made a minor new low which
was not confirmed its RSQ or its Closing Power Lines. This often sets up
a reversal if the downtrend-lines are violated. Its RSQ downtrend-line is
close to doing that. The negative Power Index suggests the next rally will be
limited.
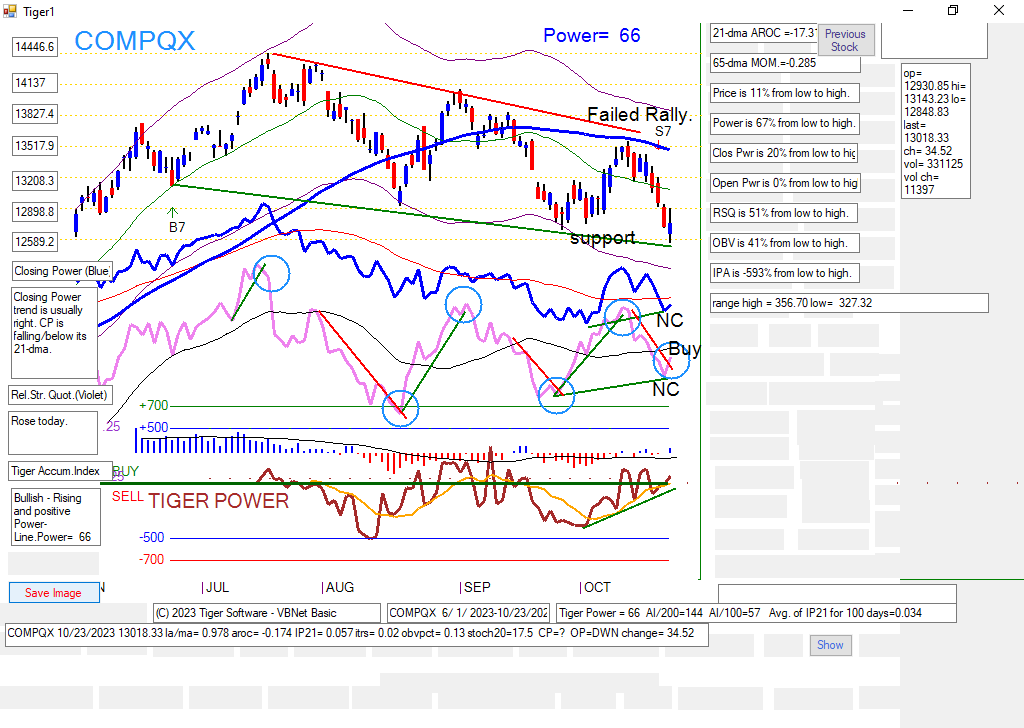
The RSQ downtrend lines for the NASDAQ and QQQ were broken today.
A recovery in these tech plays must be expected. showed broken RSQ (Relative
Strength Uptrends) before Thursday. We viewed this as evidence that
their recent peaks would not soon be surpassed. Now, their Closing
Powers stand violated.
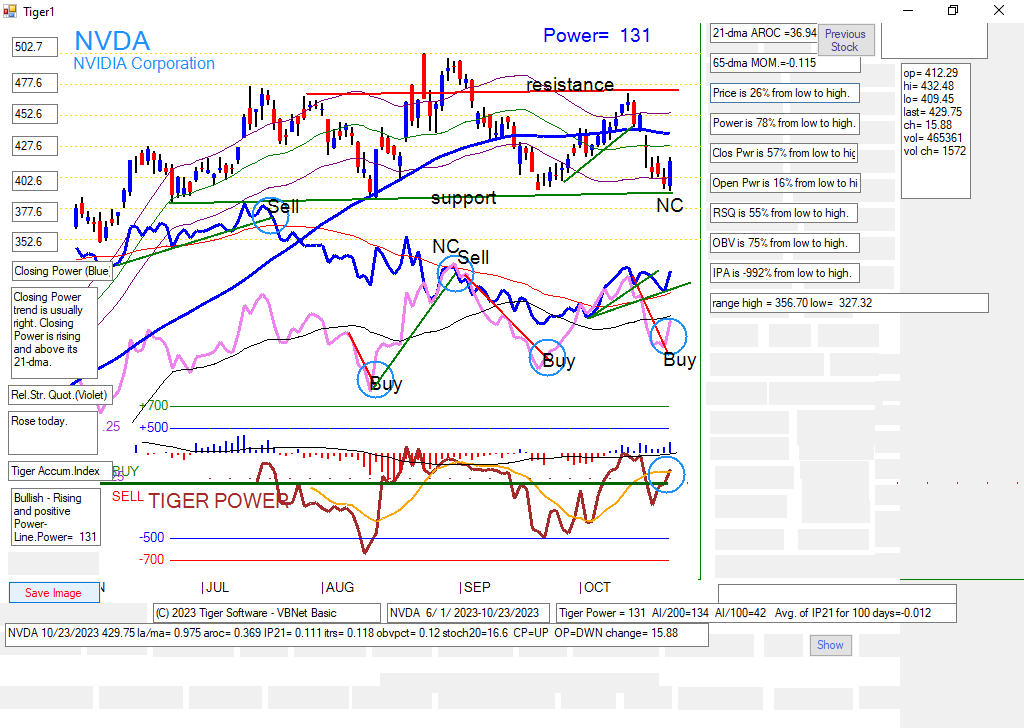
NVDA rose 15.88 from support. As, the leader this should lift many tech stocks today.
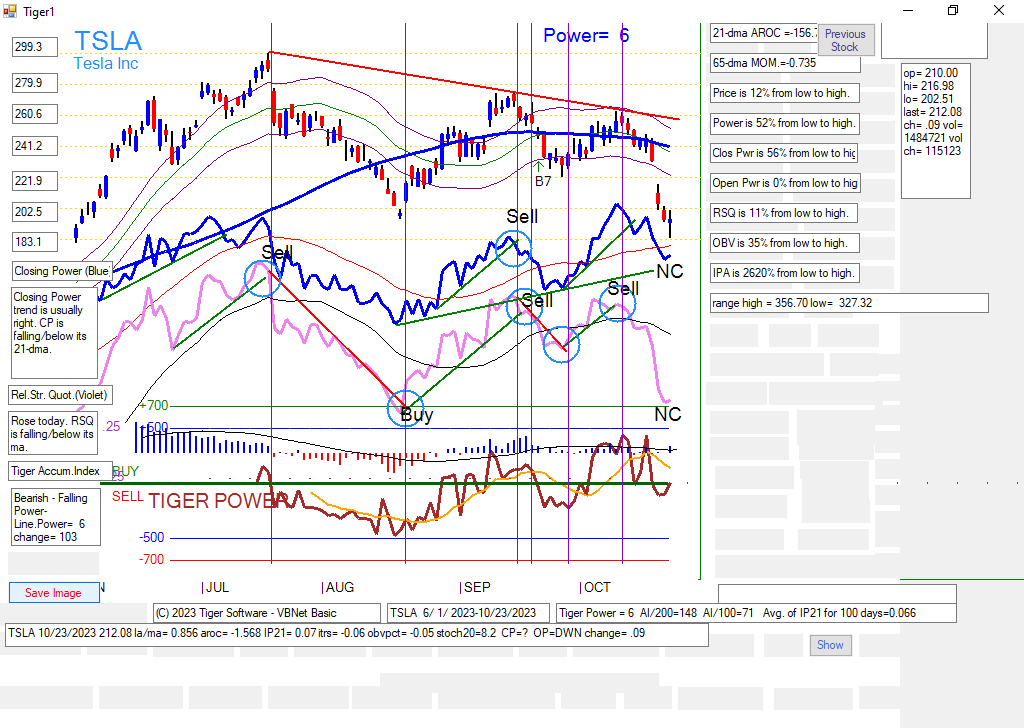
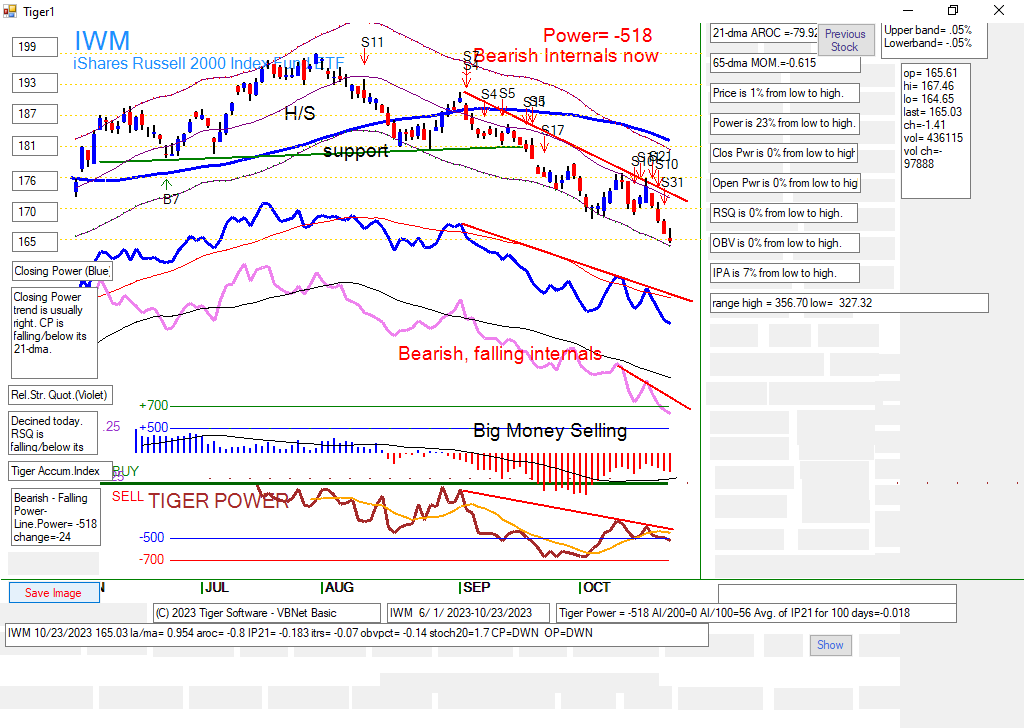
But Goldman Sachs, JETS, TSLA and IWM have dropped back further, as did CAT.
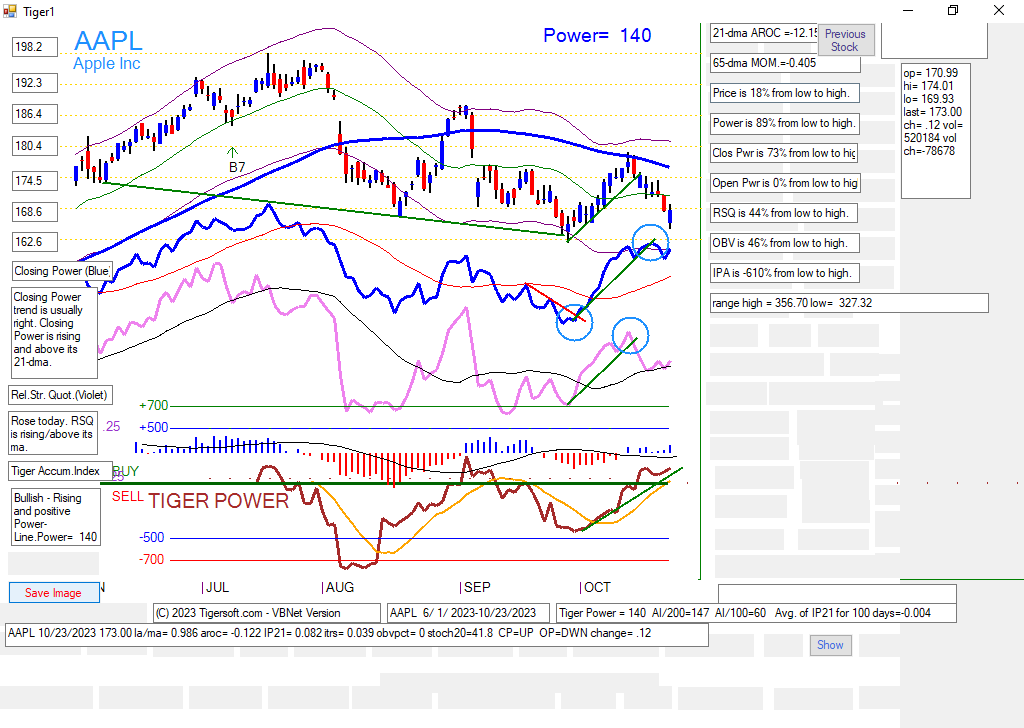
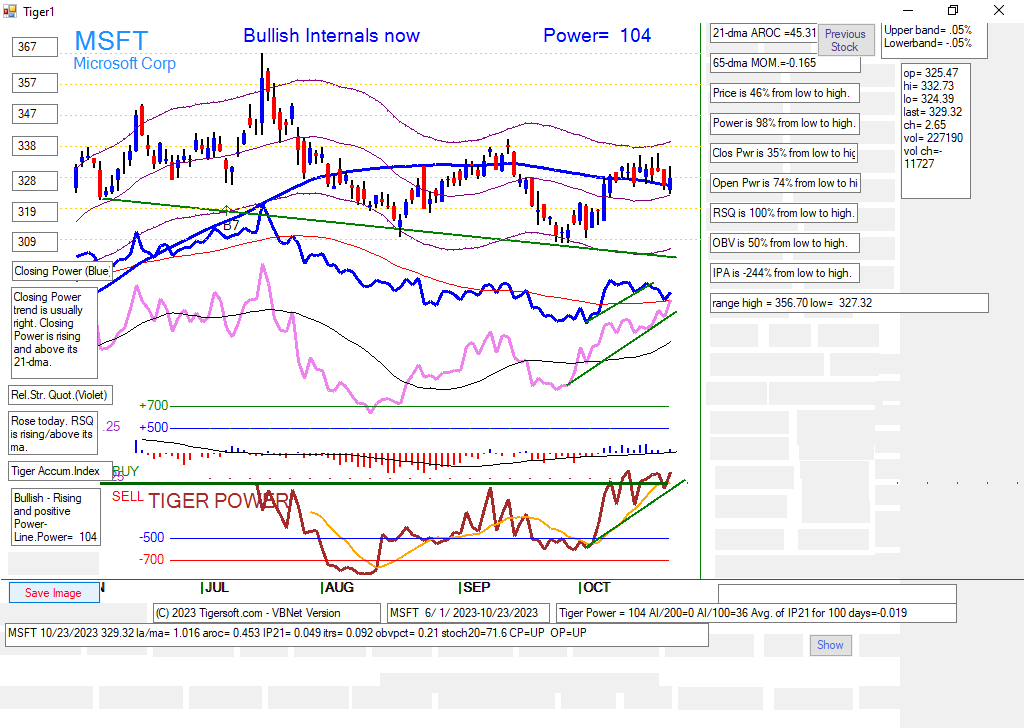
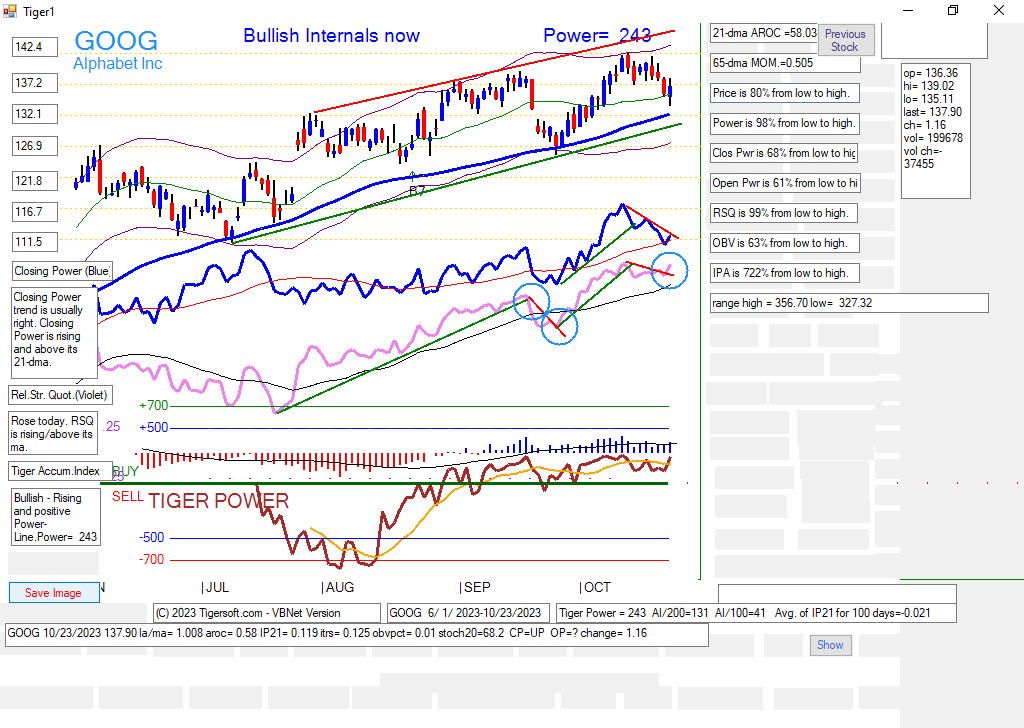
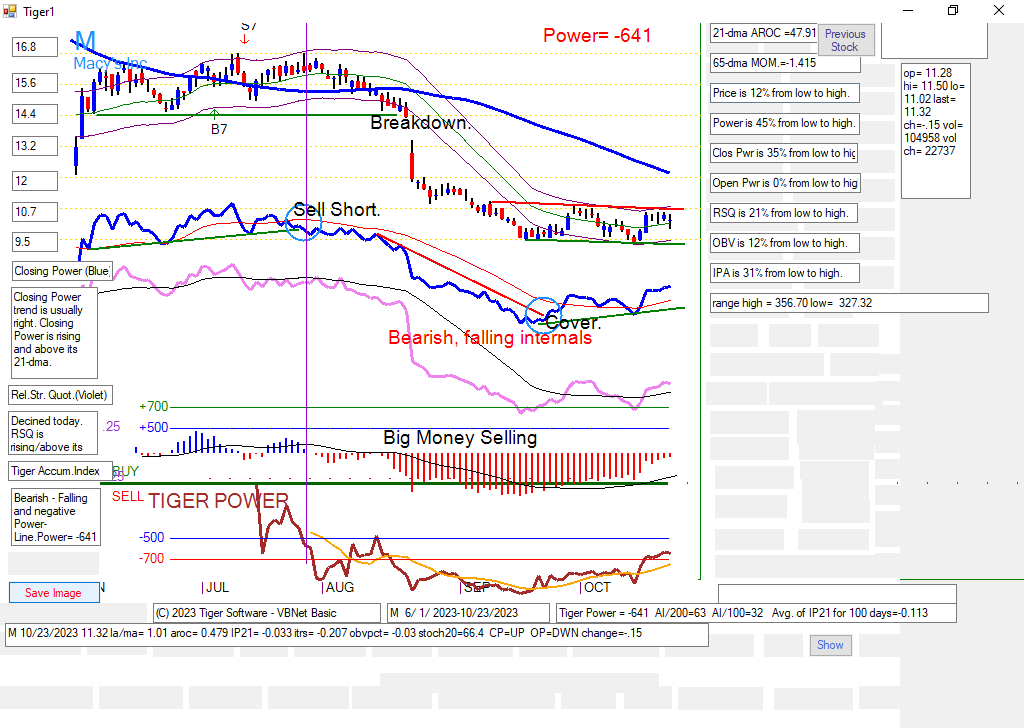
The other charts are posted to help new users of our Window10
candle-stick charts.
Interpretation of Charts
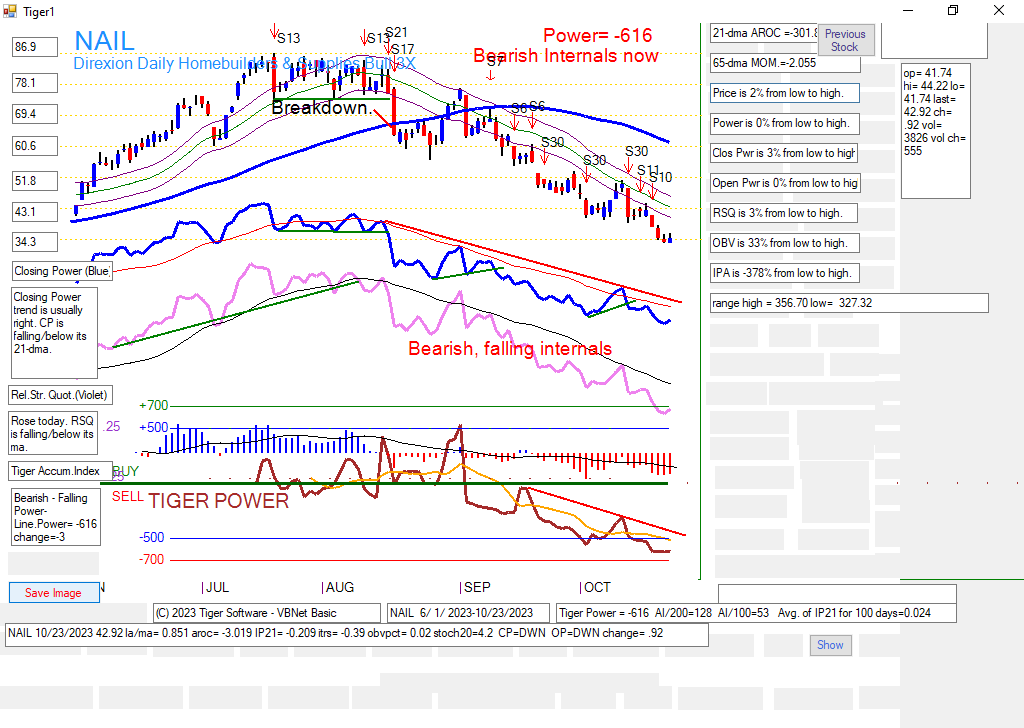
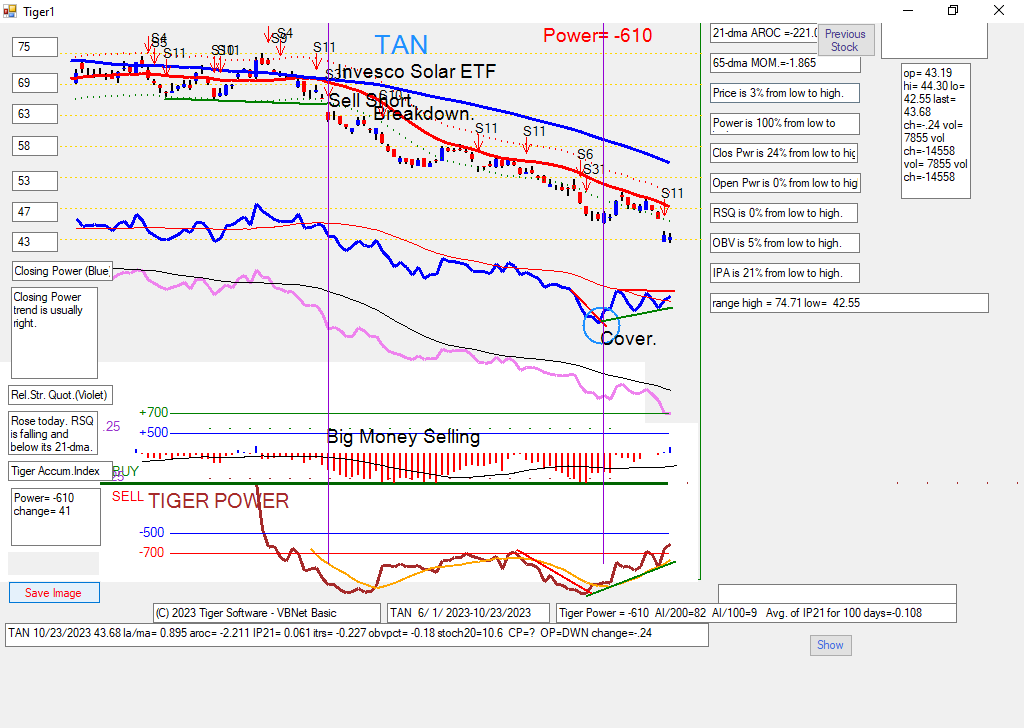
---- When you look at a stock or ETF, focus on the trend of its Closing Power
and Relative Stength. See which of these show trendbreaks that give
the best signals. Volatile stocks and ETFs trade very well using our RSQ's
trend-breaks.
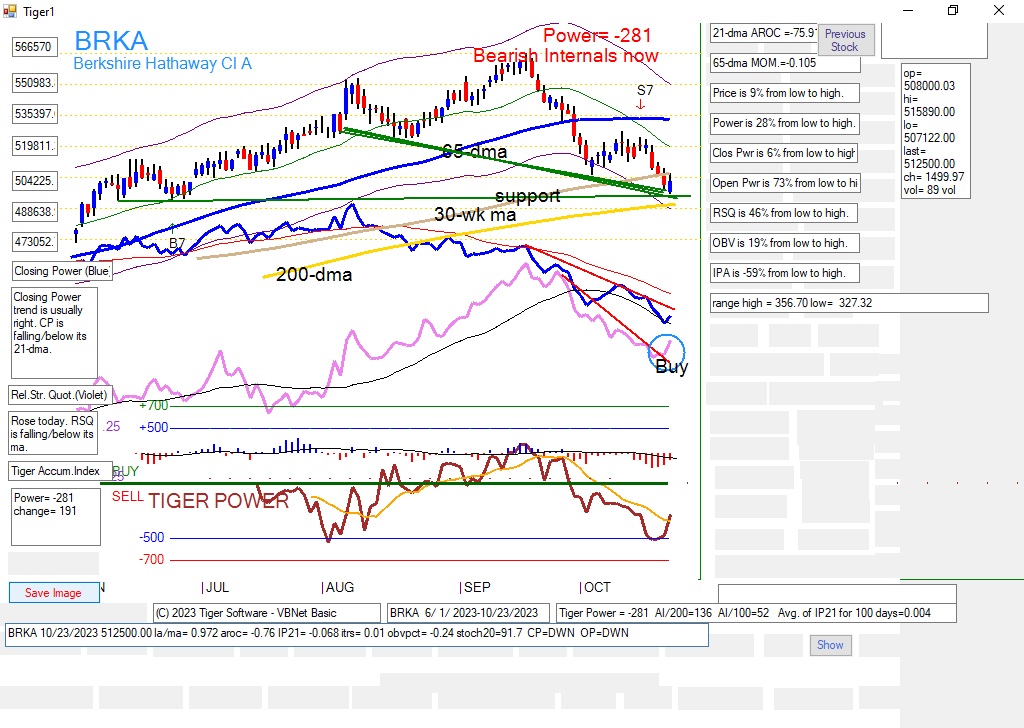
---- If stock is below falling 65-dma and its IP21 is negative, don't buy, though
shorts should be covered when Closing Power downtrend is broken. Reshort
these negative Power stocks, when the minor CP uptrend-line is broken.