Middle Eastern events and rising rates hit the market hard are unrelenting
bearish forces at this time.
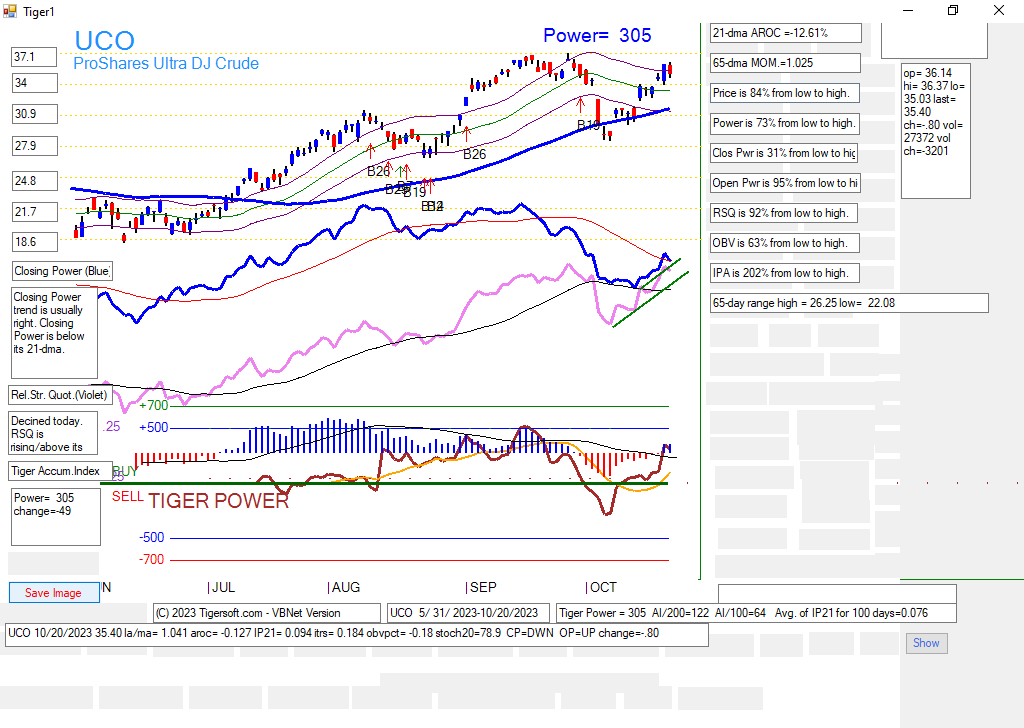
Crude Oil is challenging its highs.
Gold rose past its falling 65-dma.
10-year bonds are now almost 5%
Most stocks fell, leaving only 14% of those over $1 still above their 65-dma.
Deep red big money selling was quite pronounced in many SP-500 stocks.
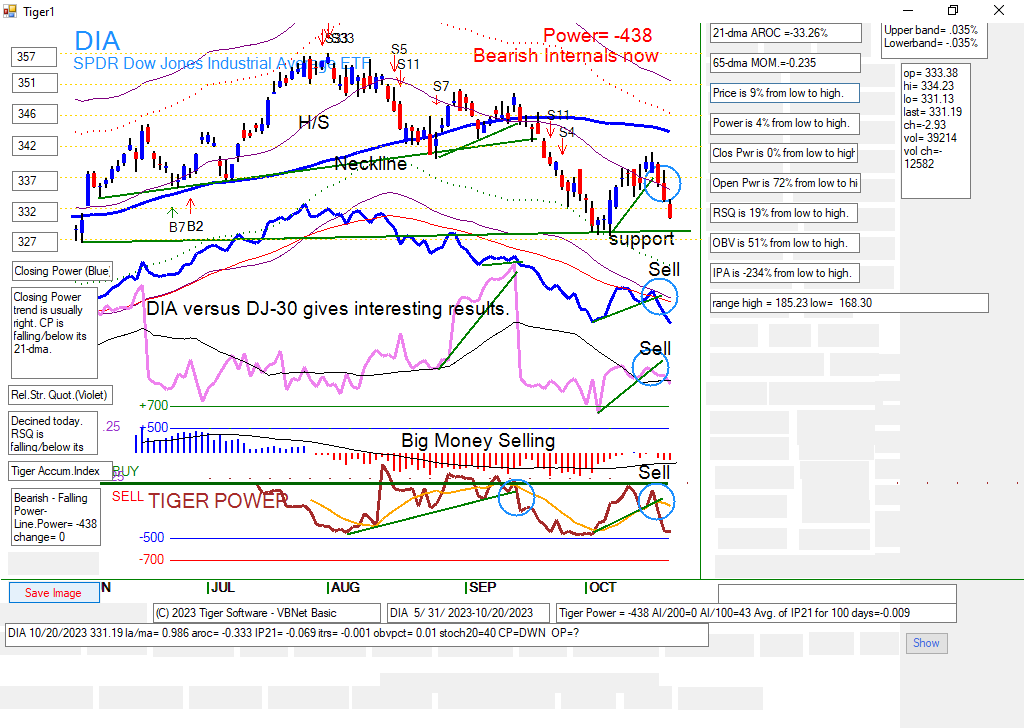
All these forces drove the DJI and most stocks down. As long as Mideast
dangers and rates keep climbing, we should not expect a rally. The FED must
turn rates DOWN,
See in the DIA chart, how the uptrending Closing Power line was violated.
The DJI will need to first successfully re-test is recent lows
and the NYSE A/D Line downtrend will have to be broken before much
of a bounce is likely/ Since there is ample overhead resistance
in the DJI chart, including the fallign 65-dma, it should be avoided.
Though Peerless shows an October Buy, a jump up by the DJI
to its 2.4% upper band will bring a Sell S9.
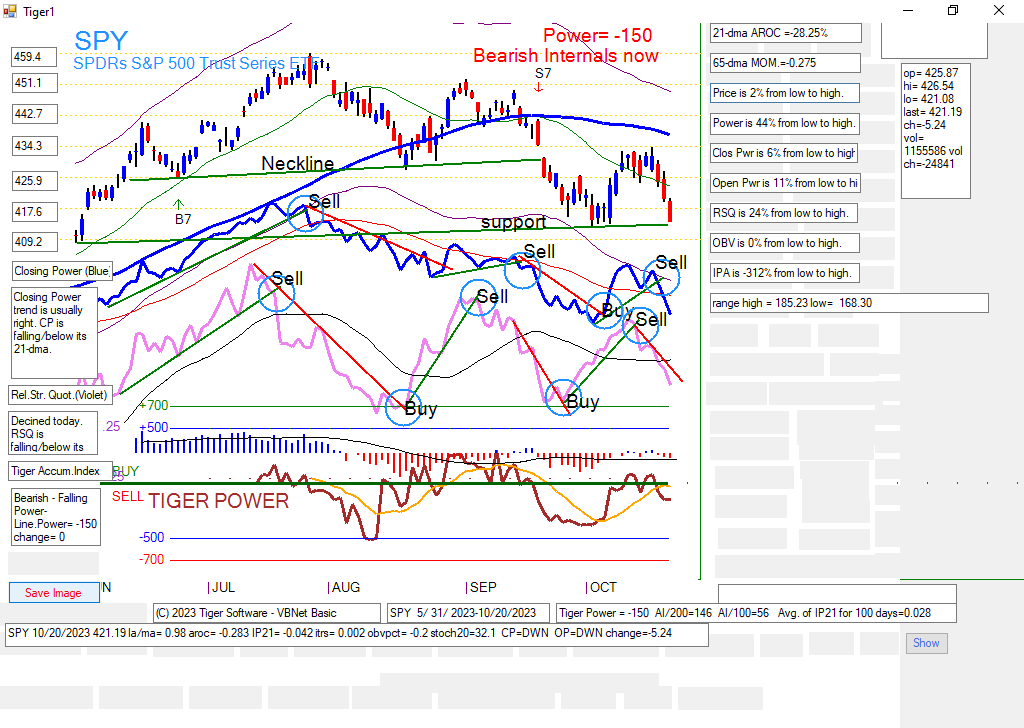
SPY is caught between its rising 30-week ma and its falling 65-dma.
The penetration of its RSQ uptrends is significant, based on how what
has followed such occurrence this past year. Its Closing Power uptrend
was broken. So, its recent lows will are now being test. What happens
here will have lots of impact.
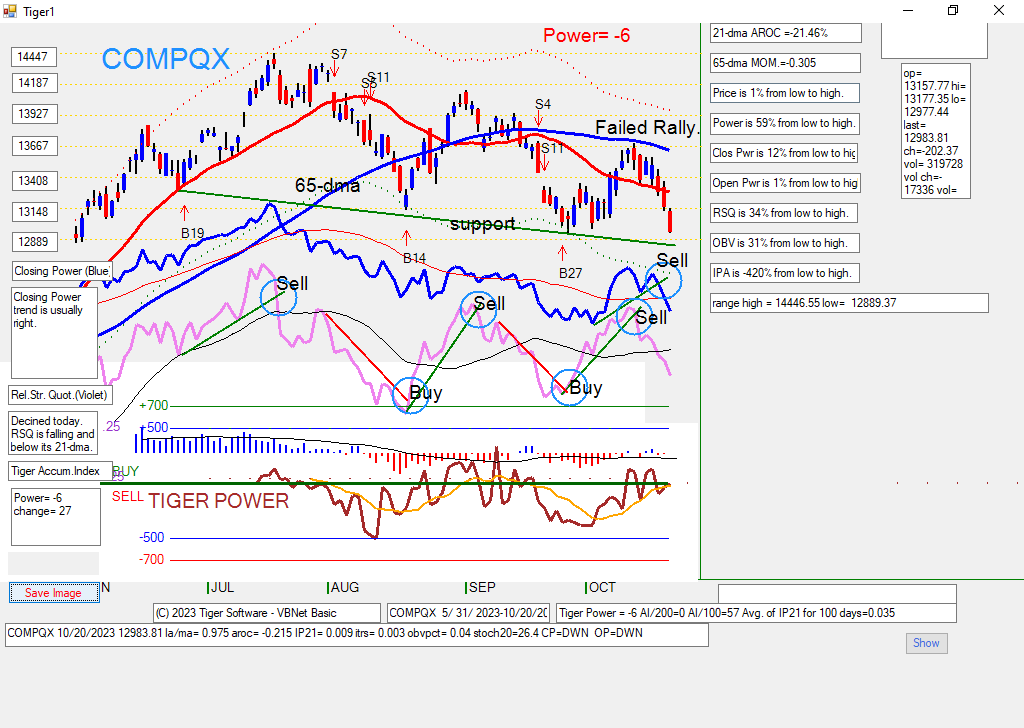
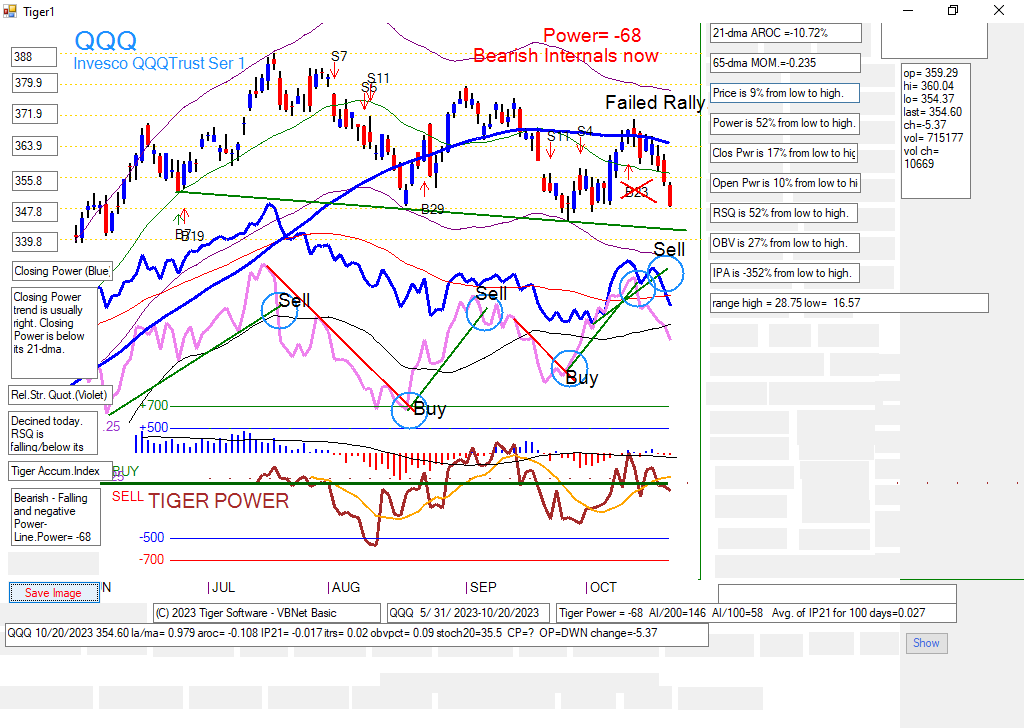
Simimilarly, the NASDAQ and QQQ showed broken RSQ (Relative
Strength Uptrends) before Thursday. We viewed this as evidence that
their recent peaks would not soon be surpassed. Now, their Closing
Powers stand violated. Their spport lines will now be tested.
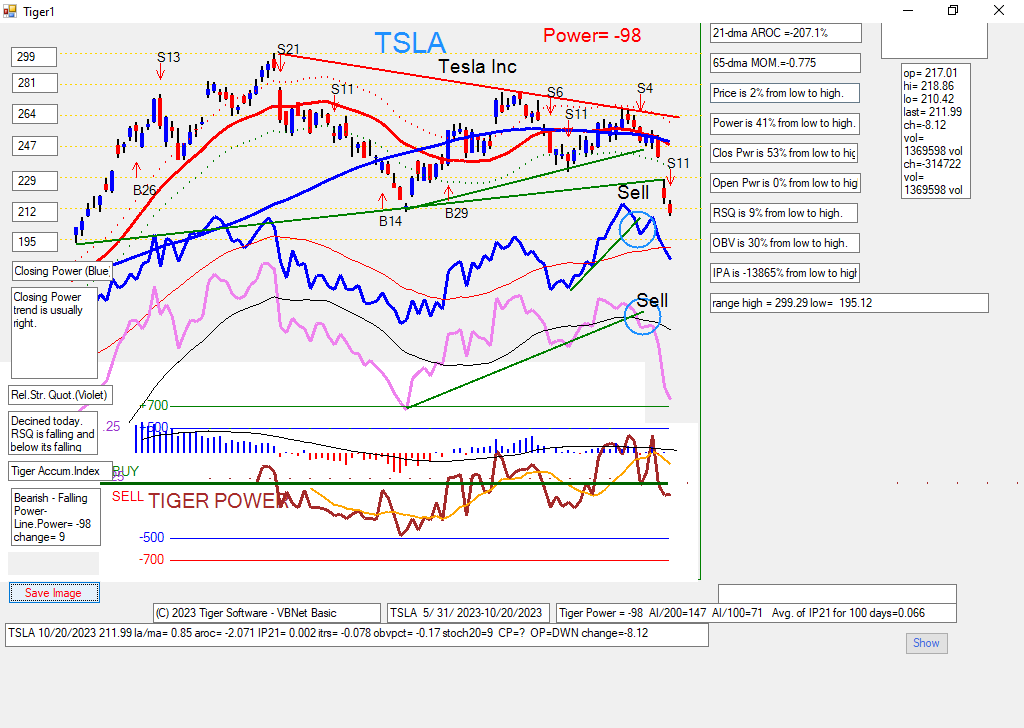
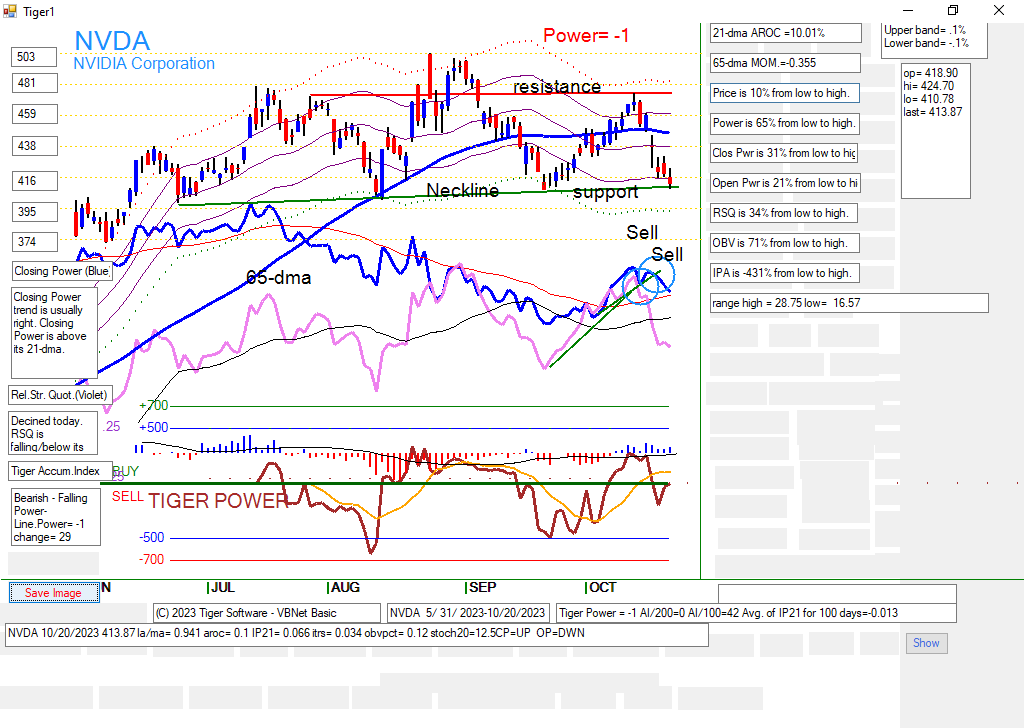
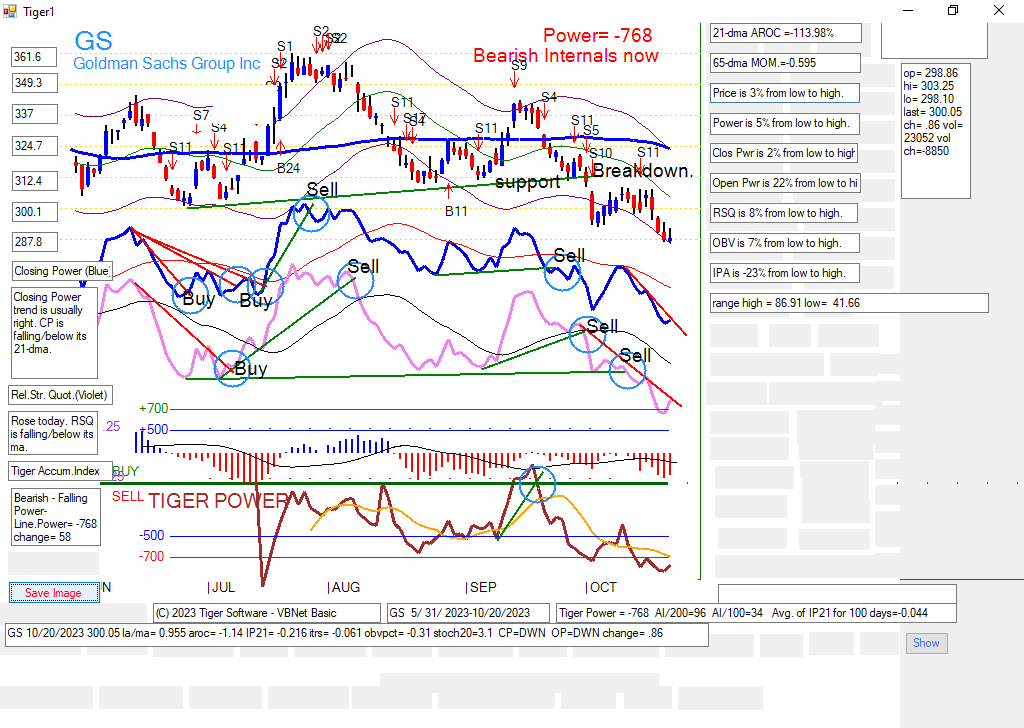
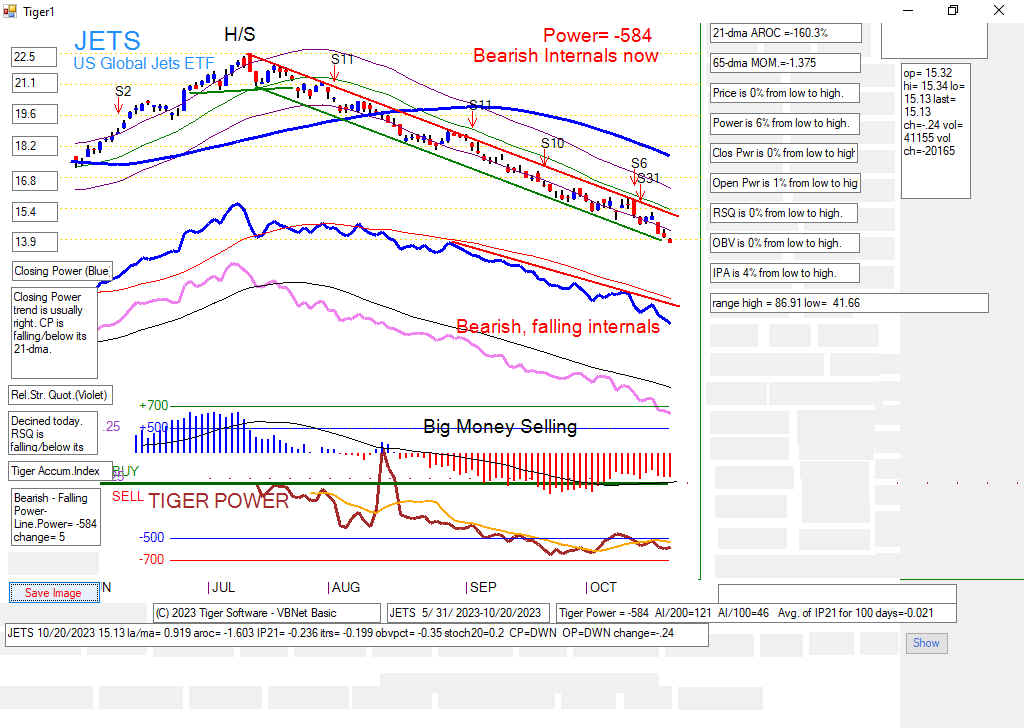
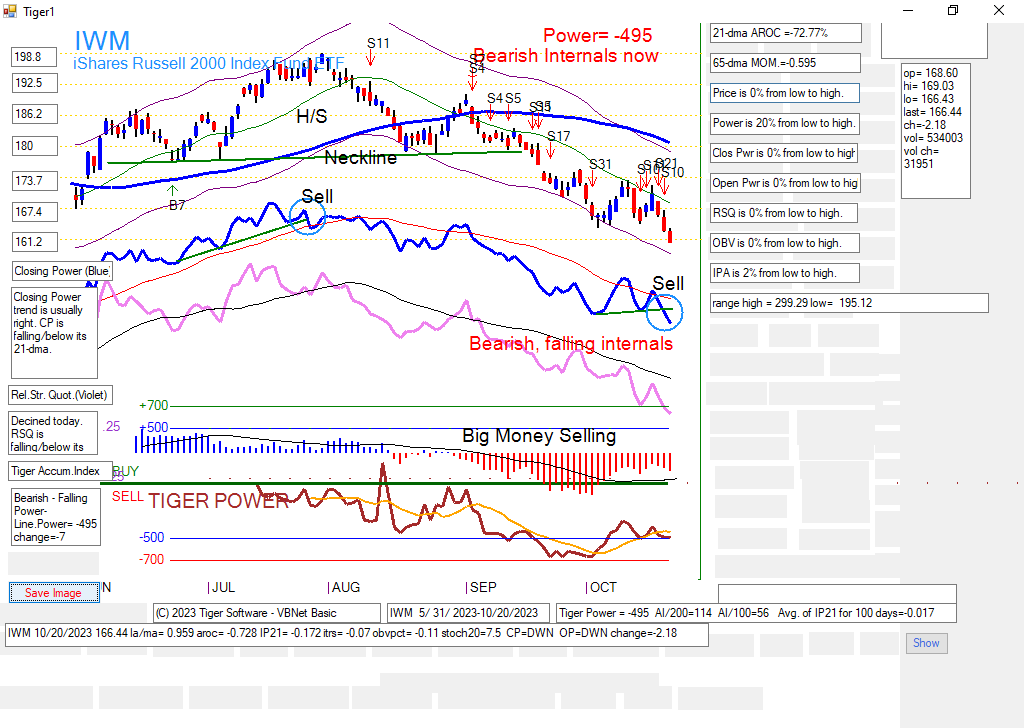
NVDA, Goldman Sachs, JETS, TSLA and IWM have dropped back to important
support. The bulls' case for a rally will be much weakened if their
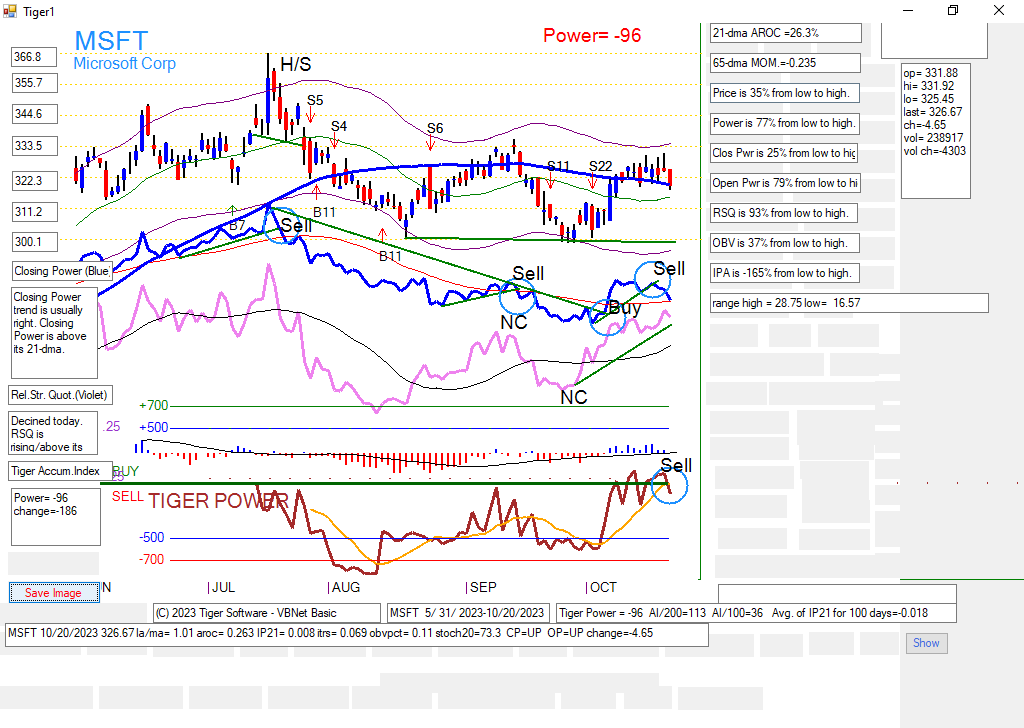
supports do not hold. Watch also CAT. Note ts bearish head/shoulders
pattern. Itsbreak by it below its neckline will cause a deeper decline
that will impact the DJI.
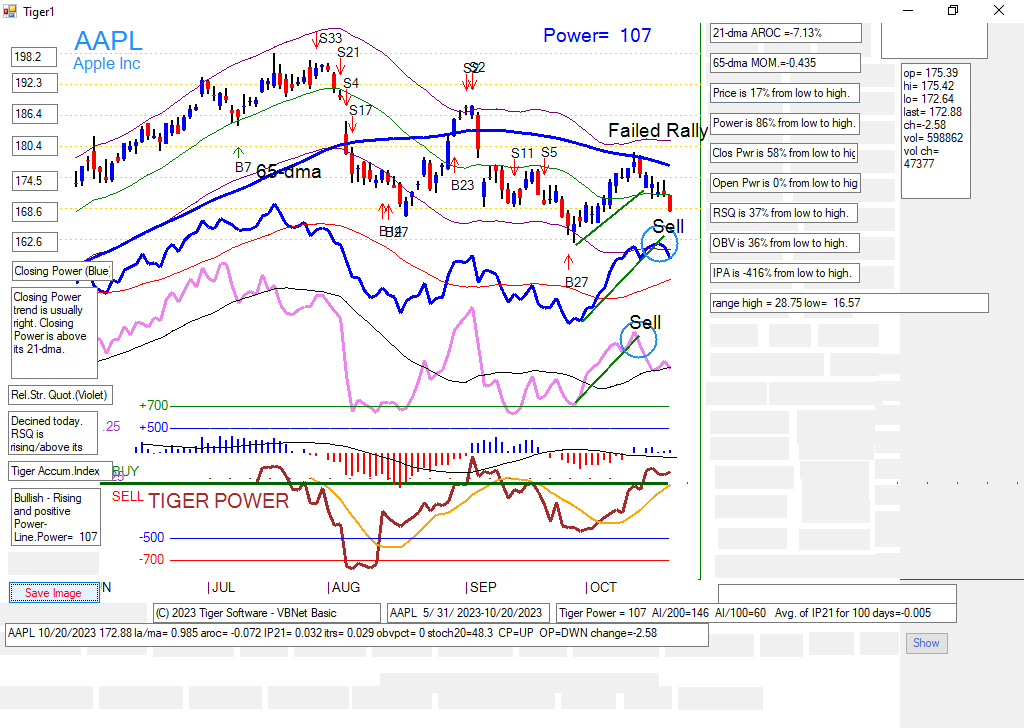
The other charts are posted to help new users of our Window10
candle-stick charts.
Interpretation of Charts
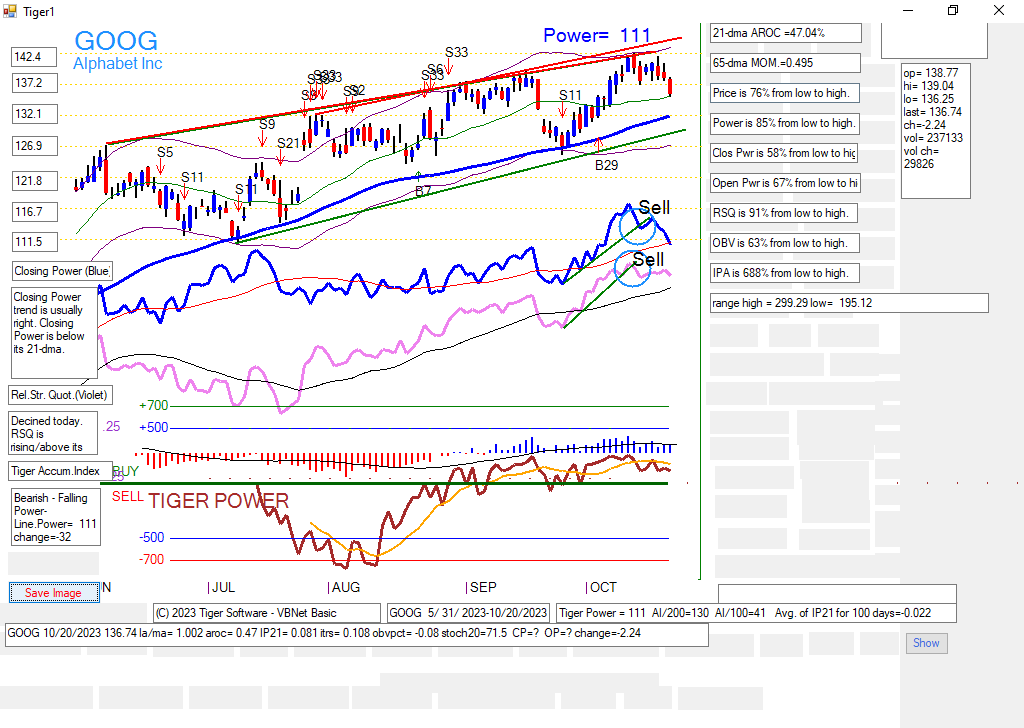
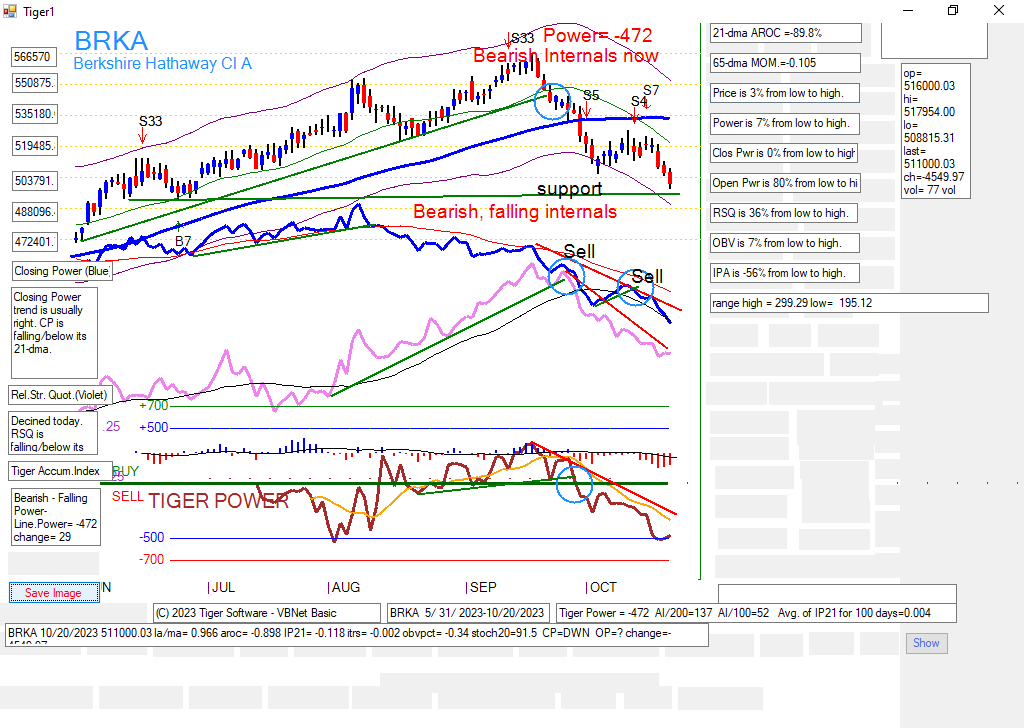
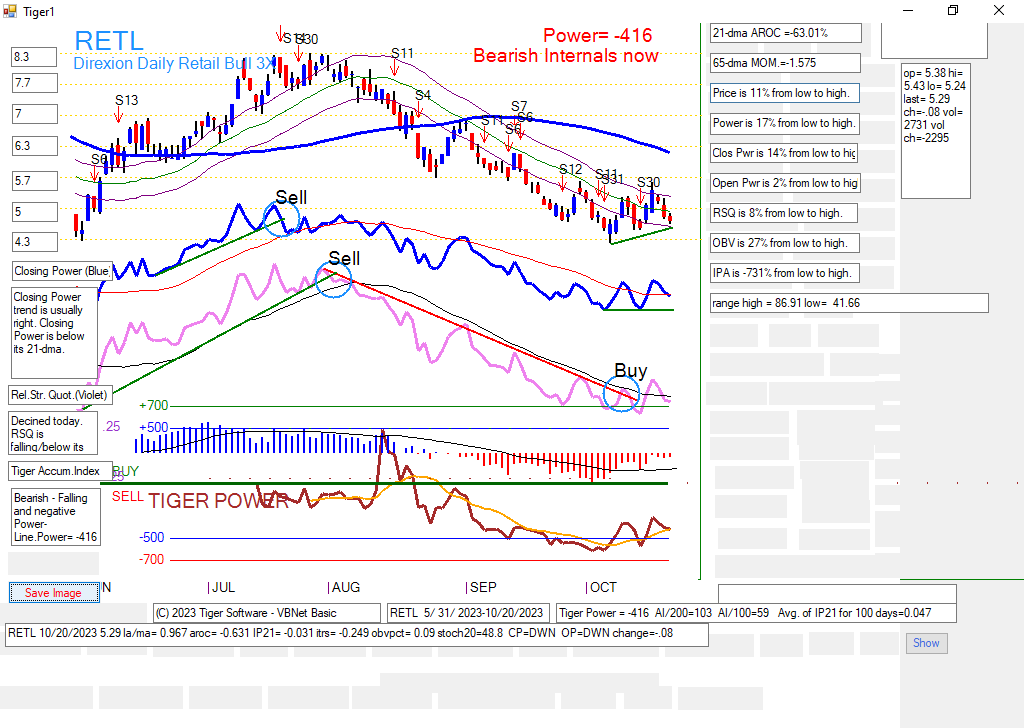
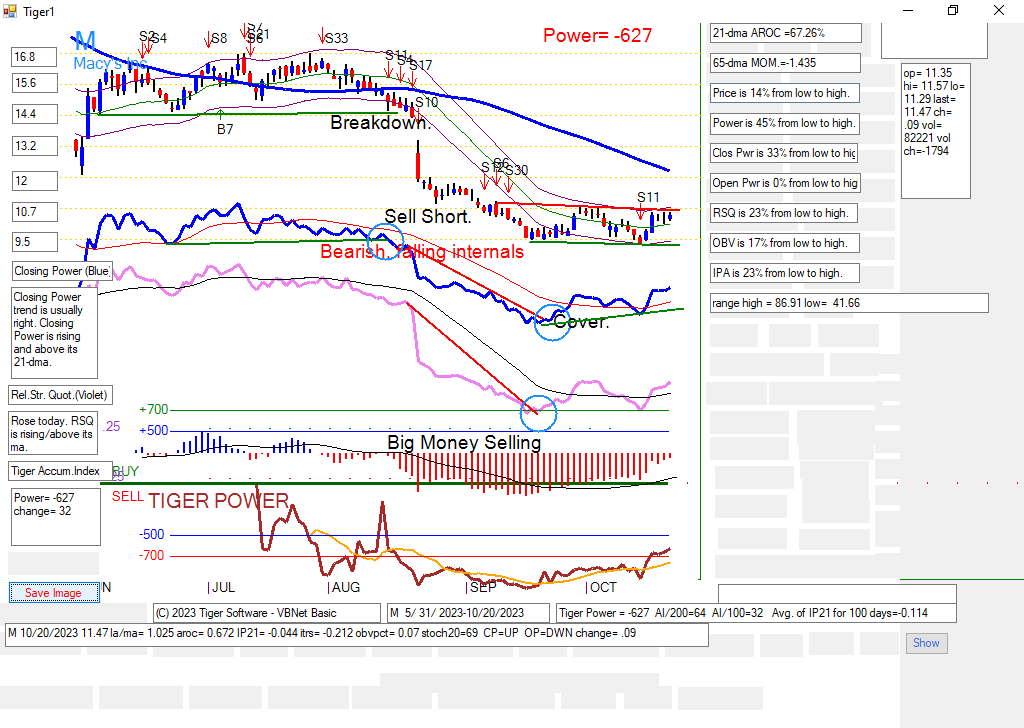
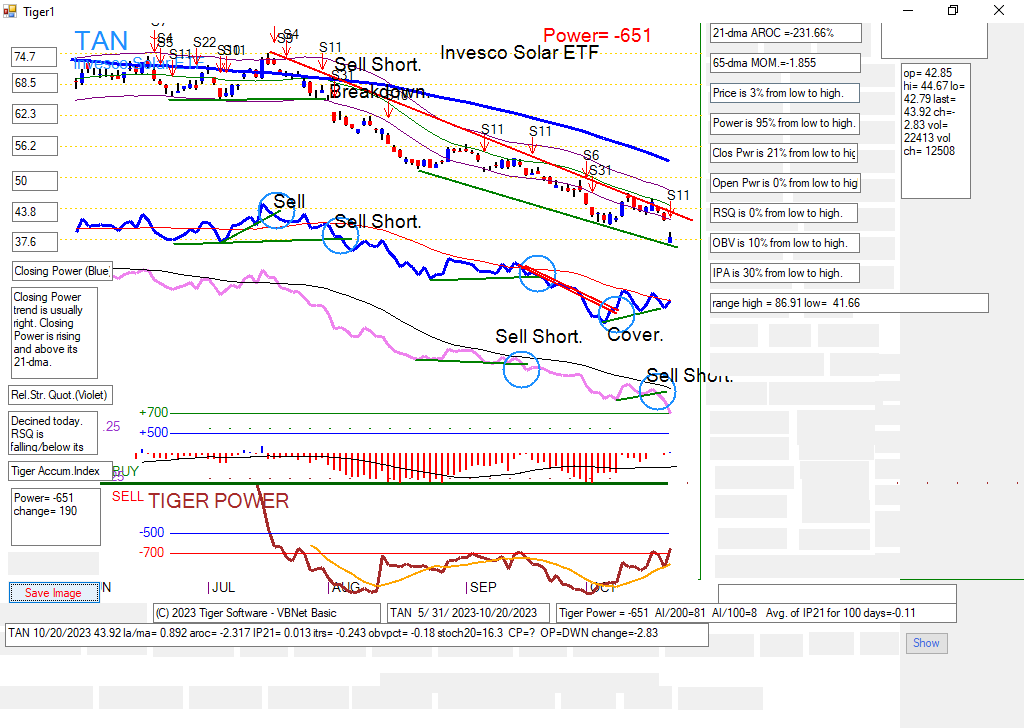
---- When you look at a stock or ETF, focus on the trend of its Closing Power
and Relative Stength. See which of these show trendbreaks that give
the best signals. Volatile stocks and ETFs trade very well using our RSQ's
trend-breaks.
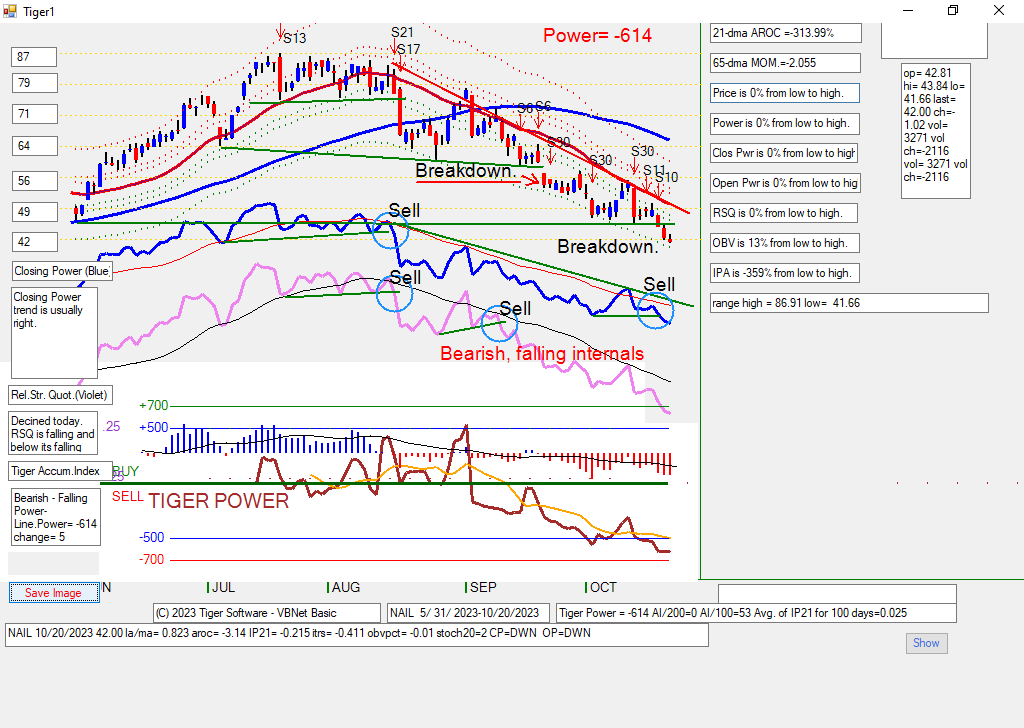
---- If stock is below falling 65-dma and its IP21 is negative, don't buy, though
shorts should be covered when Closing Power downtrend is broken. Reshort
these negative Power stocks, when the minor CP uptrend-line is broken.