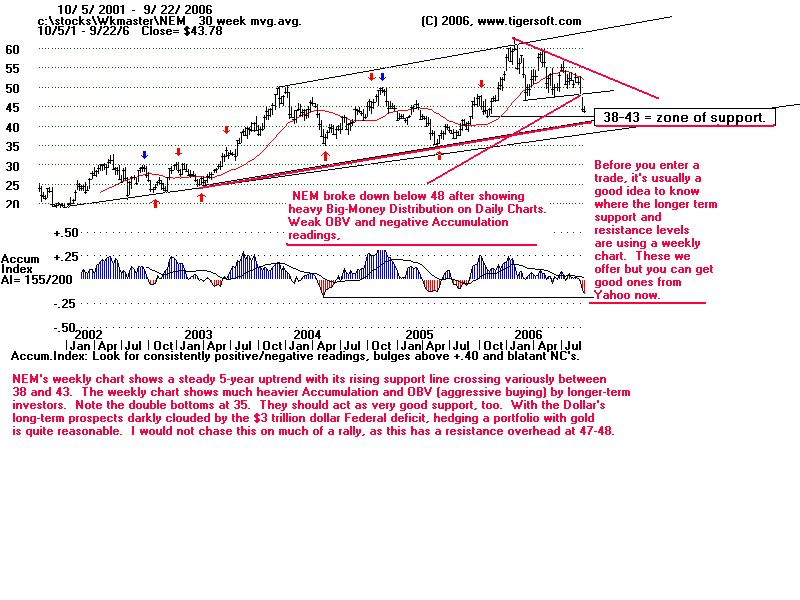
Both Investors and Traders Should Consult 5-Year Weekly Charts. Many times
a daily stock's chart pinpoints the growing weakness - as the Tiger chart of NEM did earlier this
month - but the weekly charts let you get the best price levels for longer-term buying.
The 5-year long-term uptrendline for NEM crosses at 38. A bounce next up from
the 12 month low's at 42 to 45, would be consistent with a decline to 38 and a testing ot
the longer-term uptrendline. The internals of NEM when viewed on a weekly chart
are actually quite good.
