 |
Longer-Term Investing with TigerSoft Here we assume: You are a Longer Term Investor, who wants to hold a typical position 6 months or more. You may have a tax deferred retirement account. You want to maximize gains but definitely wish to avoid big risks. You employ Stocks, Mutual Funds and ETFs http://www.tigersoft.com/ Last updated 10/27/2007 |
Investing with Tiger Soft
Longer term - 6 months to two year or more
Volatility may vary, but risk must be limited.
Using Stocks, Murual Funds or Exchange Traded Funds.
Things you should know.
1. Bull Markets don't last forever. Bear markets can wipe out 20% to 90% of your invesments,
depending on their length and severity. Our website lets you see year after year of the Dow Jones
Inustrial Average with the automatic Peerless Buy and Sell signals..
Peerless Major Signals on DJI-30: 1965-2007
1965 1966 1967 1968 1969 1969-1970 1970 1971 1972 1973 1974 1975 1976 1977 1978 1979
1980 1981 Written in 1981, Peerless called the October 1987 Top and Crash perfectly.
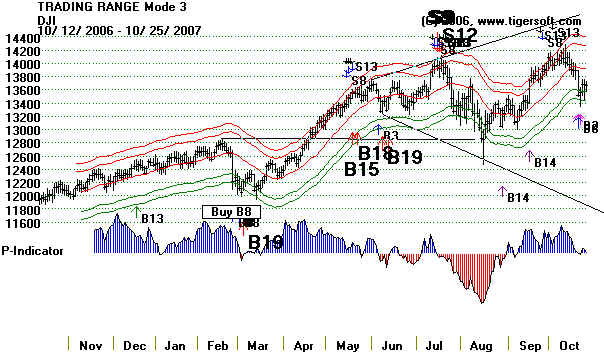
Recently Peerless called the May-June 2006 decline and the July DJI-30 peak at 14,000 perfectly.
1982 1983 1984 1985 1986 1987 1988 1989 1990 1991 1992 1993 1994 1994-5 1995 1996 1997
1998 1999 2000 2001 2002 2002-3 2003 2004 2005 2006 2007
The present bull market started in March 2003. We have now gone a record 55 months without even a
correction of more than 10% on the DJI. Instead of just buying and holding your investments until
you need the money or your emotions get the better of you, we want you to use our Peerless Stock
Market Timing. Peerless shows you how to avoid the bad times and come back in when it's safe. Peerless
can make your investing much safer and much more profitable.
2. Using the Peerless automatic Buy and Sell signals on the general market using the DJIA can put a lot
more money in your pockets no matter what you trade.
http://www.tigersoft.com/--1--/index.html
3. Peerless keeps on working. We have even back-tested it to 1915, though some of the data
is incomplete. Get out before there is a sharp sell-off.
1929 top .... http://www.tigersoft.com/1929-1965/DJI1929.gif
Nazi attack on Western Europe ... 1940 ... http://tigersoft.com/charts/adji3940.gif
Japanese attack on Pearl Harbor ... 1941 ... http://www.tigersoft.com/1929-1965/DJI1941.gif
Cuban Missle Crisis - 1962 ... http://www.tigersoft.com/1929-1965/DJI1962.GIF
October 1987 Crash ... http://www.tigersoft.com/Peerless-Signals/dji87.gif
Peerless Stock Market Timing:
1965-2007 Track Record
+17.5% to +28%/Year on DJI-30
2002-2007 Buys and Sells
Date Signal DJI Gain
-------------- --------- ---------- --------------
5/15/2002 Sell 10244 +20.0%
7/24/2002 Buy 8191 +7.1%
1/6/2003 Sell 8774 +14.2%
3/11/2003 Buy 7524 + 41.1%
2/20/2004 Sell 10619 +3.7%
3/12/2004 Buy 10240 +3.2%
4/6/2004 Sell 10571 +5.7%
5/10/2004 Buy 9990 +2.9%
1/3/2005 Sell 10729 +4.8%
4/21/2005 Buy 10219 +13.3%
5/5/2006 Sell 11577 +6.8%
6/12/2006 Buy 10793 +14.9%
1/5/2007 Sell 12398 +2.8%
3/5/2007 Buy 12050 +15.9%
7/17/2007 Sell 13972 +4.9%
8/29/07 Minor Buy 13289 +3.7%
10/3/07 Minor Sell 13968 +3.2%
10/19/07 Minor Buy 13522 Open
List of All Peerless Buys/Sells: 1965-200
4. Retirement accounts can really
blossom with Peerless Stock market Timing.
Example: Buying and Holding
the Dow Jones Industrial Average (DJIA) since 1965 would have gained
you +6.7%/year since 1965
or 6.9% over the last 10 years. Simply buying the DJIA when Peerless
gave a buy and selling it
when Peerless gave a sell would have gained you 17.5%/year.
return of +21.9%, as Peerless has since 1965, would turn your $200,000 into $538,329.
Over 12 years, 6.7% will grow $100,000 into $217,757. On the other hand, getting a return
of +21.9%, as Peerless has since 1965, would turn your $100,000 into $1,076,575.
Over 20 years, 6.7% will grow $40,000 into $146,335. On the other hand, getting a return
of +21.9%, as Peerless has since 1965, would turn your $100,000 into $2,099,588.
Go to http://www.tigersoft.com/Returns/index.html
5.. Regardless of the sector you invest in, the Peerless Buy and Sell signals let you improve
upon buying and holding. Think of the market as a tide that lifts and then lowers all boats. The
only exceptions are oil, precious metals and real estate. Our study of Fidelity Sector funds
proves this. Here are our studies:
http://www.tigersoft.com/mutuals/Peerless%20signals%20-%20Fidelity.html
http://www.tigersoft.com/mutuals/index.htm
6. When you become more confident that you can avoid a bear market, you can become more
aggressive in your investments. This will increase your returns. In this, TigerSoft can show you
how to find the best indidual stocks and mutual funds. Our nightly hotline reviews stocks
and industry groups each night. See example. http://www.tigersoft.com/AAA/index.html
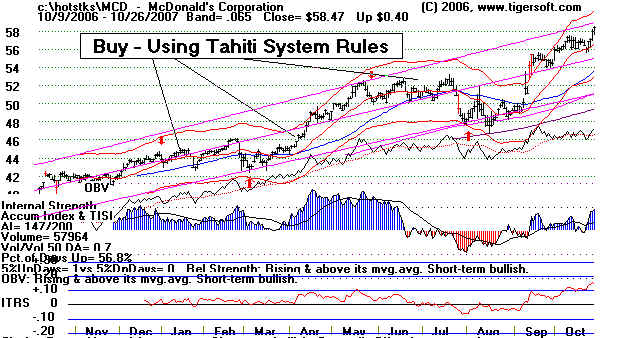
7. Use our Tiger Tahiti System, invest in the most accumulated DJI-30 stock as measured
by our Tiger Power Ranker and make 24%/year. Back-tested to 1970, this system buys only
the safest blue chips, one each quarter, which we hold for nearly 2 years unless our Peerless system
flashes a multiple set of Sells in a six month period. This is extremely silmple to follow. And you
add to positions over a 21 month period, so that market fluctuations are not reduced.
See http://www.tigersoft.com/educate/tahiti.htm

8. Buy the stocks that are the most intensely accumulated, using the rules of the Tiger Insider
Watch system. These are often more speculative stocks. We buy them because we have
such clear evidence that insiders are buying.them Since 1990, when held automatically for a year,
these stocks have produced an average annual gain of 36% per year.
Book and System - http://www.tigersoft.com/--3--/index.html
Recent examples - http://www.tigersoft.com/Tigersoft-Explosive/index.html
9. The biggest gainers usually show intense insider buying early in their advances. Learn
to spot these tell tale signs using our books and software. Rank the best performing
stocks of any period and you will see the same patterns we show you how to spot.
For example: The best perfoming stocks of 2006-2007
http://www.tigersoft.com/Biggest%20Gainers/index.html
The best and worst performing stocks of 2007
http://tigersoft.com/Tiger-Blogs/8-30-2007/index.htm
10. Don't be afraid to take a small loss. Our 36%/year gain jumps up to 55%/year if
you apply a simple stop loss we will tell you about. Call 858-273-5900 or email
william_schmidt@hotmail.com
11. Our "Explosive Super Stocks" book discusses when to sell these super stocks. They
do not go up forever. You have to know when to take profits.
12. Finding the strongest sector and then using Tiger's Power Ranker to find the strongest
stocks in that sector pays off over and over. If you look at the sample HOTLINE
we show, from December 2006, you can see how well the Chinese stocks we mentioned
there have done.
