

| TigerSoft's Analysis of 35 Gold
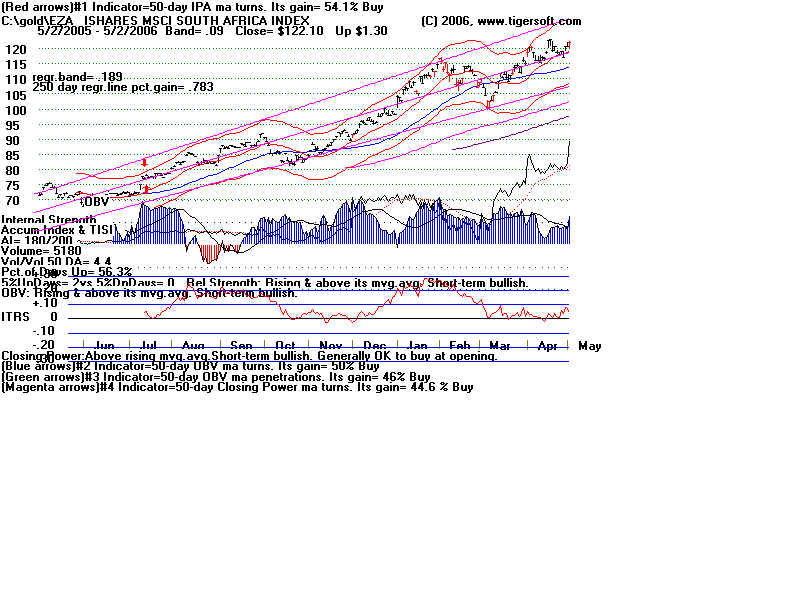
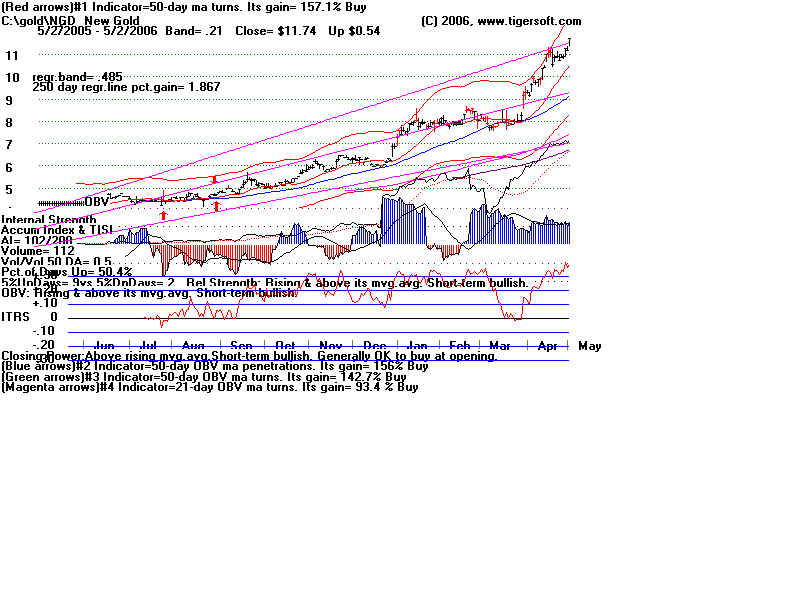
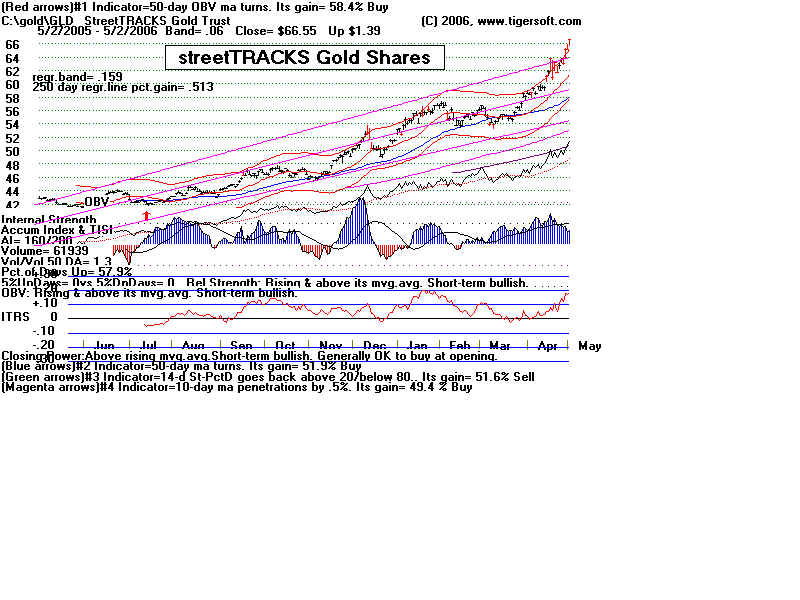
and Silver Stocks: 5/2/2006 The ideally bullish stock will have the following conditions. <> Short-Term Accumulation Intensity = .50 or higher <> Long-Term (LT) Accumulation = 200 <> Above 180 is exceptionally bullish, AI/200 must be at least 100.) <> At rising 50-day moving average. High Vulnerability is over 30%. Below falling 50-day mvg.avg. is bearish. <> Stock should be over $5.00 By these standards most bullish stocks are: EZA, NGD, KRY. GLD and BGO (See tables and Tiger charts below.) Price LT Accum Short-Term . Annualized Price Accum Rate of Change ------- ----------- ------------- ------------------- EZA ISHARES SOUTH AFRICA INDEX 122.1 180 .32 78.3% NGD New Gold 11.74 NA .30 186.7% KRY Crystallex International 5.37 123 .19 20.8% GLD StreetTRACKS Gold Trust 66.55 160 .17 .. 51.3% BGO Bema Gold 5.68 155 .15 189.0% |
35 Gold and Silver Stocks: Ranked for Accumulation Intensity
Pct Change based on 3 / 31 / 2006 - 5 / 2 / 2006
Expected Price Gain is the product of Long-Term Accumulation (col. 7) and Intense Accumulation (col.2)
Risk is measured by how far the stock is above the 50-day mvg.avg.
Vulner'ity Long_term
Rank Accumul. Symbol Name Price Pct.Gain % over 50dma Accumulation
Intensity (0-200)
------ --------- --------------------------------- ------------ ----------- -------------- ------------
1 .32 EZA ISHARES SOUTH AFRICA INDEX 122.1 6% 7.3% 180
2 .30 NGD New Gold 11.74 26% 28.5% 102
3 .25 WTZ Western Silver Corp. 29.72 26% 30.5% 101
4 .24 GG Goldcorp Inc. 38.13 30% 30.9% 85
5 .20 RBY Rubicon Minerals Corp. 1.46 2% 14.9% 108
6 .19 KRY Crystallex International 5.37 30% 29.6% 123
7 .18 IAG IAMGOLD Corp. 9.97 15% 13.5% 97
8 .17 GLD StreetTRACKS Gold Trust 66.55 14% 14.8% 160
9 .17 GLG Glamis Gold Ltd. 41.15 25% 28.5% 104
10 .16 IAU iShares COMEX Gold Trust 66.69 14% 14.8% 143
11 .16 XAU GOLD STOCK INDEX 160.48 13% 13.8% 116
12 .15 BGO Bema Gold Corporation 5.68 28% 23.1% 155
13 .15 EGO Eldorado Gold Corp. 5.58 16% 19.4% 110
14 .15 MDG Meridian Gold Inc. 33.18 11% 17.7% 121
15 .11 HMY Heilig-Meyers Company 16.94 6% 11.5% 126
16 .09 AEM Agnico-Eagle Mines Ltd. 37.75 23% 27.9% 147
17 .09 AGT Apollo Gold Corp. .67 -11% 1.1% 181
18 .09 GFI Graham-Field Health Prod. 25.74 17% 16.2% 108
19 .08 KGC Kinross Gold Corporation 12.83 17% 22.8% 122
20 .06 CEF Central Fund of Canada 9.48 19% 14.4% 123
21 .04 SLW Silver Wheaton Corp. 10.95 2% 10.2% 161
22 .03 ABX Barrick Gold Corp. 31.19 14% 11% 103
23 .02 NEM Newmont Mining Corp. 57.68 11% 8.7% 67
-----------------------------------------------------------------------------------------------------
24 0 CDE Coeur d'Alene Mines Corp. 6.31 -4% .9% 111
25 0 GBN Great Basin Gold Ltd. 2.4 8% 19.6% 160
26 0 RYPMX Rydex Precious Metals Inv 60.66 11% 13.2% 0
27 -.02 ASA ASA Limited 70.84 8% 11.9% 122
28 -.05 SIL Apex Silver Mines Limited 17.7 -26% -24.2% 109
29 -.05 SWC Stillwater Mining Company 17.55 6% 12% 122
30 -.06 EGI Entree Gold Inc. 2.46 4% 14.5% 132
31 -.09 AU Anglogold Limited 54.78 1% 5.5% 118
32 -.10 GSS Golden Star Resources Ltd. 3.53 10% 10.9% 89
33 -.10 SSRI Silver Stand Resources Inc. 20.46 -1% 5% 89
34 -.11 FCX Freeport-McMoRan C & G 64.75 8% 11.6% 139
35 -.12 HL Hecla Mining Company 6.19 -7% 5.3% 93
|
 |
 |
 |
 |