Buys & Sells for Every Stock,
ETF, Commodity You Graph.
See also TigerSoft's TRADING RANGE BUYS/SELLS

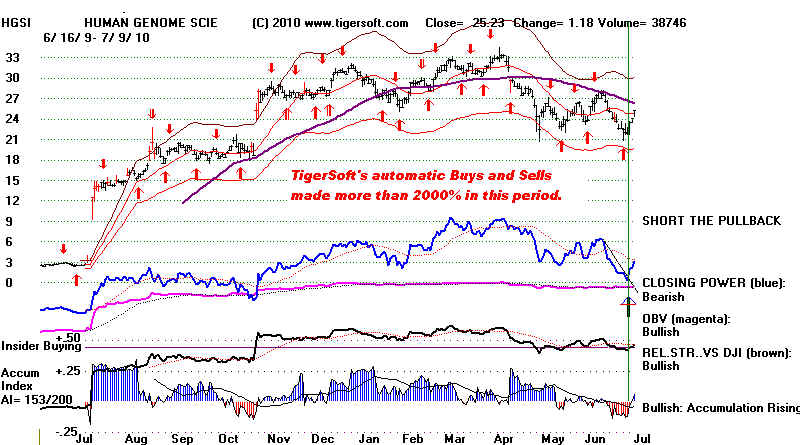
HGSI - TigerSoft Gain = +3026.8%, 2009-2010
Statistics TigerSoft shows for each stock.
27 winning trades, 6 losing trades.
Biggest Gains = +451%, 40%, 31%
Biggest Paper Loss = 14.5%
HGSI between 2009-2010 was a prime example of how TigerSoft can make
you big money. . Using Tiger's red Buys to go long HGSI and its red Sells to
sell and sell it short would have gained a trader more than +3000% in the
last 12 months. Each year there are stocks and ETFs like this. Find them
early on with TigerSoft. Why let the Professionals make all the money?
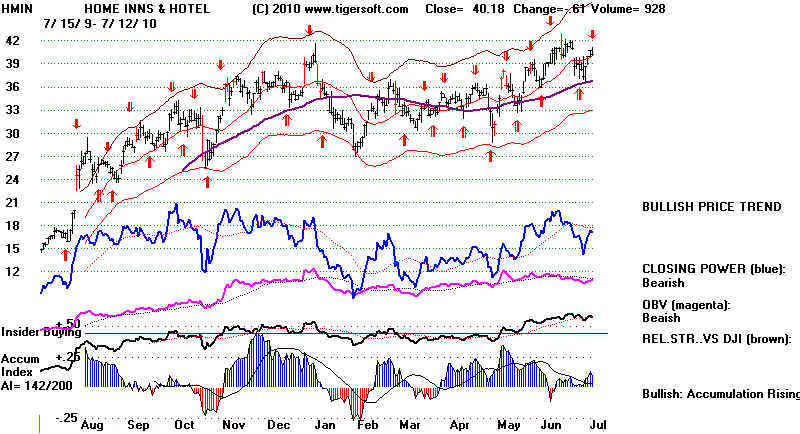
Review: TigerSoft Internal Strength Indicators:
1) The Blue Closing Power below the price bars measures
net Professional buying or selling. We distinguish it
from Public buying/selling.
2) The Magenta OBV Line crudely measures aggressive and
selling oressure. It is often less sensitive than the indicators
we have created.
3) The Brown Relative Strength Line measures how well the
stock is doing when compared with the general market.
4) The Blue (positive) and Red (negative) Accumulation Index
measures patient buying and selling. At the extremes, it
shows insider buying and insider selling. With it, we
can distinguish patient accumulation from emotionally
driven public buying and selling.
TRADING STOCKS ARE CONTROLLED BY PROS:
TIGERSOFT LETS YOU JOIN THE FUN.
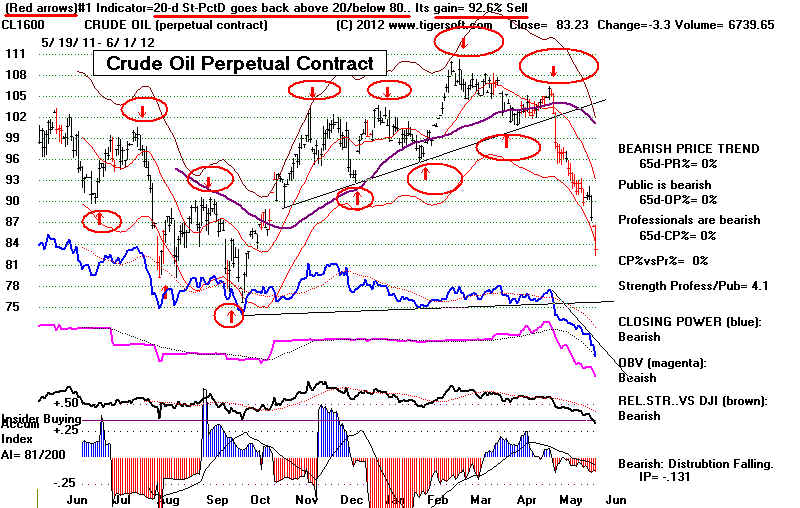
TigerSoft charts all start by showing you
the best simple trading system
for a
stock. The 20-day Stochastic was flawless in 2011-2012 for the
perpetual
contract of Crude Oil. This system's Buys and Sells are in red.
The trading
gain here is shown on the top line. It was 92.6%.
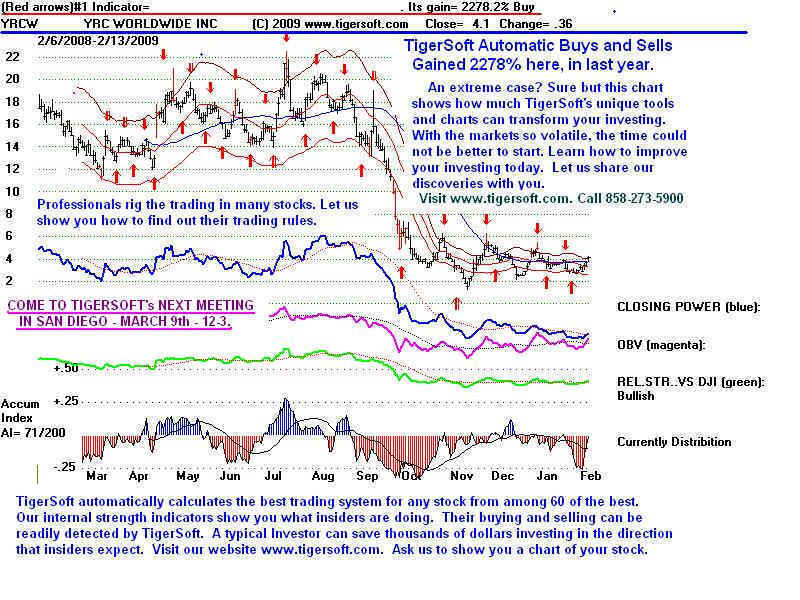
Example - YRCW - Trade short term automatic
TigerSoft Buys and Sells.
YRCW - TigerSoft Gain = +2278.2%
SHORT-TERM TRADING SIGNALS BASED ON
BEST STOCK'S CURRENT BEST TRADING SYSTEM
70% of the time the
market is going sidewise, not significantly up nor down.
Many Professional traders swing in
and out of stocks repeatedly.
For many, the direction of the
general market or a particular stock is not
clearly up or down. After a
big January - June advance, what do you do?
Some go away for long vacations.
But other Professionals switch to
trading and hedging. Summers
more than any other time of the year
are good for short-term trading.
This is an especially good time to use TigerSoft's
automatic Buys and Sells when the
software finds that the best trading system
is a 5-, 14- or 20-day Stochastic.
Of course, we also recommend Peerless
Stoch Market Timing and our Tiger
Internal Strength and Momentum Indicators,
as well.
A particularly effective trading system
can work for more than a year. It does
so because the most heavily capitalized
Professionals are making it work
and because it suits the psychology of
those currenly buying and selling it.
TigerSoft finds such systems as faster
than you can put a chart on your
computer screen. There is no need
for trial and error or optimizations,
slowly worked out, one trial after
another. Our Tiger Power Ranker gives
you a complete list of the most
profitably traded stocks, ETFs and commodities
and what trading system works best with
them.
The gains are often phenomenal.
Trade these stocks especially
using our trading rules, which emphasize:
1) Using stop losses for when a stock starts to change its
trading personality and a paper loss exceeds the earlier
biggest paper loss..
2) When in doubt, require a Closing Power trend-change to
confirm am automatic Buy or Sell.
3) Trade mostly with the prevailing price and CLosing Power
and with the trend as indicated by the current Peerless
signal.
Our
Trading manuals show you everything you need to know
about how to find and trade such stocks,
often better than even those
who own and run the compnay.
Certainly, much better than
even the smartest engineers and sales
people working for the
firm. Instead, your eyes will
be opened. You will see exactly
how market professionals are rigging and
trading these stocks.
The top row of every TigerSoft chart shows you the best system
to use and what its track record
has been for the last year.
Tiger's Power Ranker flags the new
red Buys and Sells. The
results assume $10,000 is invested
initially and all subsequent
red signals result in a Buy or a
Sall with commissions being
$20 pwe Buy or Sell. You can
also see what happens if the
trades are all taken a the next
day, as well as getting a list
of the trades and outcome plus
results showing the biggest
paper losses and the number of winning
and losing trades.
Stock 2009-2010
Long Short
Symbol Trading
Trading (Winning
Trades
Gain
Gain Losing Trades)
---------------------------------------------------------------------------------------------
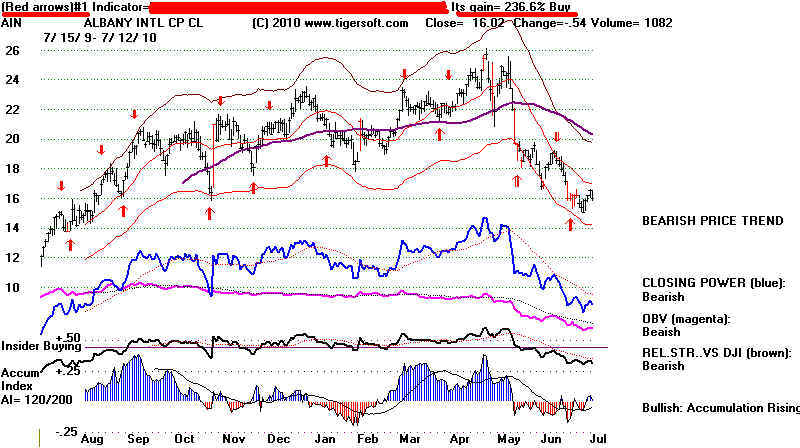
AIN
+236% +68%
(6 wins 1 loss)
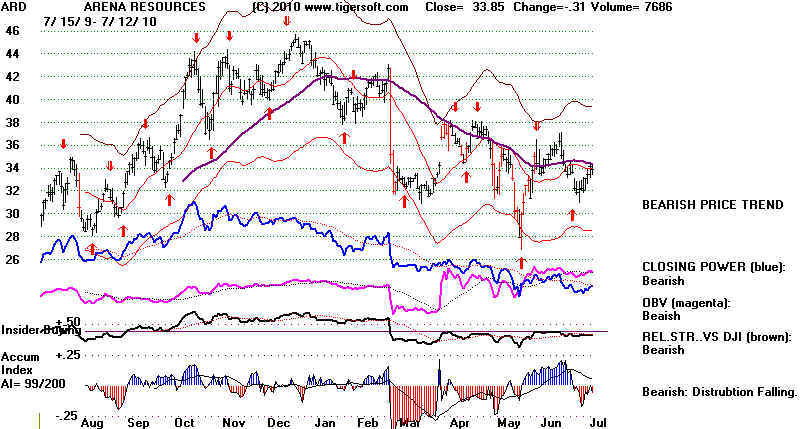
ARD
+335% +129% (10
wins 0 losses)
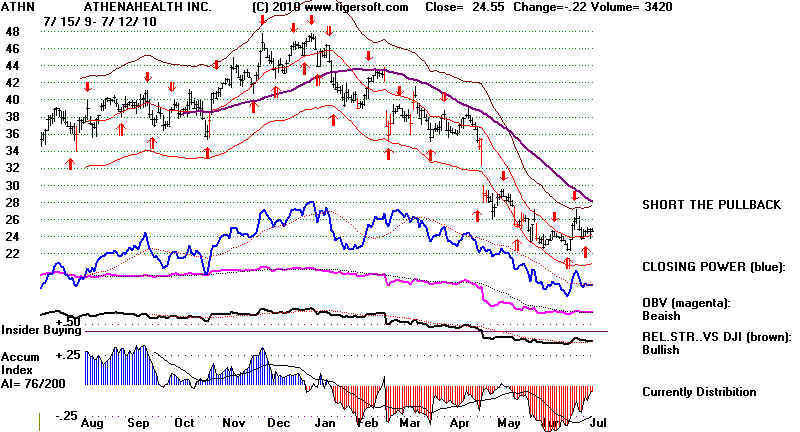
ATHN +253%
+51% (11
wins 3 losses)
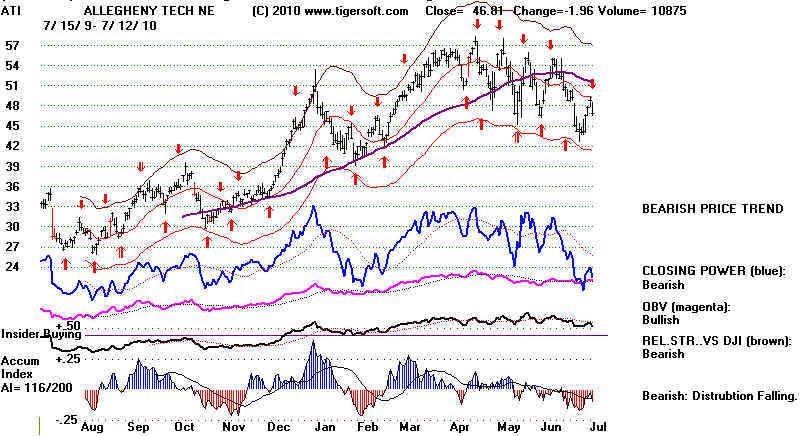
ATI
+275% +138% (11 wins 3
losses)
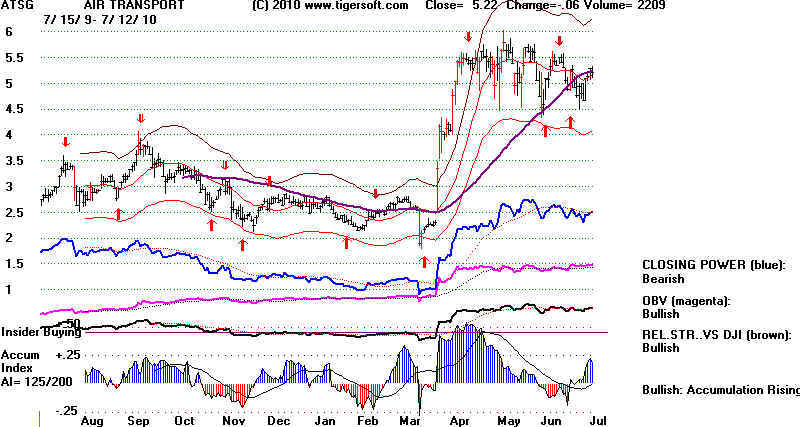
ATSG +995%
+347% (6 wins 1 loss)
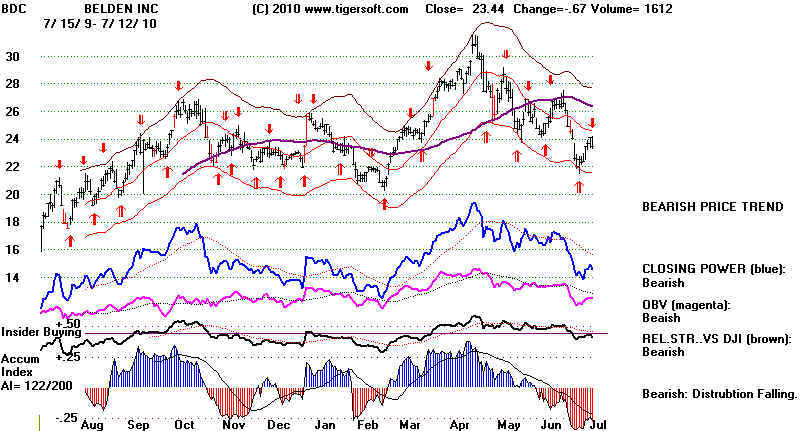
BDC
+215% +78% (13
wins 2 losses)
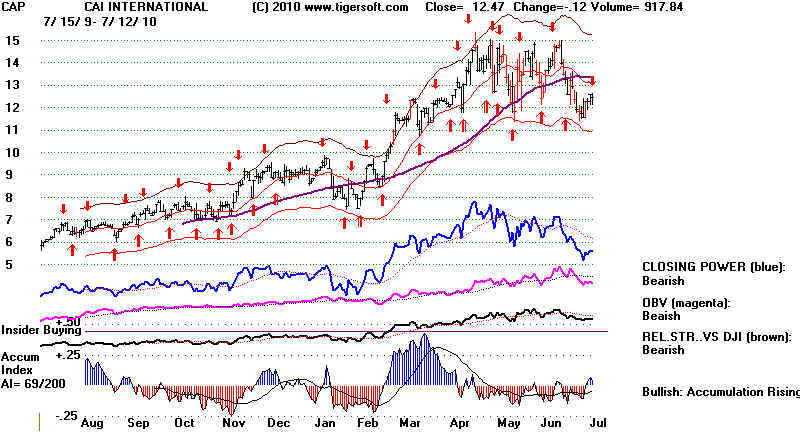
CAP
+257% +130% (15 wins 4
losses)
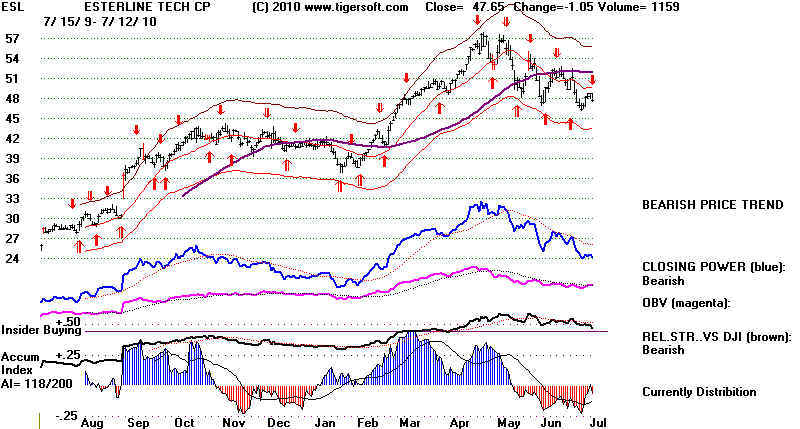
ESL
+201% +119% (13 wins 2
losses)
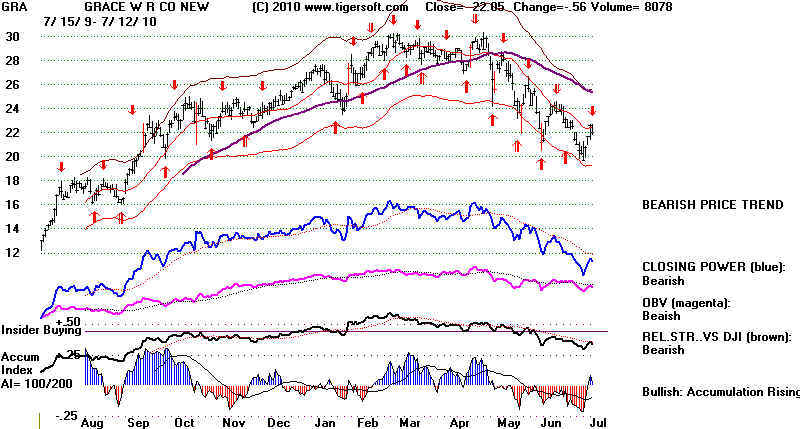
GRA
+206% +107% (12 wins 3
losses)
HMIN +226%
+97%
(10 wins 4 losses)
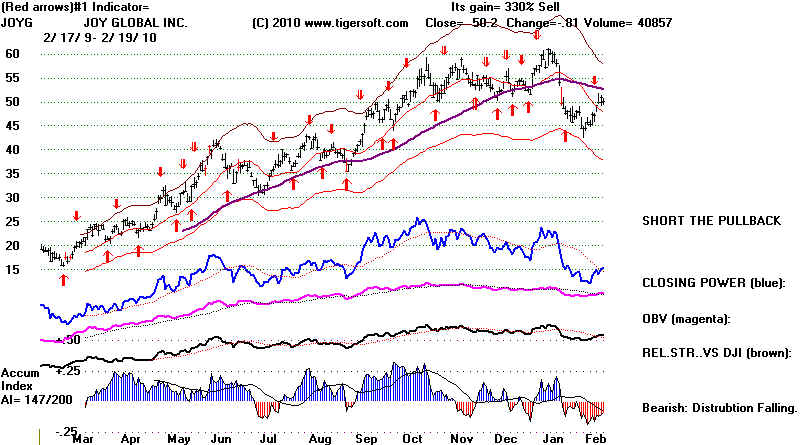
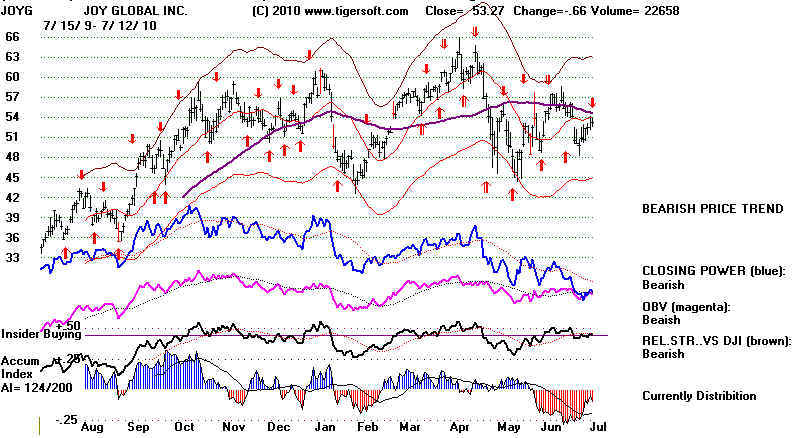
JOYG
+204%
+94%
(13 wins 4 losses).
 |
 |
 |
 |
 |
 |
 |
 |
 |
 |
 |
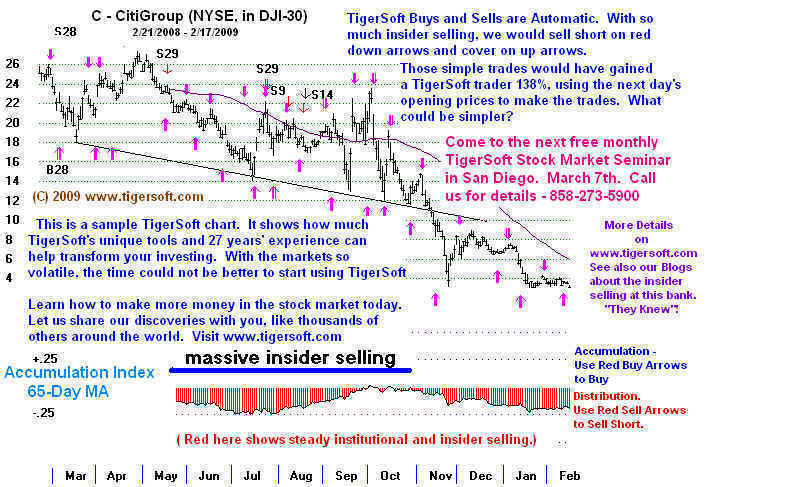
CitiGroup - 54 to 1 in two years.
Short such heavy distribution (Insider Selling) stocks on all New Red Sells
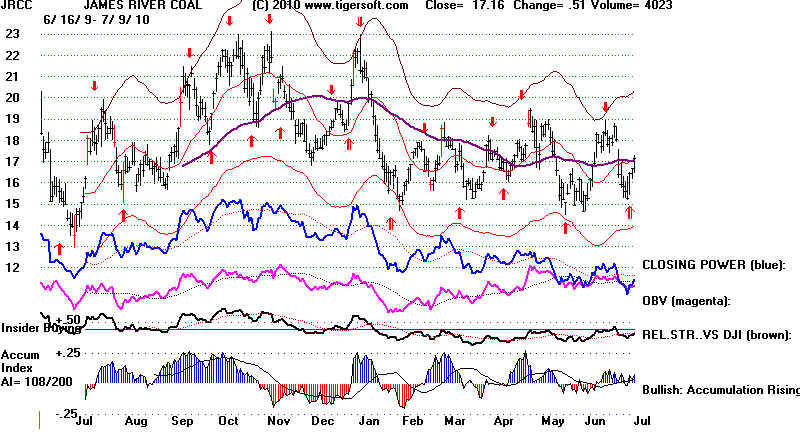
JRCC - another example
Look at how well these automatic Red Signals work with JRCC
Update 2/20/2010 (C) 2010 www.tigersoft.com
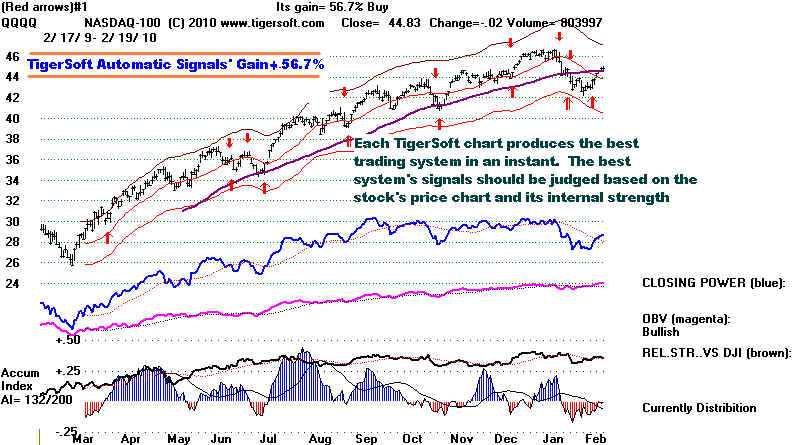
Below are
some recent NASDAQ-100 TIgerSoft charts. They
show the initial screen display for a TigerSOft
chart. The
top line shows the basis for the TigerSoft
automatic Buys and Sells
and the percent gain for the last 11 months
trading these
red Buys and Sells. The basis of the
signal has been whited
out here to protect value of our research.
The
TigerSoft chart shows you in an instant what hours of
trial and error would show about what indicator
works best
with a given stock, at any point in time, based
on the
last year's data. Stocks tend to
have personalities and
attract certain types of traders. These
optimized Buys and
Sells tend to continue to be successful.
And when the stock's
behavior does change, so does the basis for the
red Buys and
Sells. Not shown here, TigerSoft charts
also automatically
show the second, third and fourth best systems,
too.
These
charts show four internal strength indicators
beneath the price chart. A bullish chart
will show rising
indicators and a positive Tiger Accumulation
Index at the
bottom. Automatic readings for each
indicator will say
"bullish." Downtrending
internal strength readings will
give a "bearish" automatic note
beneath the indicator.
We want to confirm a Buy signal with good
internal strength
indicators.
TigerSoft Chart of SPY with Automatic Buys and Sells
Trade Mostly in the Direction of Its Closing Power.
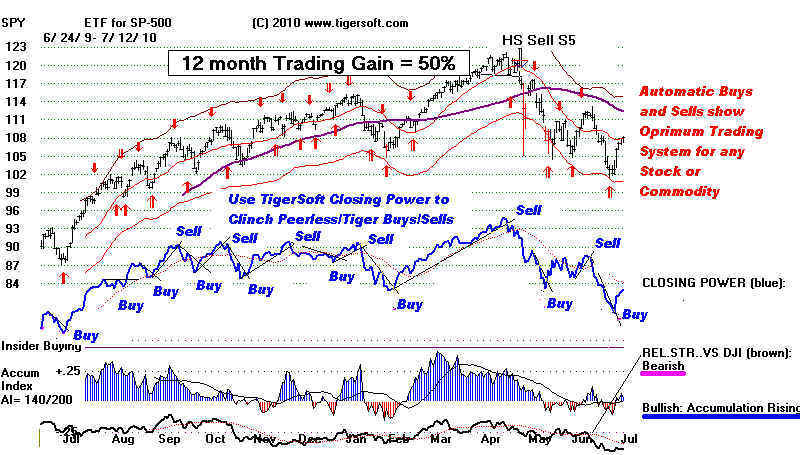
More examples below:
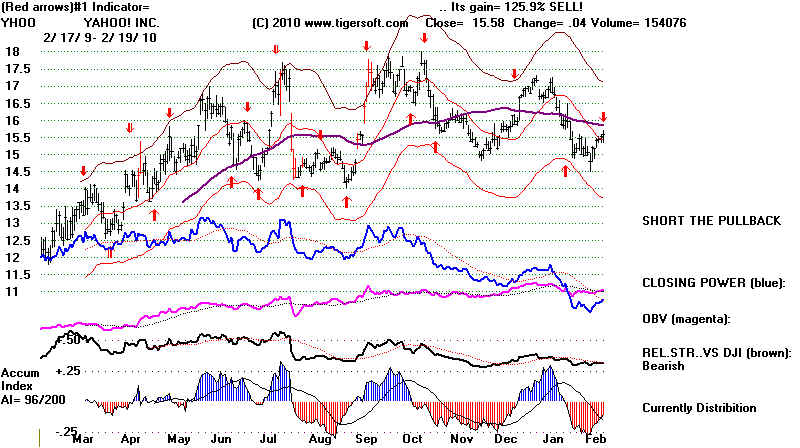
Yahoo - TigerSoft's Automatic Buys and Sells' Gain here = +125.9%
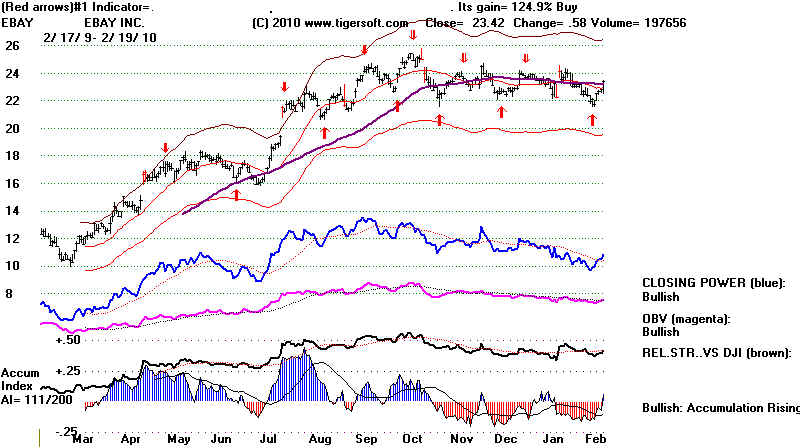
EBAY - TigerSoft's Automatic Buys
and Sells' Gain here = +124.9%
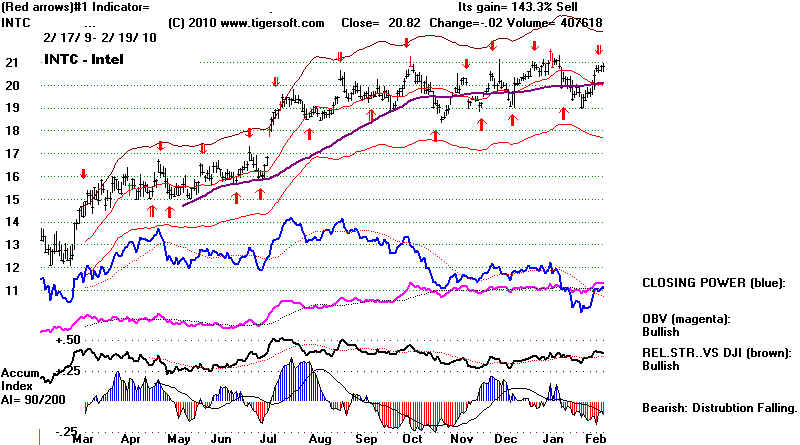
INTC - TigerSoft's Automatic Buys
and Sells' Gain here = +143.3%
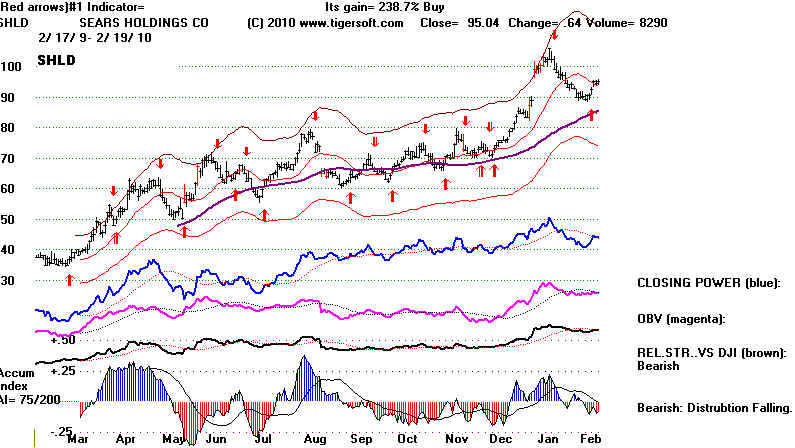
SHLD - TigerSoft's Automatic Buys
and Sells' Gain here = +238.7%
JOYG - TigerSoft's Automatic Buys
and Sells' Gain here = +330.7%
Yahoo - TigerSoft's Automatic Buys and Sells' Gain here = 125.9%
EBAY - TigerSoft's Automatic Buys and Sells' Gain here = +124.9%
INTC - TigerSoft's Automatic Buys and Sells' Gain here = +143.3%