Use Tiger's Automatic Buy/Sell Signals
with The Highest Accumulation Stocks
Tiger Software readily shows you those stocks highest ranked for big-money-
Accumulation. What you saw in Tiger Path#1, should give you confidence that
a stock ranked number #1 for Accumulation has a price trend which is usually UP!
On a Tiger chart you see a number labeled "AI/200". That is the number we
use to measure accumulation. It ranges from 0 to 200. Anytime a stock reaches
192, it is very bullish.. These stocks in the original DJI-30 study gained an average of 37%
per year, rather than only 25% oer year..
Look at any Tiger stock chart. Immediately, you will see Red Automatic Buys and
Sell signals. These are the Buys and Sells based on the best trading system for the last
year from among more than 50 that the computer tests before displaying the chart. Buy
on a red Up-Arrow and Sell and take profits on a Red Down Arrow.
A few more things: there is another concept we have found immediately helpful. It is
safest to use a Buy when the stock is above its rising blue 50-day ma (moving average).
The top line of the chart shows the basis of the signals and what the top system would have
gained over the past year, assuming that one invested $10,000 into the first signal and traded
it for the rest of the year. It conservatively allows $20 per trade for slippage. (The results
shown assume that one also sold short on the Sells. This is not recommended for high accumulation
stocks in an uptrend. The software allows you see what would have happened trading only
on the "long" side, taking Buys only. It also lets you see the results, where it is assumed
that you take positions at the next day's opening.)
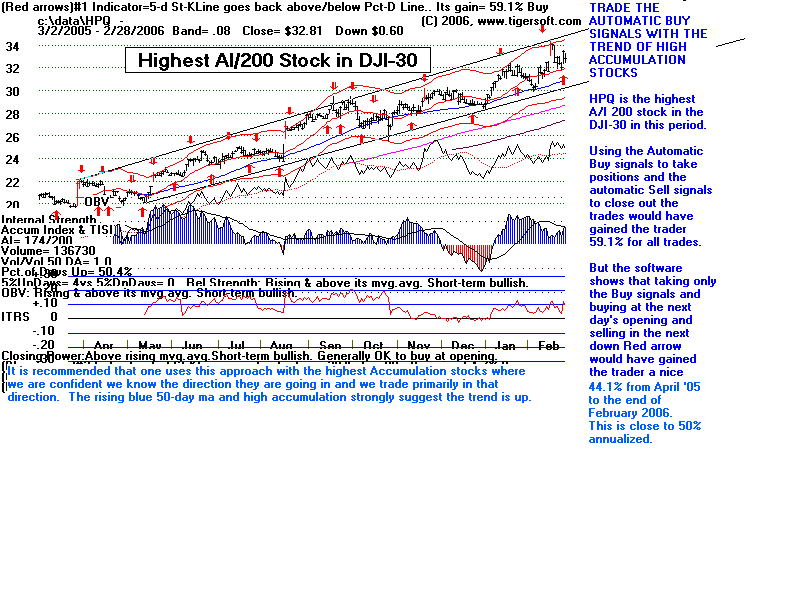
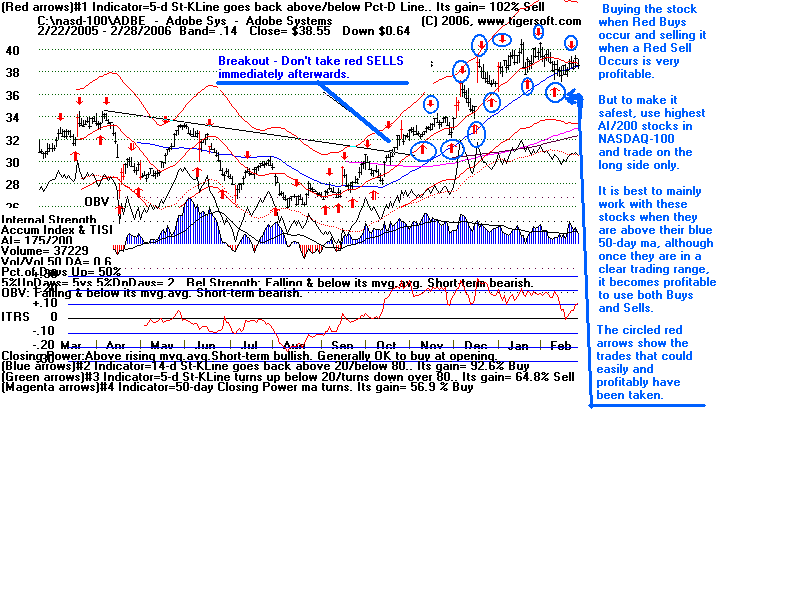
As you can see in the examples below. using this strategy would have gained one nearly
59% over the last year with HPQ (Hewlett Packard) and 102% with ADBE (Adobe) shown
below. ADBE was in the top 5 among the NASDAQ-100 stocks. Any of these could
have been traded quite profitably. There are many more charts like this to look at
link: http://www.tigersoft.com/--2--/index.html
When you get proficient at this, you will want to learn also to trade stocks in trading ranges
and downtrends.
Learn to spot the phase (Accumulation or Distribution) a stock is in Understand that
many smaller stocks move in grand cycles. Clearly is is best to buy stocks in an uptrending
phase, when Accumulation is high or consistently positive.
You can see how the levels of Accumulation keep you informed as to which phase the
stock is likely in. Keep in mind that Blue is Bullish and Red is Brearish in the Accumulation
Index beneath the price bar charts. TASR shows this.
Look at how TASR took off at 10 in April 2003, rising to 180.
Its prices in subsequent charts reflect 3:1 and 2:1 splits.
A year later the stock was showing heavy distribution after April 2004 and down it plunged.
The third chart shows the heavy insider selling continued as it fell and fell into mid 2005.
The last chart, ending 3/1/2006, shows TASR bottoming below 6. Traders using the last charts'
Buy and Sell signals would have made 114%.
The software to produce these Automatic Buy and Sell signals is $295. It includes a 3 months'
subscription to the Tiger data services, which will let you examine more than 1000 different stocks.
Ample instructions are offered on Line, in the software and at regular Tiger Software seminars
held in San Diego and Las Vegas. We recommend that you also get the Tiger-Power-Stock-
Ranker ($295) so that you can have your computer quickly screen up to 1000 stocks in a few minutes
and report to you all the new High Accumulation Buys and Sells. We also make the same report
each night for $575 for a year. You can get all the Tiger and Peerless software, all updates for a year,
all our books and a year's subscription to the Hotline Services for $995.

