-
8/31/2011
DJI = 11614 +54 la/ma=
1.031 21-dmaROC= -.267 P =
+134 (+126 ) IP21= .078 V= - 49 OP= +.292
BREADTH STATISTICS:
123 (-26) MAXCP
stocks Bullish New Highs and MAXCP Stocks
11 (+2) MINCP stocks
Bearish MINCP Stocks
MAXCP stocks
are those showing Tiger Closing Power making new highs.
This suggests heavy Professional Buying. Applying the Tiger Power Ranker's
"bullish" to the MAXCP stocks find those with heavy insider buying and
institutional accumulation. Bearish MINCP stocks show the opposite.
Also use the BOTHUPs condition with MAXCPs and BOTHDOWNS MINCPS.
Sell S7s occur when Professionals are much more bearish than the Public is.
8 new highs on NASDAQ. 5 new lows on NASDAQ
20
new
highs NYSE
1 new lows on NYSE
8/31/2011
===> See Key
Peerless TigerSoft Index Charts: Industry Groups and ETFs
DIA
SPY QQQ
DJIA-Peerless TigerDJI TigerSPY
TigerQQQ GLD
SLV Crude
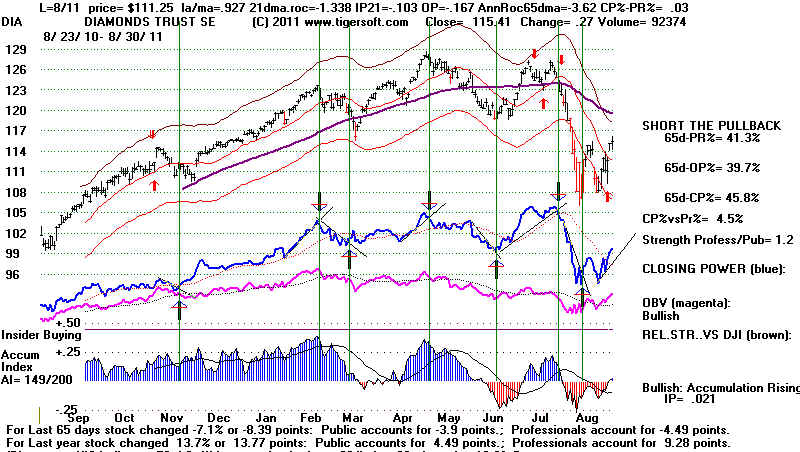
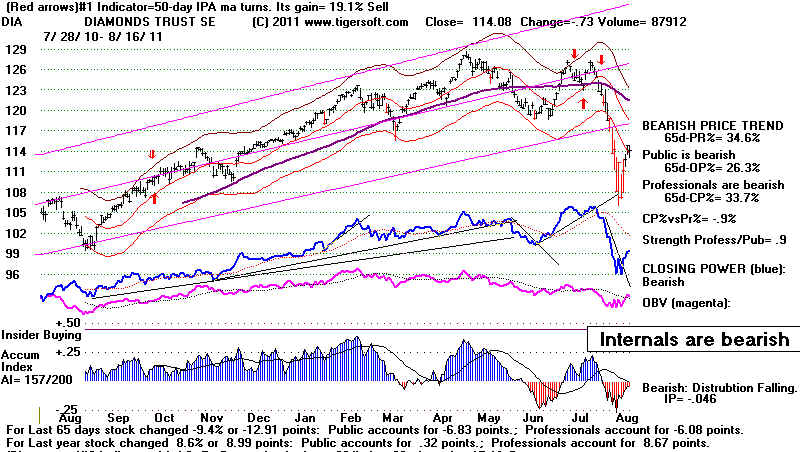
8/31/2011 Peerless remains on Buys. The Closing Powers
are still rising.
Defensive Stocks Have Led The Recovery.
This is not good.
See the Key Peerless TigerSoft Index Charts
I have decided to take profits in many of the
stocks bought for this rally on our
Tiger Stocks' Hotline, but will wait for the
Closing Power uptrend to be broken to sell DIA.
Volume remains so low, I would think that
another day up ot two is about all we
can expect of the advance without some very
good news to send it higher. 118-119 will be
very tough resistance for the DIA on this
advance. It closed at 115.95. I would just hold
DIA and the other long positions, except where
the stock has fallen more than 15% and
has got back up to its old highs or stall out
at the falling 65-dma. There I would take profits.
See Bullish New Highs and MAXCP Stocks
Short sales do not seem a good idea yet.
The number of MINCP stocks, is very low.
DJIA
 |
DIA - Daily
 |
DIA - Exploded Chart
 |
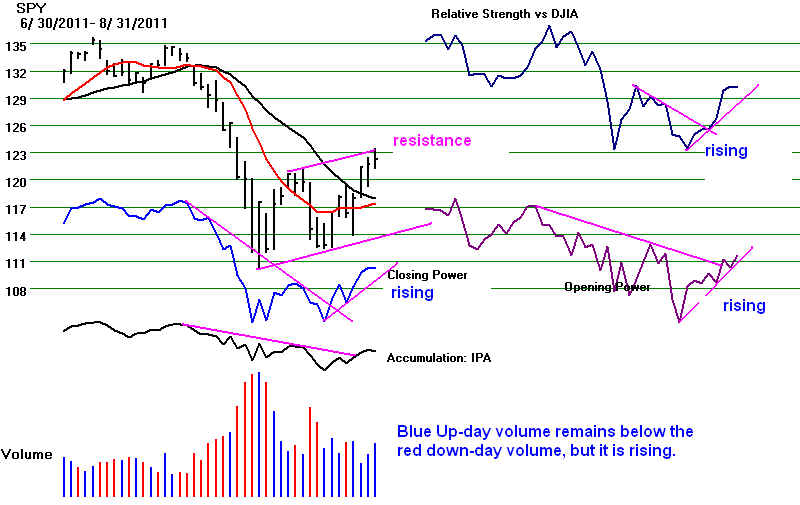
SPY
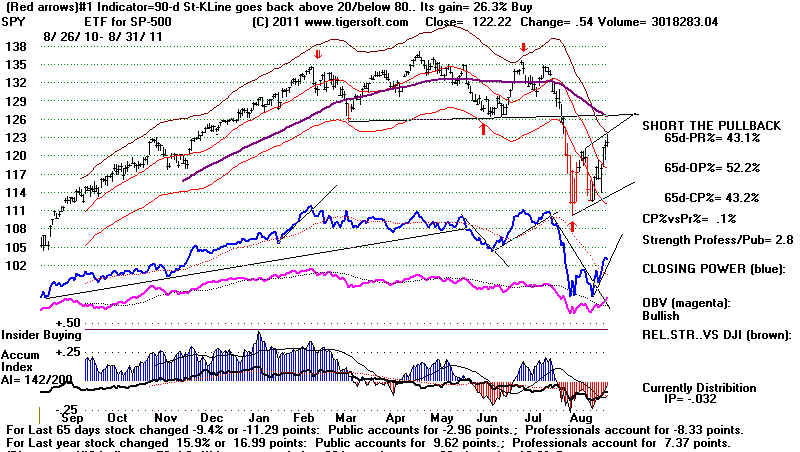
SPY - Exploded Chart
 |
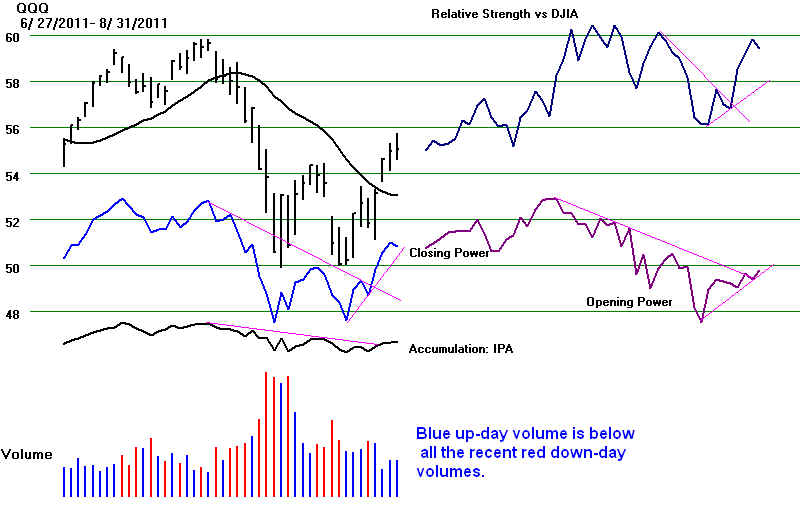
QQQ
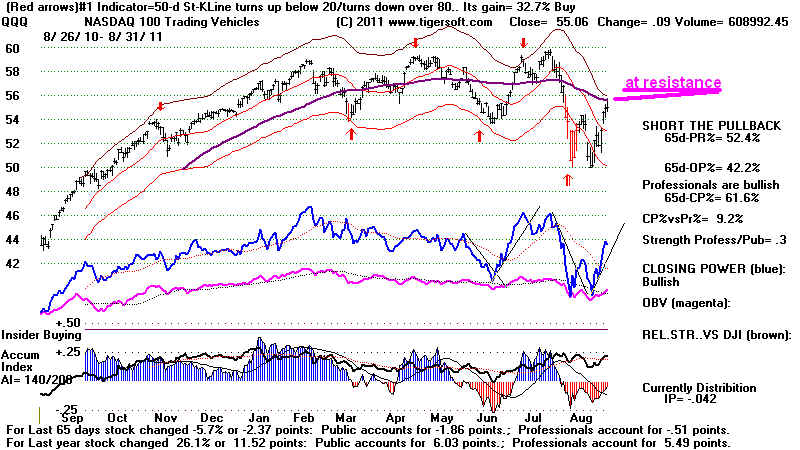
QQQ - Exploded Chart
 |
===================================================================================
OLDER HOTLINES
===================================================================================
8/30/2011
DJI = 11560 +21 la/ma=
1.025 21-dmaROC= -.603 P =
+7 (+29 ) IP21= .047 V= - 122 OP= +.217
BREADTH STATISTICS:
149 (+20) MAXCP stocks Bullish MAXCP
Stocks
9 (+3) MINCP stocks Bearish MINCP
Stocks
MAXCP stocks
are those showing Tiger Closing Power making new highs.
This suggests heavy Professional Buying. Applying the Tiger Power Ranker's
"bullish" to the MAXCP stocks find those with heavy insider buying and
institutional accumulation. Bearish MINCP stocks show the opposite.
Also use the BOTHUPs condition with MAXCPs and BOTHDOWNS MINCPS.
Sell S7s occur when Professionals are much more bearish than the Public is.
17 new
highs on NASDAQ. 12
new lows on NASDAQ
21
new
highs NYSE
0 new lows on NYSE
8/30/2011
===> See Key
Peerless TigerSoft Index Charts: Industry Groups and ETFs
DIA
SPY QQQ
DJIA-Peerless TigerDJI TigerSPY
TigerQQQ GLD
SLV Crude
8/30/2011 Peerless remains on Buys. The Closing Powers
are rising.
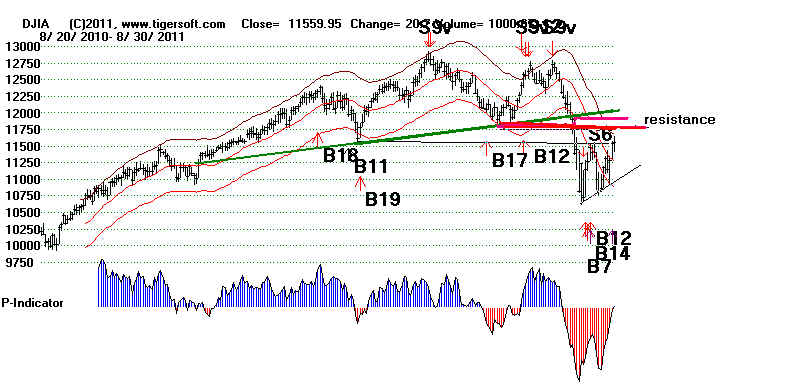
Though the DJI rose from early weakness, at
the close it backed off the
overhead resistance at 11600.
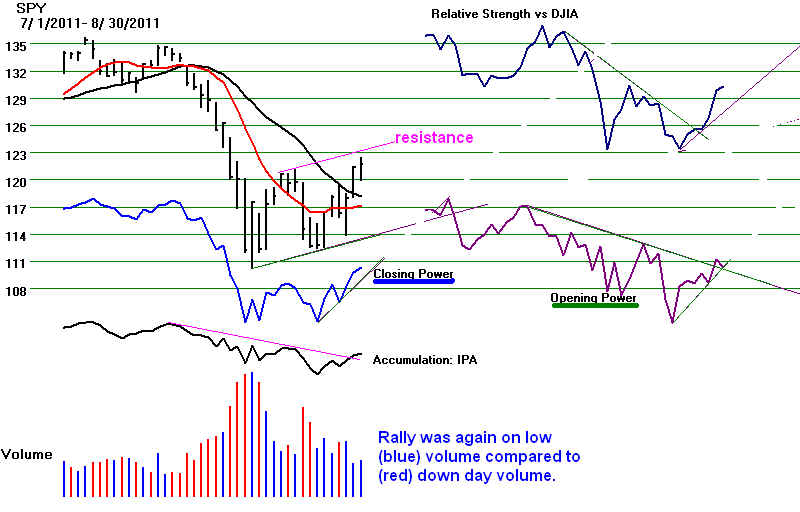
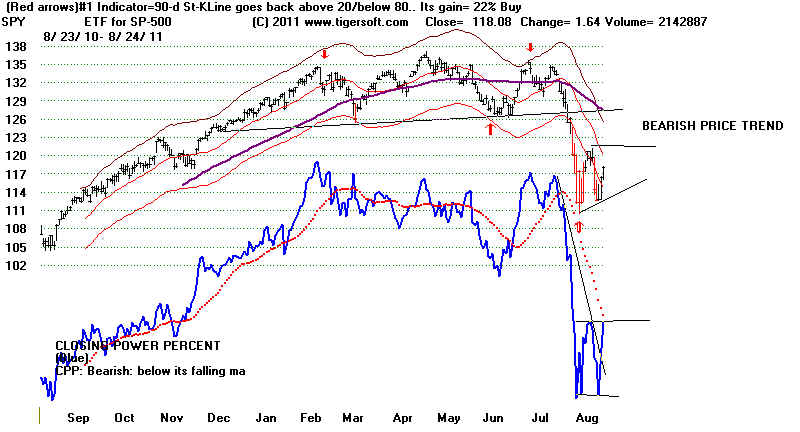
Volume remains low on the rally. (See the short-term
SPY just below.) As a result,
it is not clear that there will be sufficient buying to eat
up the overhead supply of stock. Still
this is a short-term bullish period and Professionals
are not bearish yet, as there are only 9 stocks
making CP new lows, but 149 making CP
new highs.
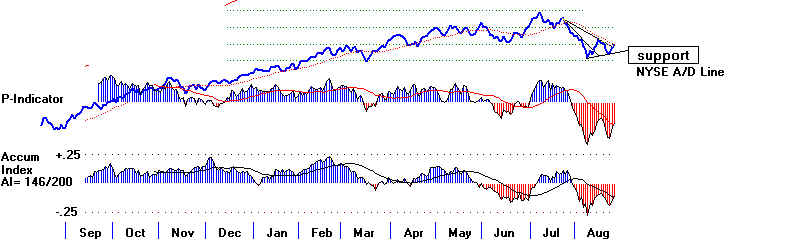
In the DJI chart below, the P-Indicator and
IP21 are only slightly positive. Peerless could
easily produce a Sell S9 or Sell S12 on a close
nearer 11600 if these indicators turn
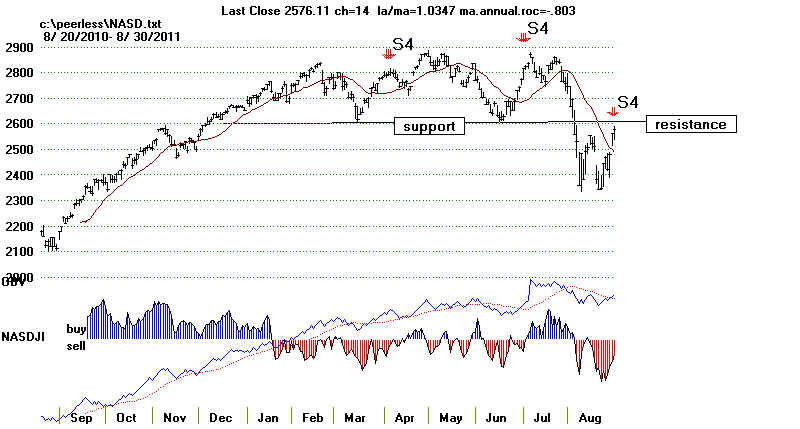
negative. The NASDAQ chart (below) does
show a Sell S4 based on negative Accumulation
and Relative Strength Tiger "NASD"
readings.
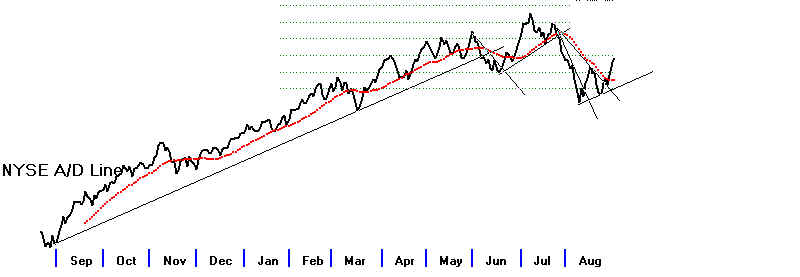
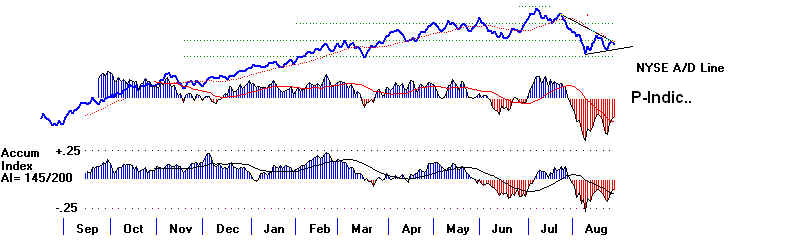
The uptrends of the Closing Power and the A/D
Line are still rising and Peerless is
still on a buy. I think we should hold
our long positions.
===================================================================================
OLDER HOTLINES
===================================================================================
8/29/2011
DJI = 11539 -171 la/ma= 1.021 21-dmaROC= -.635 P = -23 (+170 ) IP21= .035 V= - 143 OP= -.154
BREADTH STATISTICS:
129 (+73)
MAXCP stocks Bullish MAXCP
Stocks
6 (-28) MINCP stocks Bearish MINCP Stocks (Friday's)
(MAXCP stocks are those
showing Tiger Closing Power making new highs.
This suggests heavy Professional Buying. Applying the Tiger Power Ranker's
"bullish" to the MAXCP stocks find those with heavy insider buying and
institutional accumulation. Bearish MINCP stocks show the opposite.
At this point these are extended a long ways, so - use well-tested CP trendbreaks
to close out positions. Sell S7s occur when Professionals are much more bearish
than the Public is.
20 new
highs on NASDAQ. 7
new lows on NASDAQ
22
new
highs NYSE
4 new lows on NYSE
8/29/2011
===> See Key
Peerless TigerSoft Index Charts: Industry Groups and ETFs
DIA
SPY QQQ
DJIA-Peerless TigerDJI TigerSPY
TigerQQQ GLD
SLV Crude
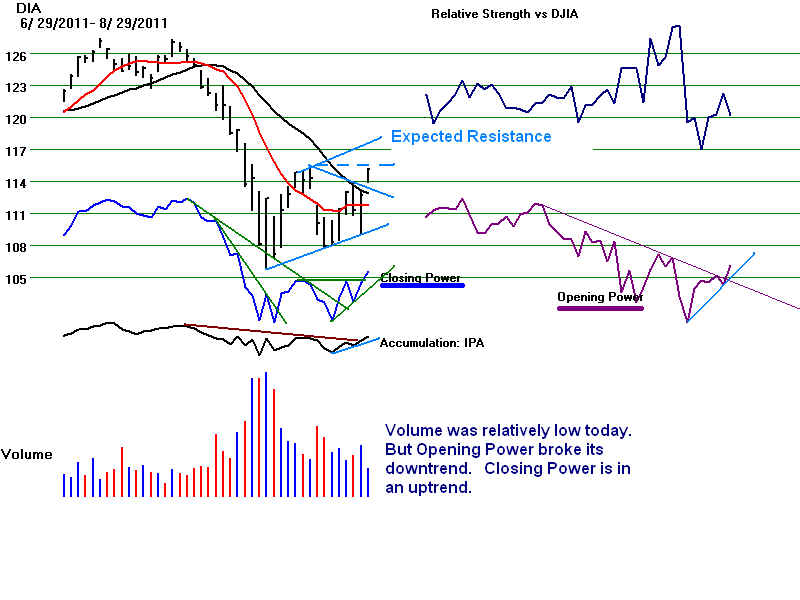
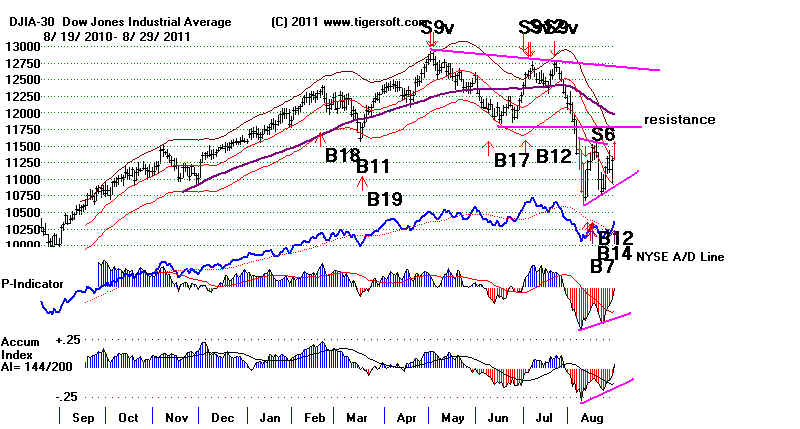
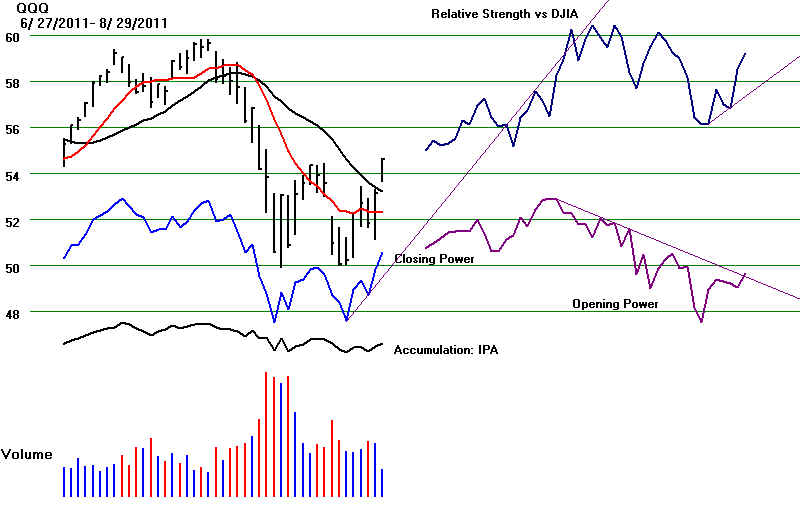
8/29/2011 A Low Volume Rally to early August's
Resistance. But Hold...
Only a shallow pullback is expected, as long as
uptrend of Closing Powers
have not been violated. The DJI closed
2.1`% over the 21-day ma. Look for a
rally and a close to 3.0% (la/ma = 1.03 in key
daily Peerless statistics above).
We should also get a Sell signal if the
P-Indicator is near or below 0 or if the
IP21 is below 0.
Peerless gave a reinforcing Buy
B14 today because the ratio of NYSE up volume
was so high to NYSE down volume.
The ETFs Closing Powers are rising and the Opening
Powers broke their downtrends.
The DJI's resistance at 11500 from the early August peak
is probably not as important as the
broken support at 11700. I would hold the longs
a while more. A rally through
through Thursday's close is most common before Labor Day
weekend. We are not short anything.
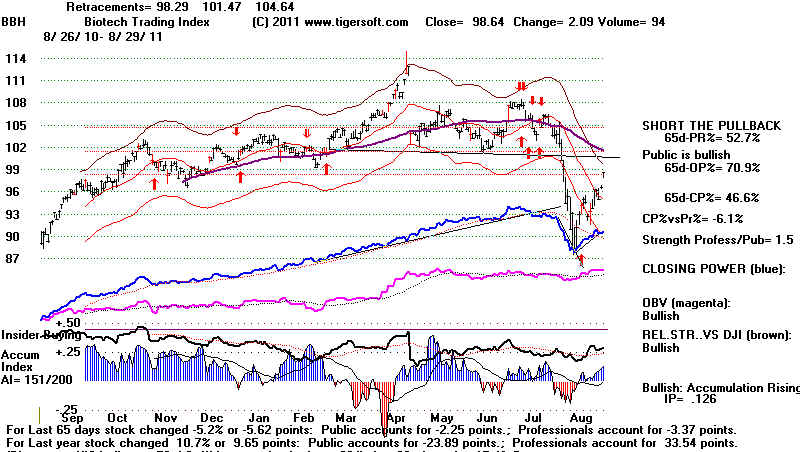
A number of biotechs did well today as did the
best of the REITs. I would
limit purchases to the very best of the REITs. And note how
well the 5-day Stochastic does with the
index of BESTREIT which I will start re-posting
on our Key ETFs and SECTOR Charts.
It would helpful and bullish here if there were stocks, other than defensive ones,
leading the rebound. That is not
the case so far. Last night's Hotline painted
a picture of America in stagnation with
no ready way out, given Obama's orthodox
economic thinking and the anger of the
tea-party Government-is-bad Congress.
The 1930s' history shows that the forces
of economic nationalism will get much stronger
if there is no improvement and no
re-industrialization. Economic nationalism
clashes sharply with the
internationalism of Wall Street, Obama and much of the
Democratic Party.
Right now, Obama and the Fed will
do everything they can to paper over the cracks
until after the next election.
They may not be able to do that. Sooner, rather than later,
these antagonisms and
contradictions will probably drop the DJI sharply. I think that
Obama is quite vulnerable to a
populist Democratic challenge. Wall Street would
not like that. Right now, no
one is even in the wings. But that could change, especially
if Obama's Labor Day speech on Jobs
offers nothing more than some subsidies for
companies who do more hiring in the
US.
This is what I argue in the latest
Tiger Blog
8/27/2011 CAN THE US ESCAPE
ECONOMIC STAGNATION?
Deepening
Contradictions between Main Street and Wall Street:
The Lessons of the
1930s Bode Poorly for Wall Street.
Watch for next the 5-day Stochastic Red Sell on BESTREIT.
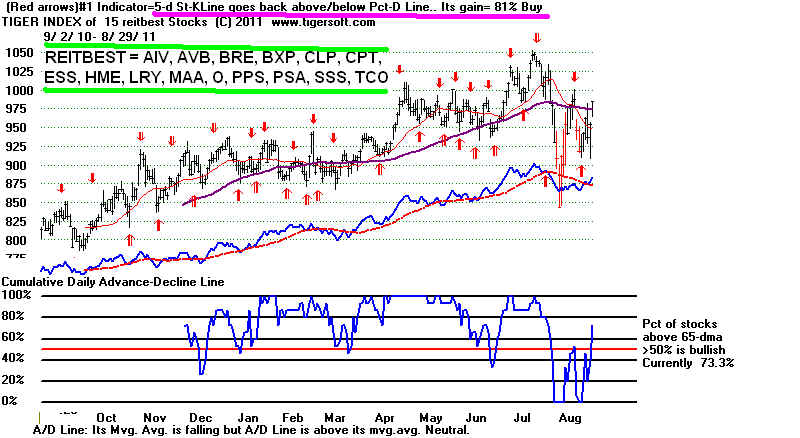
Biotechs and REITs are usually strong
until the end of a bull market, but it would be
unusual for them not to back off when
they hit the resistance of their falling 65-dma.
Watch their rising Closing Power uptrends
for a break, too.
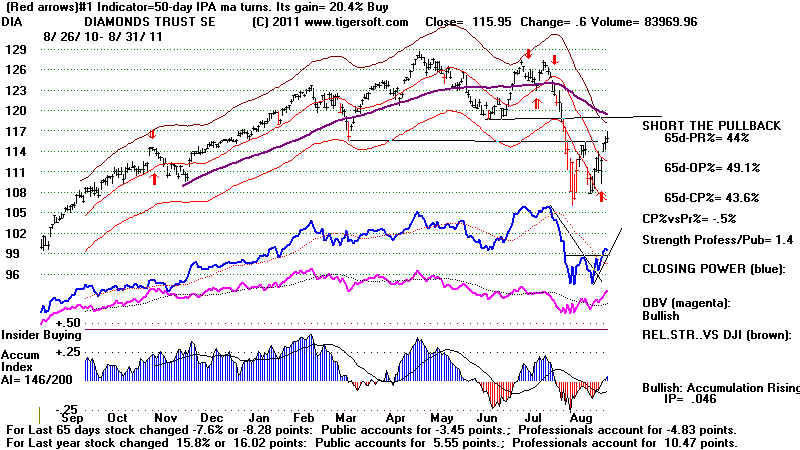
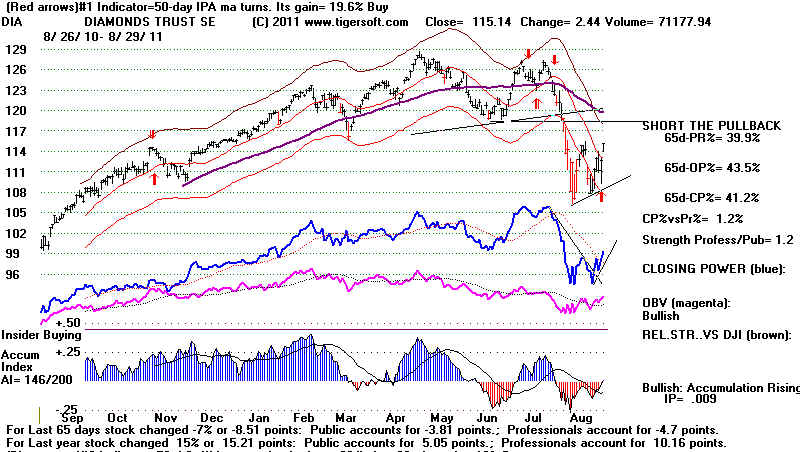
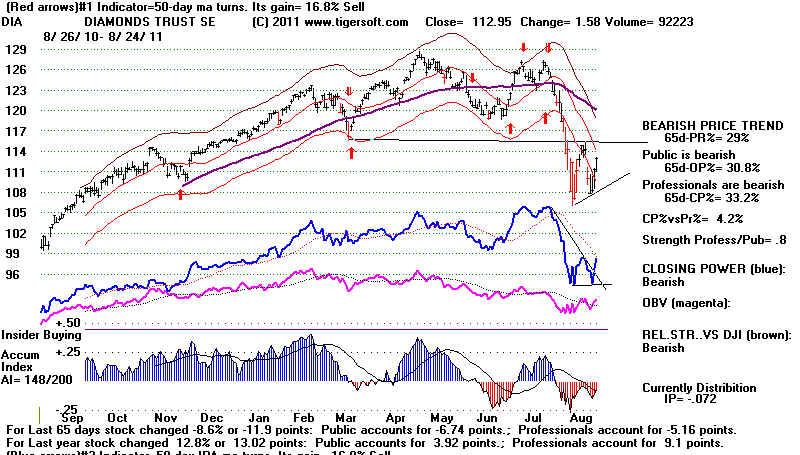
DIA' s
Exploded Chart shows rising CLosing Power trend, but volume was quite
low on the rally.
DJI and Peerless Signals
 |
DIA - full chart
 |
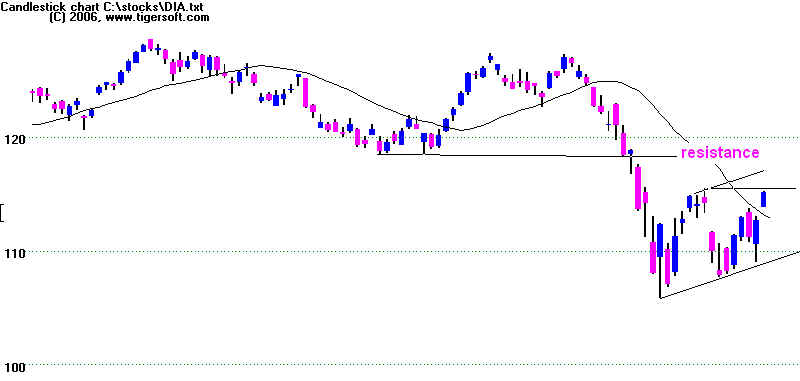
DIA - CandleStick
 |
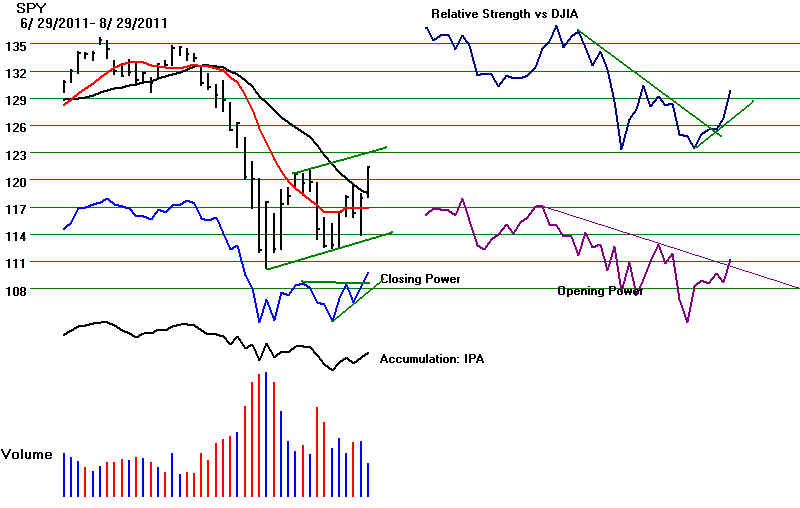
SPY enlarged chart
 |
QQQ Enlarged Chart.
 |
====================================================================================
OLDER HOTLINES
====================================================================================
8/26/2011
DJI = 11150 -171 la/ma= .98 21-dmaROC= -1.201 P = -325 (+44 ) IP21= -.086 V= - 386 OP= -..035
BREADTH STATISTICS:
47 (+19) MAXCP stocks Bullish MAXCP Stocks
34 (-78) MINCP stocks Bearish MINCP Stocks
(MAXCP stocks are those showing Tiger Closing Power
making new highs.
This suggests heavy Professional Buying. Applying the Tiger Power Ranker's
"bullish" to the MAXCP stocks find those with heavy insider buying and
institutional accumulation. Bearish MINCP stocks show the opposite.
At this point these are extended a long ways, so - use well-tested CP trendbreaks
to close out positions. Sell S7s occur when Professionals are much more bearish
than the Public is.
4 new
highs on NASDAQ. 30 new lows on NASDAQ
9
new
highs NYSE
7 new lows on NYSE
8/26/2011
===> See Key
Peerless TigerSoft Index Charts: Industry Groups and ETFs
DIA
SPY QQQ
DJIA-Peerless TigerDJI TigerSPY
TigerQQQ GLD
SLV Crude
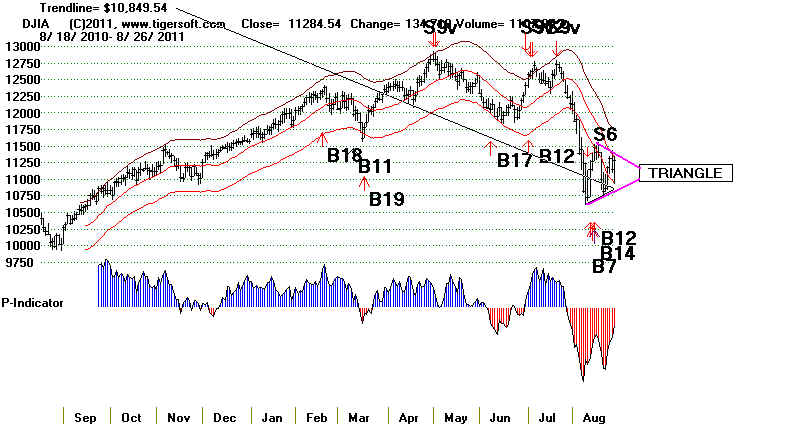
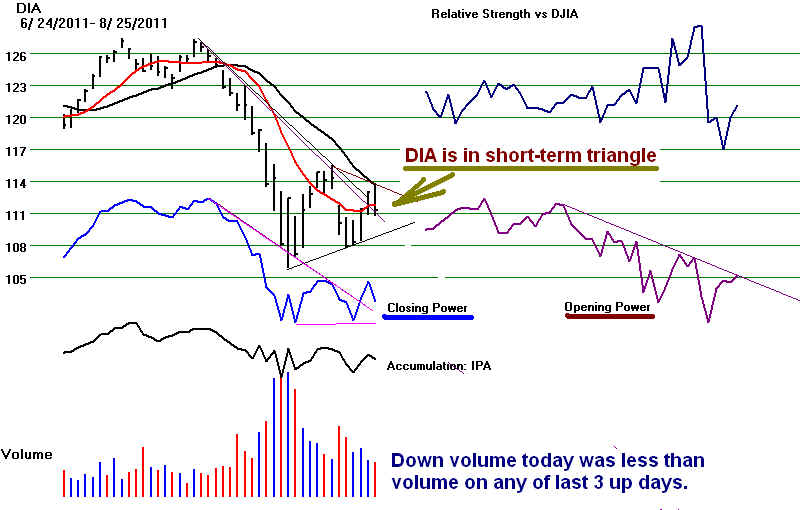
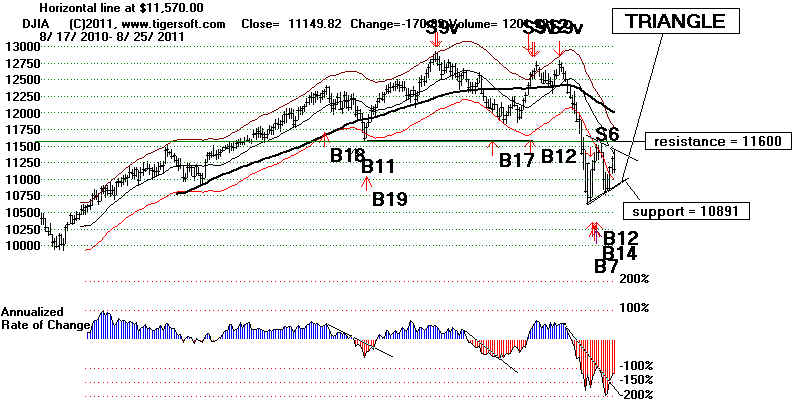
8/26/2011 The
DJI and key ETFs are locked in triangle patterns. The Peerless
Buys and the DJI's rising support line have made us bet on an upside
breakout.
The Closing Powers are in short-term uptrends. A breakout in the
DIA's CP above
its recent flat resistance would be bullish, as would a breaking in its
Opening Power's
downtrend. A very strong Opening which is added onto by an even
more powerful
Close would break these downtrends. Wall Street dodged a
hurricaine. Maybe, it's
luck is improving.
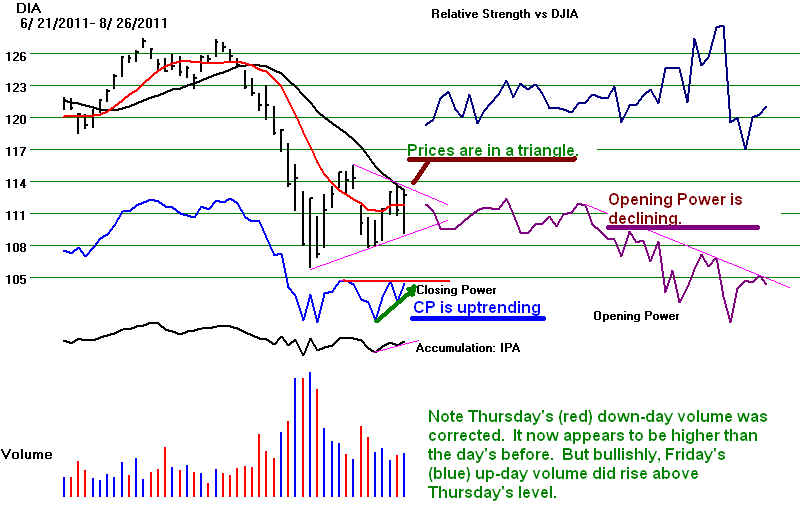
Volume did not rise much on Friday. Investors are scared.
Rising prices will
give traders more confidence. The rising uptrendline-support in the DJI is about 10900.
A close below this would probably mean the DJI is breaking down again.
If that is broken, the next support level is expected to be 9800.
A few more trading days'
hesitation is predicted by the history of the DJI since 1965. But
a week from now the DJI
should be higher, based on the fact that since 1965, the DJI has risen
64.4% of the time
in the five trading days after August 28th. The margin of
MAXCP stocks over MINCP
stocks is only 47 to 34, a hardly convincing number. Biotechs
often offer good long trades
late in a bull market cycle. As long as the ones, picked in the Bullish MAXCP Stocks' list show
rising Closing Powers, they are appealing. The bearish MINCP
stocks have already fallen
a very long way. My guess is that shorts will be happy to take
profits in most of them if
the market moves higher as we go into the 3-day Labor Day weekend.
Can Pumped Up Stocks Escape Trouble?
The world economy still has huge problems. Will stocks be able to
stay up? The Fed has
done a marvelous job in keeping the stock market rally alive for 27
months by generously
loaning vast sums to all the biggest banks at very little cost,
by printing new money to buy
bonds and by keeping interest rates low, despite quickly rising
gold and commodity prices.
Bernanke is fighting the forces of economic stagnation and high
unemployment
with only monetary policies. They are not enough, he is the
first to say. More stagnation,
higher unemployment and the loss of more manufacturing to Asia
and Europe are in
the cards. A longer economic stagnation and higher
unemployment will cause, I expect,
a re-thinking of economic orthodoxies, especially free trade and
balanced budgets.
Globalism Will Likely Break Down
The 1930s caused many countries and economists to rethink
orthodox economics.
I think the same will happen again. Now Budget Balancing is
all the rage in Washington,
London, Berlin, Paris and now Spain. Its dire effects in
Europe and the US in the 1930s
seem unknown or forgotten. But if history repeats, when
these countries' economies
worsen and unemployment jumps to unacceptable levels, as happened
in 1931 and
1932, there will be more and more cries for Deficit Spending,
Protectionism, Public works,
Curbs on Exports of Capital, Wage and Price controls and even the
Confiscation of Gold.
Germany's leading banker of the 1920s, Hjalmar
Schact, a free trader and budget balancer,
read Keynes and dramatically reversed himself completely in 1929.
Keynes himself switched
to protectionism in 1933, as did Neville Chamberlain, the
Chancellor of the Exchequer.
Imagine in our time, if someone like Bernanke or Buffett suddenly
switched to strongly
favoring Public Works, Tariffs, Autarchy (national economic
self-sufficiency) and even the
Repudiation of International Debts, as Schact did. Wall
Street would take a very big hit!
Yet these were many of the policies adopted in the aftermath of
the world wide economic
collapse of 1931 and 1932. Wall Street has bet big on
multinationals. The biggest "American"
stocks are all multinationals. I think wrenching challenges
lie ahead to stock prices,
especially if the current rally fails and Obama and the Tea Party
leaders offer no new ideas
in early September about how to create millions of jobs by
re-industrializing America.
Many economists think that the 1929 stock market collapse was partly a
response to the growing
realization then that the Smoot Hawley
legislation was going to pass, with its big jump in tariffs.
The dependence on international trade is much greater now. Wall
Street and the major
corporations would never allow such an increase in tariffs. Yet,
without some restrictions
on imports or subsidized industrial production here, a massive pubic
works program, like TVA,
the Hoover, Grand Coulee Dam or Civilian Conservation Corp., would be
much less effective
as an economic stimulus. Consider high speed trains as a US
public works program to modernize
the infrastructure. Presently, much of the steel would have
to be imported. And the newly
hired workers would probably buy lots of Chinese imports from Wal-Mart.
Keynes'
"multiplier effect" with public works projects in the US is
much lower now than it was in 1933.
   
Tennessee
Valley Authority Grand Coulee Dam
Hoover Dam
CCC
The easiest path politically now in the US is still relying
on Bernanke to boost Wall Street
and hope that there with be some trickle-down to American
workers, even though the export
of jobs goes on unabated.
Tariffs do have their downside. Which industries
should be protected? Across-the-board?
The links below argue that the Obama Adminstration has not
bargained any more aggressively
with US trading partners, particularly China, than he
did with the tea party Republicans. Should
goods produced unsafely by underpaid serfs be allowed into
the US? When it comes to
campaign contributions, the importers generally speak
louder than the unemployed workers
that have been displaced. Whereas once up a time, the
corporations that made steel or
sneakers or autos might have complained bitterly, now they
own many of the factories
abroad that are sending goods here.
References to Obama's failure to fight against unfair foreign trade practices
that hurt American manufacturing:
http://www.examiner.com/political-buzz-in-lafayette-la/obama-s-trip-to-china-could-further-destroy-america-or-is-that-the-plan
http://www.highbeam.com/doc/1G1-233548728.html
http://americanmanufacturing.org/blog?p=12026
http://citizen.typepad.com/eyesontrade/2011/08/pelosi-pushes-back-against-obama-backed-unfair-trade-agreements.html
http://www.punxsypage.com/news/start/68431_Casey_to_Obama__Protect_dairy_farmers_from_unfair_trade_practices.htm
http://www.mittromney.com/blogs/mitts-view/2011/07/president-obamas-retreat-china-costing-america-jobs http://www.prnewswire.com/news-releases/dnc-chair-debbie-wasserman-schultz-mitt-romney-will-not-stand-up-for-american-workers-in-the-global-economy-126280603.html
Tariff legislation, though probably easily made
popular now, as a way to save jobs here,
would almost certainly mean antagonizing China, which has
built whole industries
around exports to the US. There would be retaliation
by all the trading partners in
the US. Foreign US Debt holders would likely sell.
That would mean the Fed would have to
print lots more Dollars or a very sharp rise in interest
rates.

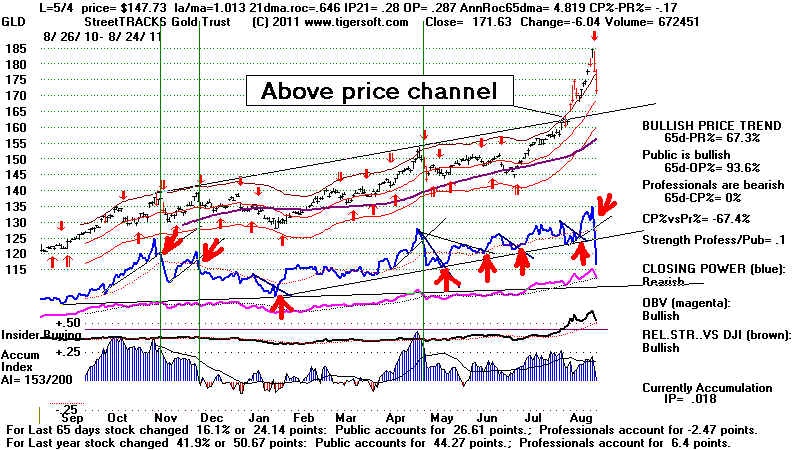
So, the future does not look good. The 1930s
should warn us about how quickly the world
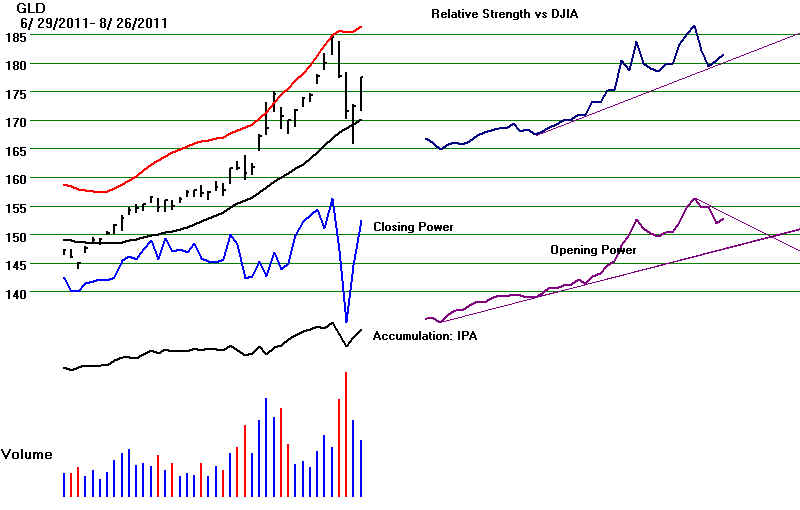
can deteriorate. Gold is a haven until there is
another violent Crash, as in October 2008.
That Gold turned up sharply the last two trading days this
week suggests a crash is not
imminent, but it probably is coming, tragically. I
suggested taking profits in Gold earlier
this week. Now it is roaring back. Look how the
Closing Power has reversed. Buy it back
if GLD' Closing Power makes a new high, my suggestion is
Buy GLD again. I would
also buy GLD on another retreat by the Closing Power back
to a point near its year-long rising
CP uptrend. See the expanded chart below and
the yearly chart among the key Industries'
and ETFs' charts. http://tigersoft.com/811hotline/Charts/index.html
GOLD's Hyperbolic Uptrend
===================================================================================
OLDER HOTLINES
===================================================================================
8/25/2011
DJI = 11150 -171 la/ma= .98 21-dmaROC= -1.201 P = -325 (+44 ) IP21= -.086 V= - 386 OP= -..035
BREADTH STATISTICS:
28 (-57)
MAXCP stocks Bullish MAXCP
Stocks
112 (+90) MINCP stocks Bearish MINCP Stocks
(MAXCP stocks are those showing Tiger Closing Power
making new highs.
This suggests heavy Professional Buying. Applying the Tiger Power Ranker's
"bullish" to the MAXCP stocks find those with heavy insider buying and
institutional accumulation. Bearish MINCP stocks show the opposite.
At this point these are extended a long ways, so - use well-tested CP trendbreaks
to close out positions. Sell S7s occur when Professionals are much more bearish
than the Public is.
2 new
highs on NASDAQ. 42 new lows on NASDAQ
2
new
highs NYSE
30 new lows on NYSE
8/25/2011
===> See Key
Peerless TigerSoft Index Charts: Industry Groups and ETFs
DIA
SPY QQQ
DJIA-Peerless TigerDJI TigerSPY
TigerQQQ GLD
SLV Crude
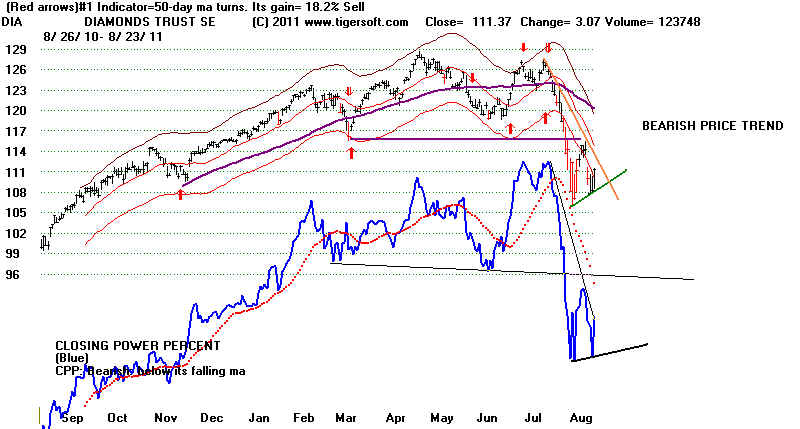
8/25/2011
DIA and DJI turned back down from falling 21-day ma.
The rising support in the DJI at about 10891 is now the level to watch.
A close below this would probably mean the DJI is breaking down again.
The next support level is expected to be 9800.
The ETF's Closing Powers backed off from the resistance of their
falling 21-day ma.,
but the CP downtrend has been broken. Volume did not pick
up on the decline.
Though the number of MINCP stocks picked up a lot today, our
Stocks' Hotline
closed out most of our short sales and went long. We are only
long a limited number
of stocks. The recent "Tahiti" stocks, CVX, CAT
and IBM, are the ones I would
favor.
The DIA, SPY and
QQQ's Closing Powers are locked in their own flat trading range
while the DJI decides if it will break out above or below its triangle.
The operative
Peerless Buys signals and the fact that the DJI's price-support-line is
rising
are bullish, as is the expectation the Bernanke will act soon to
provide additional
stimulus. I can't believe Warren Buffett would invest $5 billion
in BAC if he did not
have advance assurances of this.
Seasonality is bearish for 4 more trading days, on average, with the
DJI rising only
40% of the time. But over the next two weeks, the DJI rises
57.8% of the time
since 1966. I
continue to expect a Labor Day rally.
The software for the new TigerSoft Short Term
Chart program
should be posted for Elite Subscribers and those getting the
"S9v updates" this weekend. Use the commands:
Peercomm + Charts - 2011 + Daily Stocks + DIA
+ Lines +
Explode Selected Screen Area + OK + click twice to show boundaries
of new graph.
====================================================================================
8/24/2011
DJI = 11321+322 la/ma= .99 21-dmaROC= -1.224 P = -369 (+100 ) IP21= -.105 V= - 371 OP= -..049
BREADTH STATISTICS:
85
MAXCP stocks Bullish MAXCP Stocks
22 MINCP stocks
Bearish MINCP Stocks
(MAXCP stocks are those showing Tiger Closing Power
making new highs.
This suggests heavy Professional Buying. Applying the Tiger Power Ranker's
"bullish" to the MAXCP stocks find those with heavy insider buying and
institutional accumulation. Bearish MINCP stocks show the opposite.
At this point these are extended a long ways, so - use well-tested CP trendbreaks
to close out positions. Sell S7s occur when Professionals are much more bearish
than the Public is.
5 new
highs on NASDAQ. 23 new lows on NASDAQ
10 new
highs NYSE
13 new lows on NYSE
8/24/2011 ===> See Key Peerless TigerSoft Index Charts: Industry Groups and ETFs
DIA
SPY QQQ
DJIA-Peerless TigerDJI TigerSPY
TigerQQQ GLD
SLV Crude
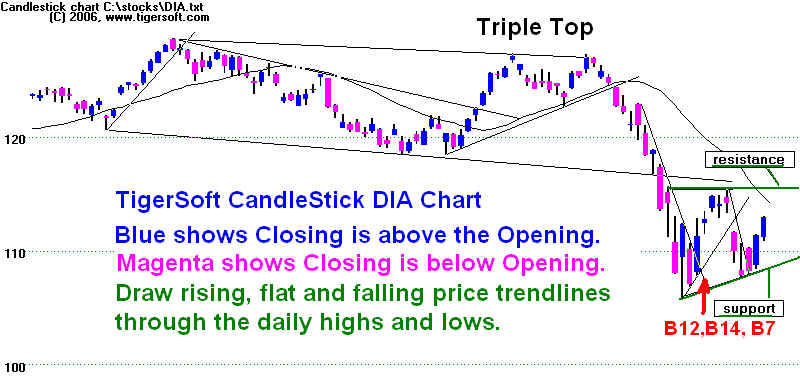
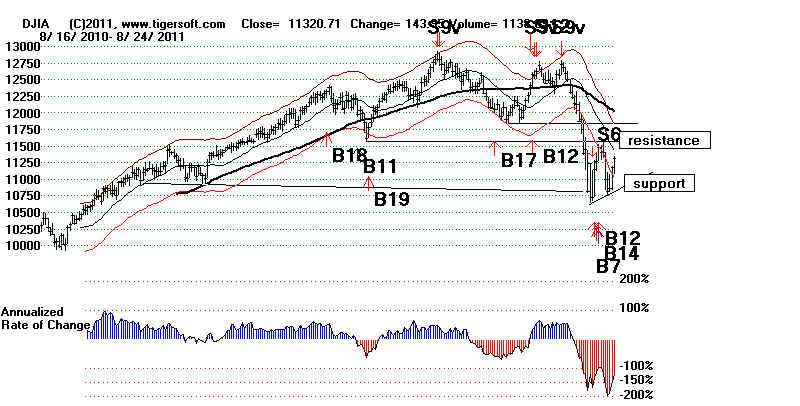
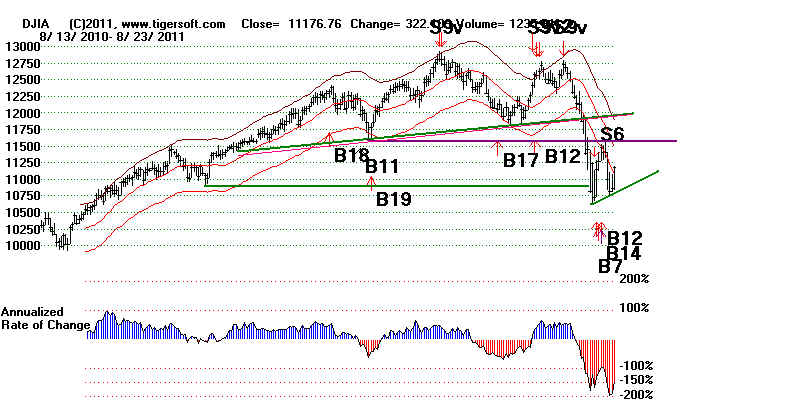
8/24/2011
The Peerless Buy Signals Should Be Given Another Chance. See the
B12, B14 and B7
on the DJIA chart further below. The Closing Powers did break their down-trendlines
for the DIA, SPY and QQQ. Gold's
uptrending CLosing Power line was also broken
decisively today. I have to
advise taking profits in the GLD
position taken near 1500.
We do not want a profit disappear.
DJI's Rising Price Bottoms Are Bullish
I also have to suggest
buying DIA. This is risky, volume
is low on the rally and we do not
know what Bernanke will say about a
further monetary stimulus or helping the big
banks. Nevertheless, we can watch
the rising Closing Powers and abide by them.
We can sell on a rally back to the recent
highs at 116 and, if needed, cut any losses
short by selling if the Closing Power
uptrend is violated. I do
like the rising bottoms
in the DJIA. This has been a bullish signature on earlier DJI
declines from a top before
a strong recovery: 13 Examples
July 1950,
Oct. 1955, Oct 1959, July 1965, April 1980,
Oct. 1989, Feb 1990, Oct. 1990, April
1994, Nov 1997, April
2001 and Sept. 2001.
See 13 Charts where
rising bottom produced a fine rally after a bull market sell-off.
I can find only 3 cases where
the rising price support line was violated and
a bear market followed: March 1966,
March 1973 and Aug 2008. See their Charts.
DIA - TigerSoft Candle
Stick Chart
THE NASDAQ-100
The resignation of AAPLE's founder and
leader, Stephen Jobs, today will probably
cause some weakness in the NASDAQ.
I would bet there will be some great
biographies out on him soon.
For the present, I would wait on buying QQQ.
The number of MAXCP stocks now outnumbers the number of MINCP stocks. One of
the problems I've had in being bullish
has been the absence of many good
MAXCP stocks. There are a few more
tonight. I would favor those with a positive
current Accumulation Index.
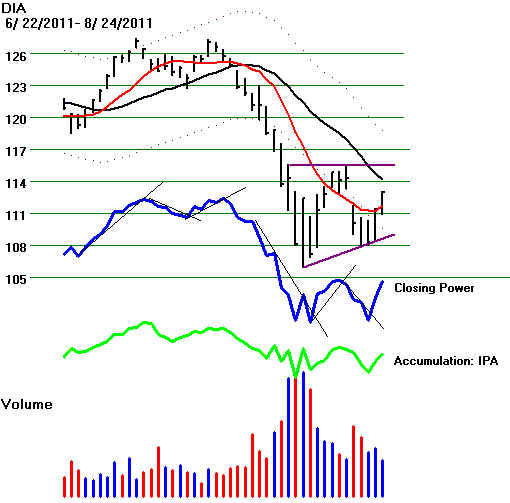
Better Very Short-Term TigerSoft Charts
I think the new more focused charts I am working will help us all, not just very
short-term
traders. Some of you may have ideas
of what could be displayed. The idea is to show
about 30 trading days, broken into two
sides. On one side, will be the Price Chart,
Closing Power, IPA and Volume will be The
Relative Strength Quotient, Opening Power
and the Accumulation Index, though
something else could be displayed, too, at the
pleasure of the user.
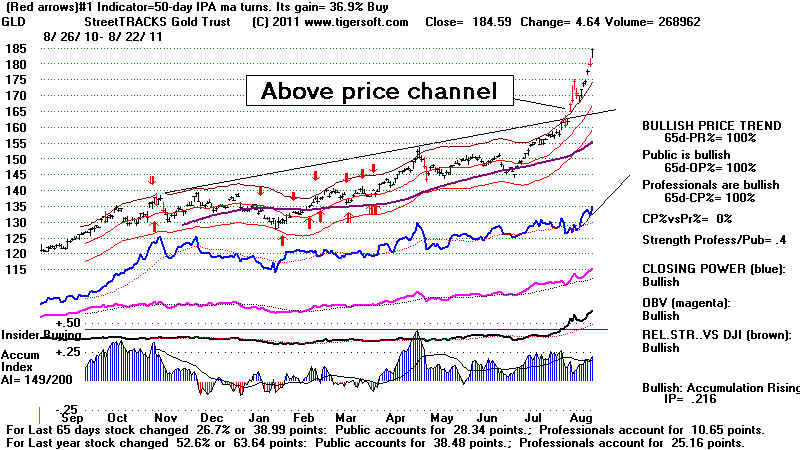
In the chart of GLD below, you can see
that the red down-day volume of yesterday
was very high. That was a bearish
sign. It might have meant taking more seriously
the steep Closing Power uptrend of
yesterday. See the new GLD chart below.
GLD - Draft of New Tiger Short-term Chart
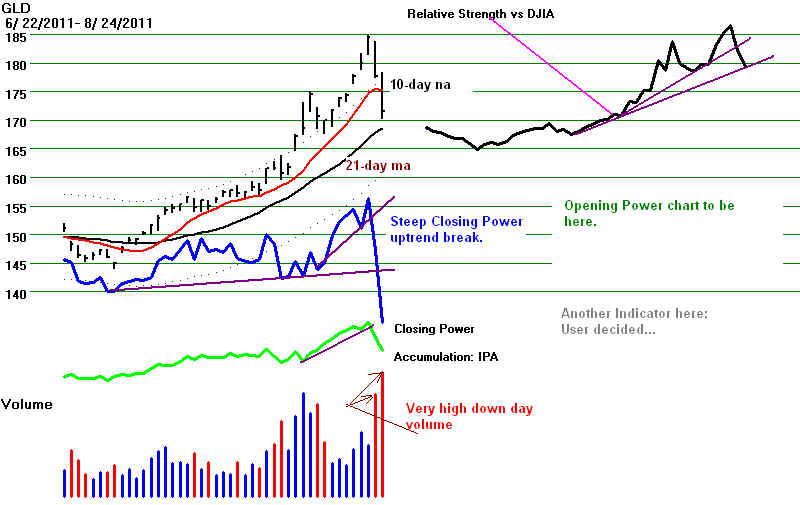
GLD - Gold ETF - Closing
Power's Uptrend was broken.. In the past such breaks
have cooled off the advance for a while.
But with Gold being heavily speculated in,
it may just bounce up off the rising
21-day ma and start up again. See below how positive
Accumulation Index is. That
suggests buyers in the wings will scoop GLD on a decline.
If Bernanke loosens further public funds
to protect the big banks, the monetary scenario
that is most bullish for Gold will
continue. Of course, speculation in Gold could be
reduced by increasing margin requirements
here, as Shanghai has done. But Obama's
regulators may not be so inclined to
intrude. They have been loathe to offend the big
banks or Wall Street since March 2008.
 |
PEERLESS DJIA
 |
DIA and CLosing Power
 |
SPY and Closing Power
 |
QQQ and CLosing Power
 |
==================================================================================
OLDER HOTLINES
===================================================================================
8/23/2011
DJI = 11177+322 la/ma= .973 21-dmaROC= -1.459 P = -469 (+191 ) IP21= -.149 V= - 404 OP= -.115
BREADTH STATISTICS:
53
MAXCP stocks Bullish MAXCP Stocks
165
MINCP stocks Bearish MINCP Stocks
(MAXCP stocks are those showing Tiger Closing Power
making new highs.
This suggests heavy Professional Buying. Applying the Tiger Power Ranker's
"bullish" to the MAXCP stocks find those with heavy insider buying and
institutional accumulation. Bearish MINCP stocks show the opposite.
At this point these are extended a long ways, so - use well-tested CP trendbreaks
to close out positions. Sell S7s occur when Professionals are much more bearish
than the Public is.
3 new
highs on NASDAQ. 132 new lows on NASDAQ
4 new
highs NYSE
159 new lows on NYSE
8/23/2011 ===> See Key Peerless TigerSoft
Index Charts: Industry Groups and ETFs
DIA
SPY QQQ
DJIA-Peerless TigerDJI TigerSPY
TigerQQQ GLD
SLV Crude
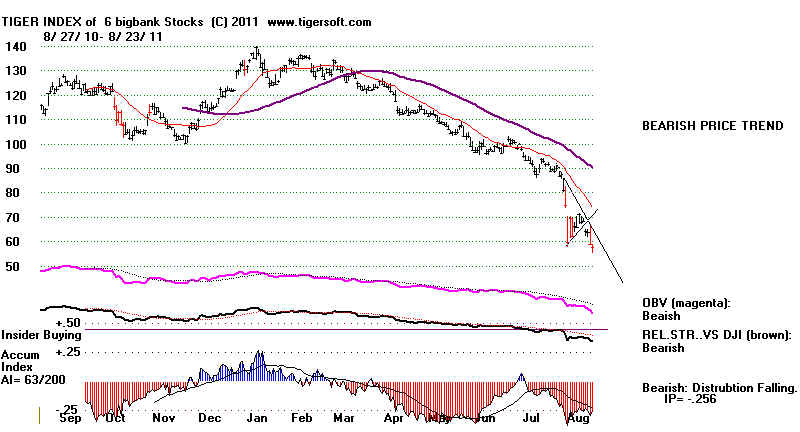
The Financial Canary Looks Very Ill
Again.
How much of a rally can there be when the biggest banks stocks like BAC,
GS, C and MS
hardly turn up on a day the DJI rises
more than 300? The big banks show very heavy
red distribution and falling Closing
Powers The weakening housing market is a
huge problem and none of the home building stocks we follow is now above its 65-dma.
These are the same conditions we saw in 2007 and 2008. This
time around, however,
it will be very hard politically for the
FED and Congress to bail out the big banks.
I think Obama, Geithner and
Bernanke may try to do something on their behalf in a few days,
rather than next year in the middle
of the Presidential campaign. That may bring a Labor Day
bounce for the market. Here
is a new group-chart which I will call BIGBANK. The data for
these will be available starting
tomorrow on our Tiger Data Page.
If the bank stocks do not turn up
soon, we will be entering the normally bearish period of
September and October and they will
be even more susceptible to heavy professional
shorting. The leveraged short
ETF on Financial, FAZ, gives traders
a way to really hurt
these stocks. It will be hard
to ban shorting on financials, as France has done, and still
allow shorting ot other stocks.
Watch the Closing Power Downtrendlines
Hold the Bearish MINCP Shorts as long as
their CLosing Powers are in tact.
Stay Long Gold, where the CLosing Power
is still in an uptrend. The Peerless Buys
are treated with high suspicion here
until the DJI gets back within the normal 3.5%
bands and the 21-Day ANROC rises back
above -1.00. The first condition is now
extant. The DJI is now 2.7%
below the 21-day ma. But the momentum is still too deeply
down. The 21-Day ANROC is
-1.459. (See the discussion of ANROC last night and
the the day before, too).
Watch the key ETF's CLosing Power downtrends.
The rally today did not break their
downtrends. Despite today's rally, there
are 3x more MINCP than MAXCP stocks.
Market leadership is extremely defensive and
very scattered. Both the Opening
and CLosing Powers are falling. This is
when there is greatest risk of a steep decline.
Prices are apt to open lower and then do much
lower at the close.
Very short-term computerized traders jumped
aboard when they saw that there would not be
a follow-through decline this morning.
They understand that the DJI's rising bottoms
offer a useful uptrendline. shown below in green. As
long as that uptrendlineis not violated,
some quick traders are willing to hold and see
if a base for a bigger bounce forms.
It is a simple matter of risk reward for them. Other computerized traders, with their
ability to trade in a nanosecond, and trade
overseas if needed, are apt to sell if the
markets are not up tomorrow after the first 30
minutes. Their loyalty to holding is measured
in minutes, not months.
Day Trading
Day traders, the only way I know to trade these
one day moves is to understand that
once short-term support holds, a rally looking
for resistance usually develops. Draw
trendlines on a very short-term chart. Accept
modest profits when there is so much overhead
supply of stock and the 21-day momentum is down
steeply, as now Yahoo provides useful
5-day charts, but 10-day charts are better.
I will have to write something that produces this.
Usually, I would say trade the trend predicted
by the Peerless operative signals. Here
that would mean trading on the Buy side.
But because of how far below the 21-day ma the
DJI was when they occurred, they are very
suspect.
DJIA and Automatic Peerless
DIA, QQQ and SPY with Closing Power Downtrends
Work in progress
=====================================================================================
OLDER HOTLINES
=====================================================================================
8/22/2011
DJI = 10855 +37 la/ma= .939 21-dmaROC= -1.868 P = -661 (-11 ) IP21= -.19 V= - 452 OP= -.183
BREADTH STATISTICS:
26(-25) MAXCP stocks
Bullish MAXCP
Stocks (only gold looks
good)
553 (+222)
MINCP stocks - Bearish MINCP Stocks
(MAXCP stocks are those showing Tiger Closing Power
making new highs.
This suggests heavy Professional Buying. Applying the Tiger Power Ranker's
"bullish" to the MAXCP stocks find those with heavy insider buying and
institutional accumulation. Bearish MINCP stocks show the opposite.
At this point these are extended a long ways, so - use well-tested CP trendbreaks
to close out positions. Sell S7s occur when Professionals are much more bearish
than the Public is.
3 new
highs on NASDAQ. 132 new lows on NASDAQ
4 new
highs NYSE
159 new lows on NYSE
8/22/2011 ===> See Key Peerless TigerSoft
Index Charts: Industry Groups and ETFs
DIA
SPY QQQ
DJIA-Peerless TigerDJI TigerSPY
TigerQQQ GLD
SLV Crude
Hold
the Bearish MINCP Shorts, Stay Long Gold and Watch The CLosing Power Downtrends.
Our Bearish MINCP Stocks keep falling and Gold keeps rising. Until these plays break
their Closing Power trends, I would just
keep doing what is working. Gold is due for
another pullback, but it will probably be
short-lived.
TESTING for A BOTTOM in QUICKSAND?
A break in the CP downtrend will be needed to
bring a trustworthy rally. The key
markets are again testing their recent
lows' support. The recent Peerless Buys are trying
to produce a rally going into Labor Day's
bullishness, but both Opening and Closing
Powers are still falling and the indexes
are too far below their 21-day moving avgs. to
trust the Peerless Buys.
 . .
Today's rally at the opening fizzled
away, but the DJI still closed up. The Closing Powers
for the DIA,
SPY and QQQ are in falling
trands. Notice how Professionals have turned
to selling and shorting 20x more stocks
than they are buying: the ratio of MAXCP
stocks to MINCP stocks is 553 to
26. The DJI is clearly trying to hold up at the recent lows
just above 10600. Because of the
ways the DJI has knifed through higher support
levels, my guess is that we should expect
a test of 9800, which represents a 50% correction
of the last two and a half years' gain,
from 6550 to 12800.
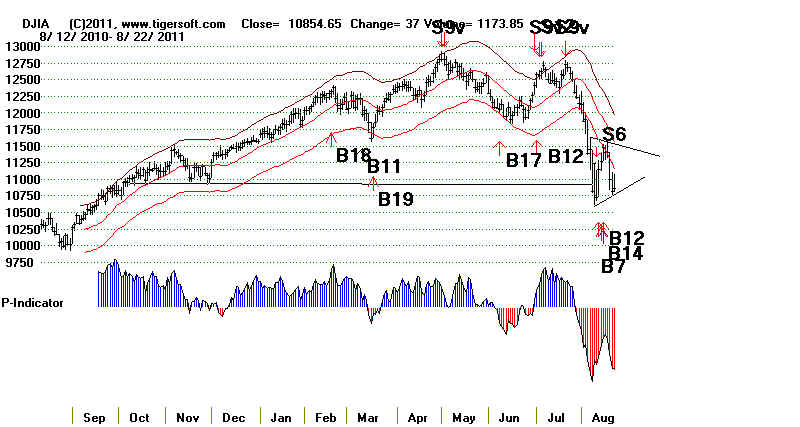
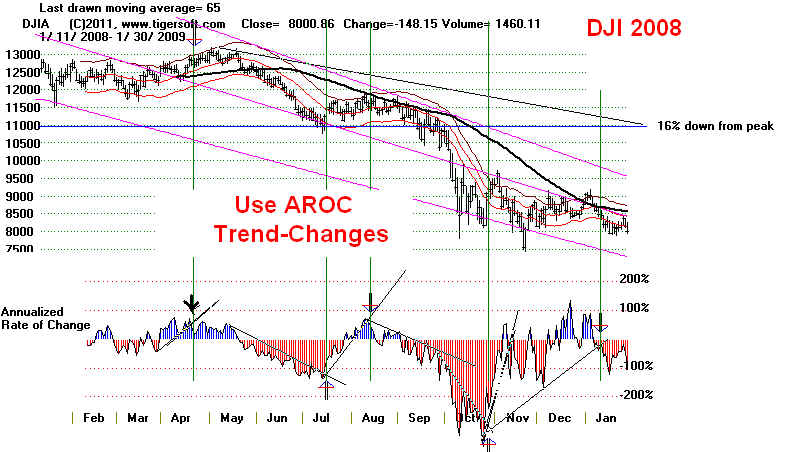
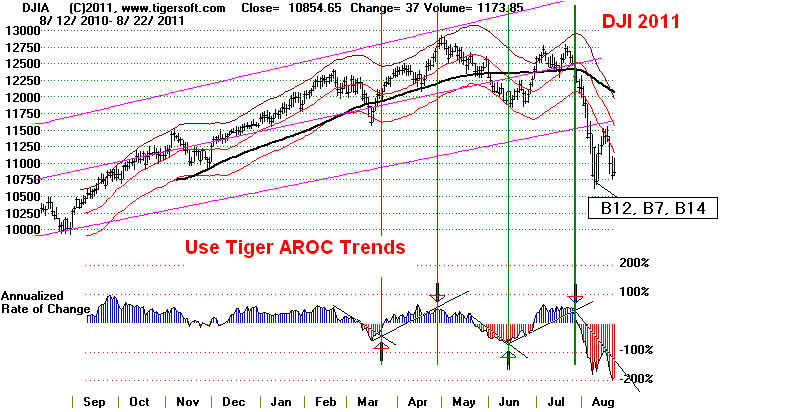
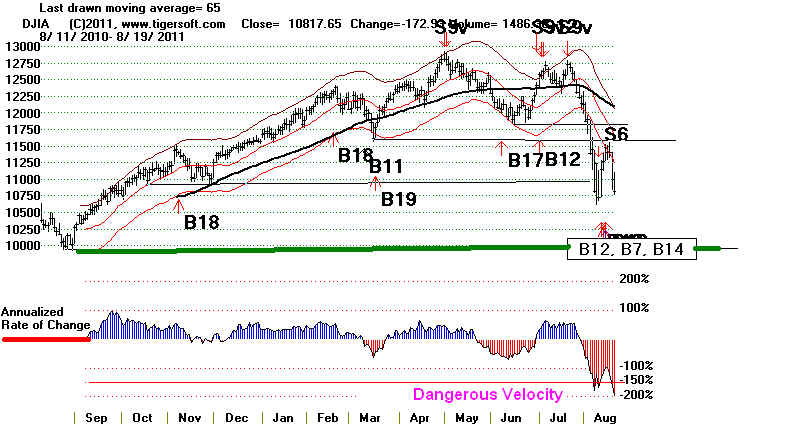
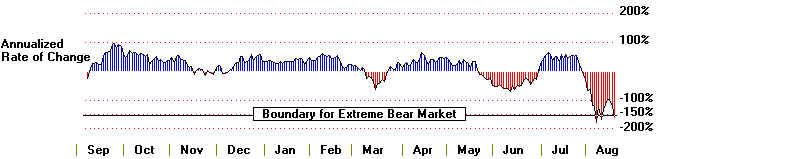
The problem remains the unusual speed of
the decline. We measure that using the
daily rate of change of the 21-day ma
times 250. This is Tiger's "AROC". As in 2008,
below, the DJI is trying to hold up after
falling almost 16%. In 2008, despite the rate of
decline, when the DJI's AROC broke its
downtrend, the DJI made one last attermpt to
get up past the falling 65-dma. It
could not and instead the AROC uptrend was broken
and the extreme bear market followed.
This seems a good model for now. If the AROC
downtrend here (below) breaks its
downtrend, we should see a rally here, back up
towards 11600. The falling Closing
Powers trends will have to be broken first. Until then,
be suspicious of openings.
 |
 |
=====================================================================================
OLDER HOTLINES
=====================================================================================
8/19/2011
DJI = 10818 la/ma=
.929 21-dmaROC= -1.935 P =
-650 (-163 ) IP21= -.171 V= - 458
OP= -.25
BREADTH STATISTICS:
51 (-21) MAXCP stocks Bullish MAXCP Stocks
(only gold looks
good)
231 (+167)
MINCP stocks - Bearish MINCP Stocks
(MAXCP stocks are those showing Tiger Closing Power
making new highs.
This suggests heavy Professional Buying. Applying the Tiger Power Ranker's
"bullish" to the MAXCP stocks find those with heavy insider buying and
institutional accumulation. Bearish MINCP stocks show the opposite.
At this point these are extended a long ways, so - use well-tested CP trendbreaks
to close out positions. Sell S7s occur when Professionals are much more bearish
than the Public is.
4 new
highs on NASDAQ. 187 new lows on NASDAQ
4 new
highs NYSE
203 new lows on NYSE
8/19/2011 ===> See Key Peerless TigerSoft
Index Charts: Industry Groups and ETFs
DIA
SPY QQQ
DJIA-Peerless TigerDJI TigerSPY
TigerQQQ GLD
SLV Crude
Friday's news that Hewlett Packard's plan to get out of the personal
computer business
rattled IBM, APPL and many of HPQ's
suppliers. HPQ, a DJI-30 stock, fell 20%. They
would not be exiting this field if
they felt consumers were going to have lots of money to buy
new computers. They would not
be getting out of the business if they thought that Microsoft
and other vendors were on the verge
of offering break-through new software products. This
news is another wave breaking over
the markets and dampening confidence. Each few
days in a bear market, something
new befalls the market. At some point a new technology
will emerge that will attract
investors and we will watch for it. But right now, Professionals
are seeing more opportunity in
short-selling. (Perhaps, short-selling should be banned, so
that boosters of new technologies
would always be paid more attention to. But that, of
course, is not how the system
works. Short-selling we are told by Wall Street is good for
markets and somehow good the
general economy.). Given the leveraged short ETFs and
the unlimited short selling on down
ticks using phantom borrowed shares, I would
definitely respect the trend, which
is now down. I would be surprised if the DJIA does not
re-test 9800-10000.
Considering the speed of the
decline, I would remain bearish and advise being heavily
short the bearish MINCP stocks
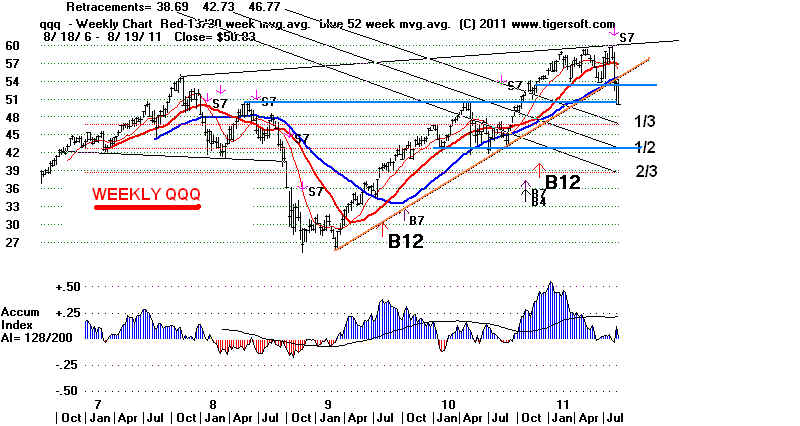
despite the recent Peerless Buys. The QQQ needs
to correct at least 1/3 of its
advance since the bottom in March 2009.
The weekly QQQ (below) and weekly DIA do show much stronger Accumulation Index
readings than they did in July 2008
just before the markets collapsed. The daily Accumulation
Index readings are more important,
I think, and they are bearishly negative. Another
difference from 2008 is that gold
and gold stocks are not collapsing. Not quite everything
is being hastily sold in a
panic. Will this save the market from a comparable decline. I think
so, but right now, more weakness
seems likely.
TRADING SHORT-TERM
We will want to keep watching the
CLosing Powers' declining trends for the DIA,
SPY
and QQQ. A break in them to the upside will likely
bring another bounce from
the oversold condition we are
in. I noticed that these ETFs' data have been changed
from their first posting.
Look here for the charts using the last posted data.
There is some bullish news and the Opening appears to be up.
.
1) It looks like Libya will
soon be free of Gadhafi. That will end one of America's 3
expensive.
2) Congress and the President
are on vacation. They cannot make things worse.
3) Seasonality will soon turn
bullish. Though the DJI has risen only 46.7% of the time
over the 3 trading days after
8/21 since 1966, it rises 57.8% of the time over the
next two weeks.
A DJI close clearly below 10600
will probably bring a Sell S13. It would reverse
the now active Buy signals that we
have been largely ignoring because of the speed
of the decline and because of the
DJI being so far below the normal 3.5% bands.
It may even come close to also
causing us to switch to "Extreme Bearish Mode".
That would require an S13E.
The difference between a Sell S13 and Sell S13E is mainly
that a still deeper decline must
occur. See the discussion of Sell S13s and Sell S13Es
since 1929. (Some additional
programming is being done to show these signals
automatically and to document the
parameters used. Folks who have gotten the S9V
updates will get these
automatically. The Peerless updates are also be posted on the
Elite Subscribers' Page (ESP).
For now let's wait to see what
happens over the next two weeks. If there is a new
decline, we will need to see what
the internals of the market are then and test them,
to see how well they match the past
cases shown that have produced Sell S13s.
GOLD - Still
the best Long Bet?
Gold's
continued rise shows how universal are fears that currencies are endangered by
the significant weakening of
world economies, especially in Europe and the US. There
does not appear to be any
other better investment. So speculators are attracted, of course,
too. Will Gold keep
rising? Probably. After all, Silver has risen 800% since 2003. Low
interest rates make holding
zero-dividend gold in a vault cheap. In 1980, Gold rose even
when interest rates went over
10%. Only a deliberate FED deflationary policy that was
willing to bring a deep
recession stopped gold's rise.
I don't see the FED worrying
soon about Gold's rise, although there are those that consider
3 dissenters to be an
"open revolt", as there were when Bernanke put forth his
promise that the Fed would
keep rates low for two years. (See "Term at the Fed"
(2004)
by Laurence Meyer.) The
dissenters were from the middle of the country, Dallas,
Kansas
City,
and Minneapolis,
far away from the financial centers and the biggest banks. So long as
the Dollar is not weaker than
a basket of other countries, I don't see how the Fed's policies
will become restrictive
before the Election next year. Keep checking the US Dollar
chart
we show most nights.
Even some gold stocks are
rising now. They have been lagging for more than a year.
It is the Public and
foreigners who are buy the likes of NEM. Professionals, as judged
by the Closing Power, have
been steady sellers. If the red Distribuition were end and
CLosing Power start an
uptrend, I would recommend it. But right now, GLD is still
preferred. When you
view Gold and SIlver stocks using TigerSOft understand that
speculative stocks can go up
a long way simply because of higher openings caused
by overseas buyers and public
speculators. Using the Tiger RSQ (Relative Strength
Quotient trends works well.)
===================================================================================
Older Hotlines
====================================================================================
8/18/2011
DJI = 10991 -420 la/ma=
.937 21-dmaROC= -1.594 P =
-488 (-145 ) IP21= -.13 V= - 382
OP= -.17
BREADTH STATISTICS:
51 (-21) MAXCP stocks Bullish MAXCP Stocks
(only gold looks
good)
231 (+167)
MINCP stocks - Bearish MINCP Stocks
(MAXCP stocks are those showing Tiger Closing Power
making new highs.
This suggests heavy Professional Buying. Applying the Tiger Power Ranker's
"bullish" to the MAXCP stocks find those with heavy insider buying and
institutional accumulation. Bearish MINCP stocks show the opposite.
At this point these are extended a long ways, so - use well-tested CP trendbreaks
to close out positions. Sell S7s occur when Professionals are much more bearish
than the Public is.
1 new
highs on NASDAQ. 174 new lows on NASDAQ
1 new
highs NYSE
134 new lows on NYSE
8/18/2011 ===> See Key Peerless TigerSoft
Index Charts: Industry Groups and ETFs
DIA
SPY QQQ
DJIA-Peerless TigerDJI TigerSPY
TigerQQQ GLD
SLV Crude
The recent Buys are not looking so good! Not a big surprise to
readers here...
Hold Gold. Sell any long stocks if their Closing Power uptrends are
broken and
Add to your Short Sales among the Bearish
MINCP stocks. The recent Peerless Buy
signals will probably be reversed by a
Sell S13 if the DJI closes below 10500.
The Velocity of This Decline Is Terrifying.
The severity of the decline today comes closer
to causing an automatic Sell S13, which
would force us to use the Extreme Bearish
Mode. NYSE down volume was almost 40:1.
Volume picked up on the decline. The
market is hanging by a "Fed" and his low interest
rates. Gold and Bonds are the only strong
groups. This sure looks like the
start of a
big bear market. 9700 is the next
support, it the market breaks down to new lows.
It would seem none of the political leaders has read Keynes or studied the
tragic effects
of budget balancing in 1930, 1931 and 1932..
The financial stocks slumped badly today,
just as they did in 2007 and 2008 before each
big sell-off.
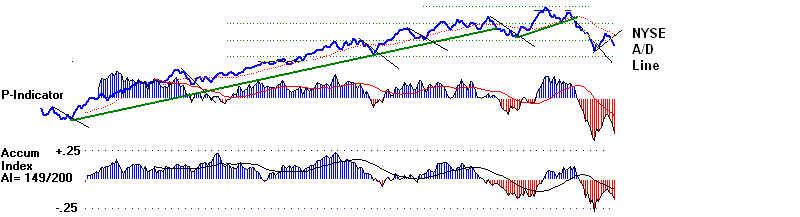
The main hope rests in the low interest rates.
That helps hold up the A/D Line. But
rising A/D Lines can follow the DJI down a long
ways. This was true in 1977 and 2001.
Japan's 1990's experience is a warning about
the limits of monetary policy. There comes
a tipping point past past which low interest
rates can no longer keep stocks rising and they
must fall.
http://www.tigersoftware.com/TigerBlogs/February-21-2009/index.html
http://www.tigersoft.com/tiger-blogs/February-04-2008/index.htm
Professionals have shifted to the Sell and
short side. The MINCP stocks now outnumber
the MAXCP stocks by 6:1. The keys ETFs
Closing Powers are declining. See the QQQ
below and the SPY and DIA in the page with the
key charts. Note the downtrend-line
that starts at the July high and goes down
through the recent peak.
A New Sell S13 To Switch To Bearish Mode
I have been warning that we seem to be in a
perfect financial sorm. I won't repeat what I
have been writing for the past few weeks.
But there comes a point in a very sharp decline
where we must not only switch completely to a
Sell, but also make it much more difficult
to get a major Buy signal. Presently, the
Peerless software produces an automatic Sell S13
when the decline accelerates past a threshold
based on the annualized rate of change of the
21-day ma. I have shown here that when
the AROC drops below -1.5 on a DJI decline down
from a high, a bigger decline becomes a high
probability.
http://tigersoftware.com/TigerBlogs/8-15-2011/index.html
A new very simple rule to produce a Sell
S13 should probably be introduced now.
It would protect us from being caught in
what would certainly become a much deeper
decline. This new Sell S13 would
occur when the DJI falls more than 16% in only
21-trading days after being at or close
to its bull market high. It is highly unusual.
But you can see in the charts below its
usefulness in 1929, 1937, 1940, and 1987.
These are its only occurrences.
More details will be posted this weekend on the S13.
====================================================================================
OLDER HOTLINES
====================================================================================
8/17/2011
DJI = 11410 +4 la/ma=
.966 21-dmaROC= -1.181 P =
-343 (-57 ) IP21= -.11 V= - 307
OP= -.141
BREADTH STATISTICS:
72 (+3) MAXCP stocks - Bullish
MAXCP Stocks
64 (+36)
MINCP stocks - Bearish MINCP Stocks
(MAXCP stocks are those showing Tiger Closing Power
making new highs.
This suggests heavy Professional Buying. Applying the Tiger Power Ranker's
"bullish" to the MAXCP stocks find those with heavy insider buying and
institutional accumulation. Bearish MINCP stocks show the opposite.
At this point these are extended a long ways, so - use well-tested CP trendbreaks
to close out positions. Sell S7s occur when Professionals are much more bearish
than the Public is.
8 new
highs on NASDAQ. 59 new lows on NASDAQ
13
new
highs NYSE
9 new lows on NYSE
8/17/2011 ===> See Key Peerless TigerSoft
Index Charts: Industry Groups and ETFs
DIA
SPY QQQ
DJIA-Peerless TigerDJI TigerSPY
TigerQQQ GLD
SLV Crude
Peerless remains on Buys. The A/D Lines are still rising
Short-Term. MAXCP Stocks
Bullishly Outnumber MINCP Stocks.
Unfortunately, I have been warning that
we seem to be in a perfect financial
storm, brought on by political leaders in
Europe and the US who show no knowledge
of the 1930s ( http://tigersoftware.com/TigerBlogs/83---2011/index.html
)
and that these Buys have occurred when
the market was showing:
1)
unusually bearish downward momentum,
2) much
farther below the lower band than is safe and
3) with the
DJI having slipped more than 13.5% from its highs, usually an important
bearish tipping point.
Continue to hold Gold
and hedge with bearish MINCP stocks against any long holdings
in the bullish MAXCP stocks. It is
not good that the markets are falling back after
merely brushing the resistance of their
broken supports. This frequently occurs on
the first rally up after the first leg
down in a new near market. See more discussion
of the importance of this rally's
strength further below and at a new non-Public Blog
I wrote tonight.
http://tigersoftware.com/TigerBlogs/8-17/index.html
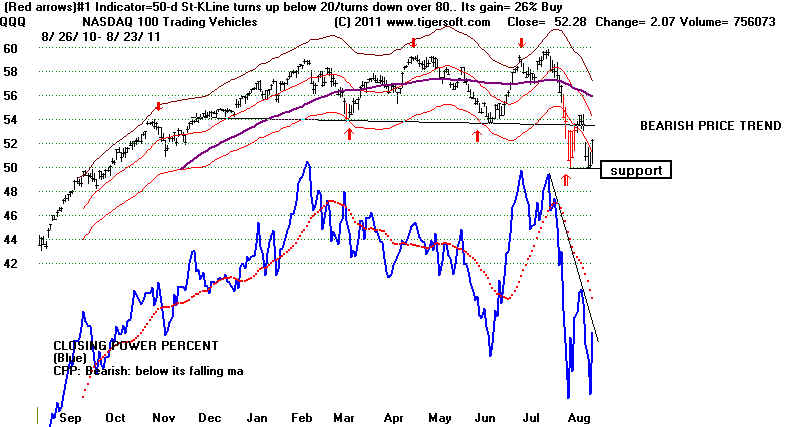
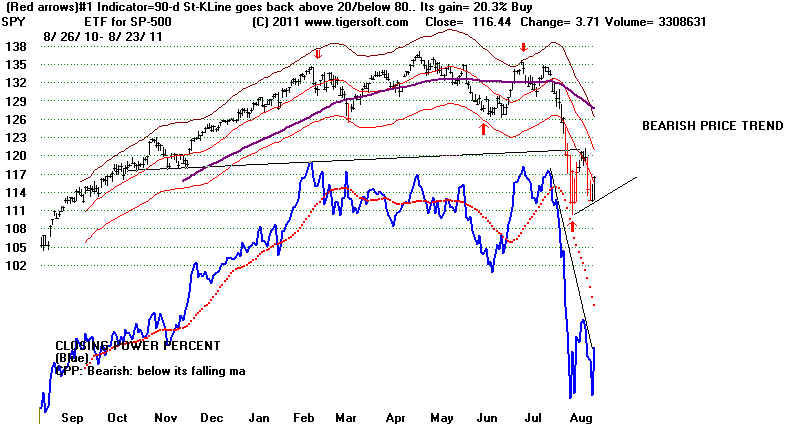
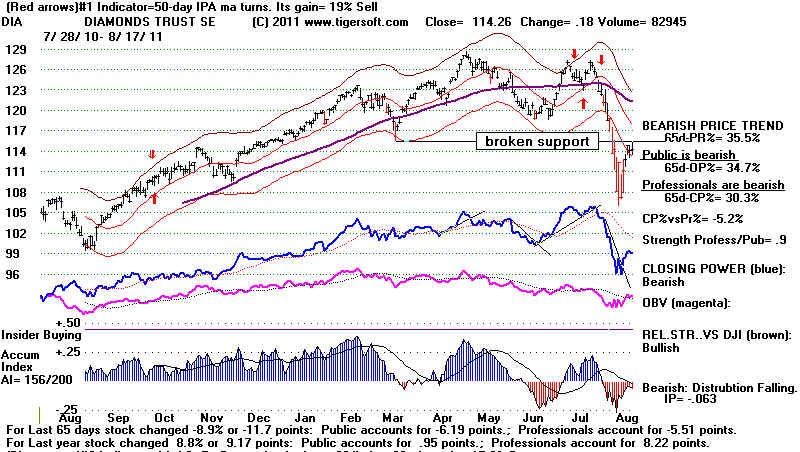
Bearishly, the DJI and QQQ have reached
and are now falling back from the levels
we expected would be resistance, using
the simple principle that broken support
become resistance. I advised
selling QQQ at the opening today (53.98). Now we
must wait for a retest of 11000 or even
10600 and a break in the new CLosing Power
downtrend to buy. See also how the
QQQ reached and fell back from its longer-term
declining CP trend that starts back in
July. This gives added importance to it. More
on this tomorrow night.
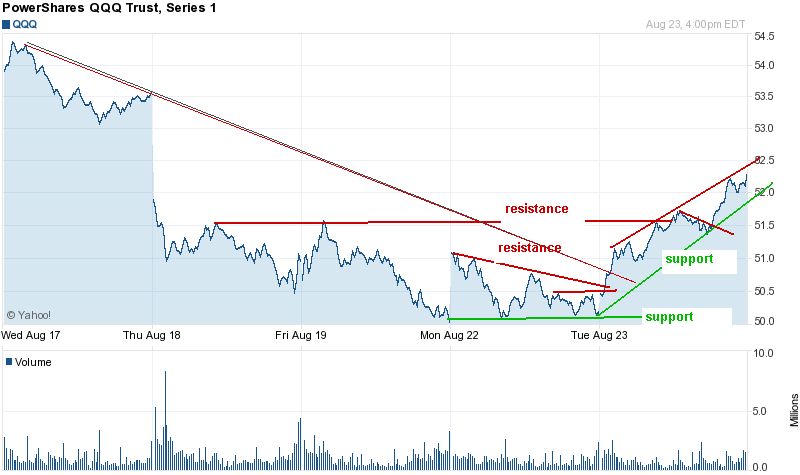
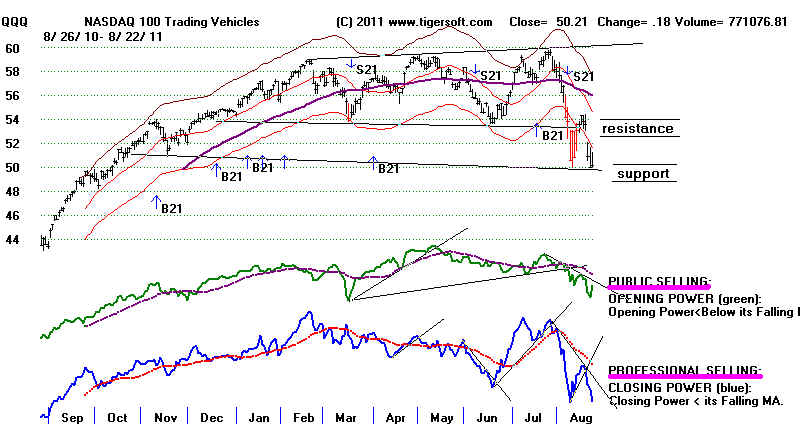
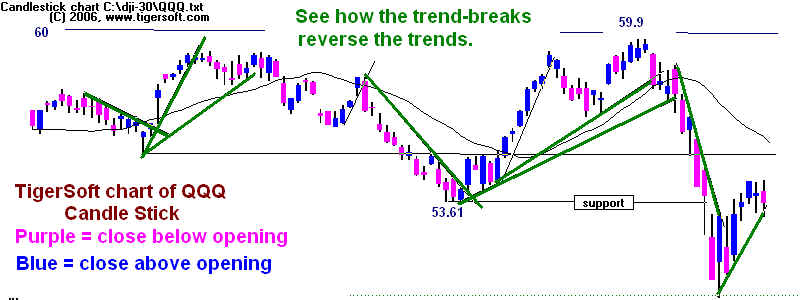
Traders, here are some new trading ideas.
The first occurs when we draw (green) lines through the
bottoms of the Tiger candle-
stick charts of ETFs like the QQQ. below.
The futures are down more than 100 at this
writing. A break in the green
uptrend seems very likely tomorrow,.
The second key trendbreak
is with the Tiger Closing Power. See charts further
below. A CP uptrend-break in the
QQQ seems imminent.
Calculating The Slope of the CP Uptrend
To Show Exactly What It Will Take To Get A CP Trend-Break.
This procedure will have to be inserted
in the CP graphing program. If the math below
is too detailed, don't worry, the
important CP trendbreaks are easily spotted
on the Tiger charts. Know that they
are most important after non-confirmations
of new price highs or lows, when the CP
line is well-tested and when the CP breaks
its trend after a key test of of support
or resistance. Here we have a potential CP
uptrend-break following a test of
resistance.
Y = MX + B
I want here to show you how these CP trends are
actually calculated and how
we can even determine exactly how much
the Close must be below the Opening
the next day to break the current CP
uptrend.
The Closing Power uptrendline (as of
8/17/2011) starts on 8/8/2011 when
Closing Power is said to be 0. It
rises through the low Closing Power point
on its next dip's low. This is the
second day, 8/10/2011, when Closing Power is
+.68. The slope of the CP uptrend
through these two points is .34/ daily
( CP(2) - CP(0) ) / 2
Today, the 7th day of the CP uptrend,
shows the CP slope (i) crosses at 2.38,
while the current CP(i) is 2.60.
The CLosing Power is still above the uptrend.
But tomorrow the CP slope(i) will be
2.72. Unless tomorrow's Closing Power
is above 2.72, the CP uptrend will be
broken. The CP must rise by +.12 or more
tomorrow or the CP uptrend will be
broken. (Slope(8) = CP(7) )
Closing CP
Power(I) Uptrend
Day Date
Close Opening
Difference
Cumulative Slope(i) Line
( i )
(LA(i) OPNG(i) (LA(i)-OPNG(i))
Difference(i)
0
0
0
1
8/9/2011 53.03
51.31
+1.72
+1.72
.34
2
8/10/2011 50.86
51.82
-1.04
+0.68
.68
3
8/11/2011 53.1
51.58
+1.52
+2.20
1.02
4
8/12/2011 53.57
53.42
+0.15
+2.35
1.36
5
8/15/2011 54.36
53.77
+0.59
+2.94
1.70
6
8/16/2011 53.9
53.82
+.08
+3.02
2.04
7
8/17/2011 53.58
53.98
-0.40
+2.60
2.38
8
2.72
The Bearish Historical
Significance of The DJI Failing To Rally Up
Past Recent Broken Support
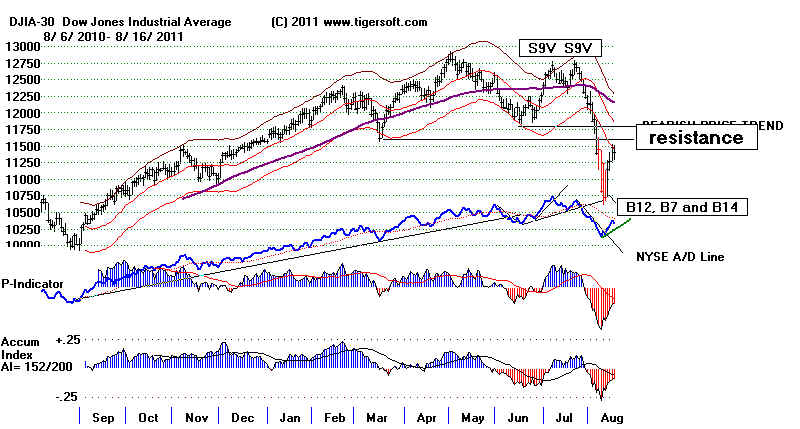
The
DJIA rally faltered as it approached the 11500 broken support-now resistance level.
The QQQ also backed off its broken
support at 54. This is normal What is important
is that If traders get sufficiently discouraged
by the market's inability to rise up past
these levels of earlier broken support, a new
selling wave can bring a deeper decline
and a much longer bear market. A minor
pull-back is allowable but it should be brief,
if we are going to see a good recovery and a
bull market resume.
It is very important for the bulls that the
market not just get back to the recent
highs near 12750-12800. Clear new highs
must follow in five months, with the A/D Line
leading the way. There have only been two
cases of a 13.5% DJI decline where the bull
market resumed quickly. They occurred in
the Summers of 1950 and 2010. In both cases,
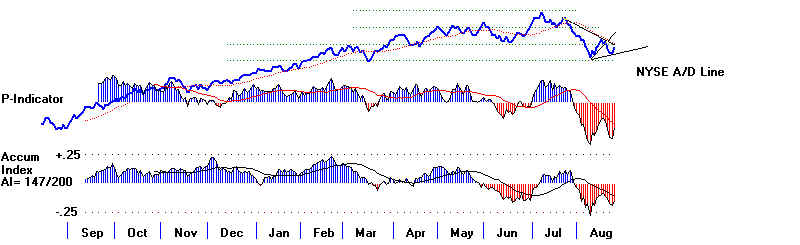
the NYSE A/D Line led DJI prices to new highs.
See immediately below their two cases.
In the current market, the DJI has failed 15%.
That makes our case more bearish.
But we are operating with Peerless Buys now
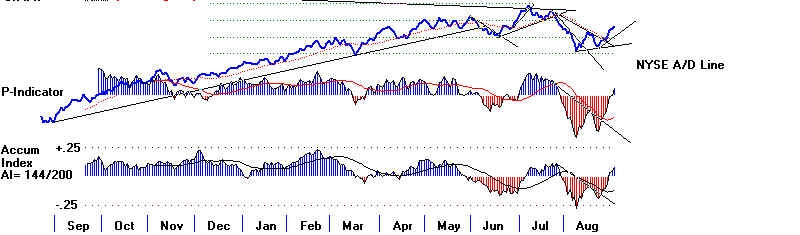
We will want to watch the NYSE
A/D Line on the current rally. It is
still uptrending and today when the DJI closed
essentially flat, there were 595 more up than
down. This is probably a result of
the Fed's very low interest rates.
See
what the DJI looked like in the past as it tried to rally up after the first selling wave
in what became bear markets. http://tigersoftware.com/TigerBlogs/8-17/index.html
In the 12 bear market declines since 1966,
there were only 2 cases where there
was no significant counter-trend relief rally.
The decline just got worse and worse.
In 7 cases, the DJI rallied back up to the next
higher broken support levels, but then
failed and a bear market followed.. In 3
cases, the DJI rallied up through broken
support but then failed to make a clear new
high and a bear market followed.
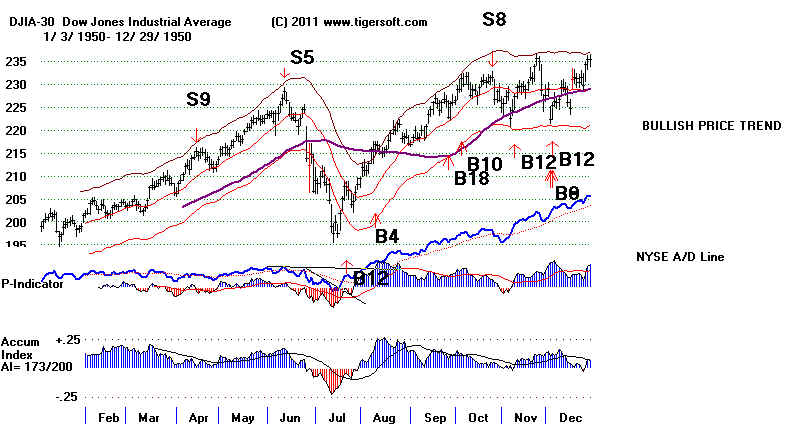
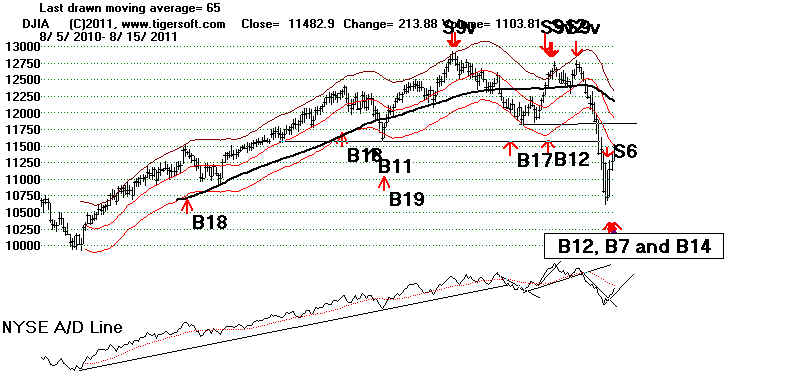
1950 - 13.5% DJI Delcine and Bull
Market Resumption
Note how the NYSE A/D Line led the DJI upwards.
 |
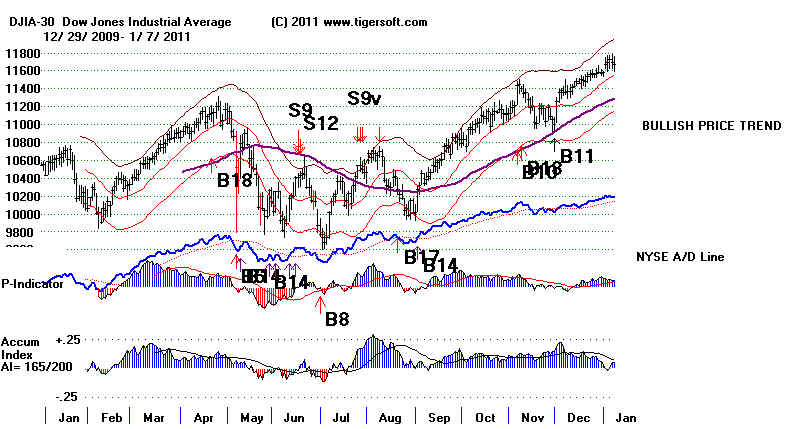
2010 - 13.5% DJI Delcine and Bull Market
Resumption
NYSE A/D Line led prices upwards to more new highs.
 |
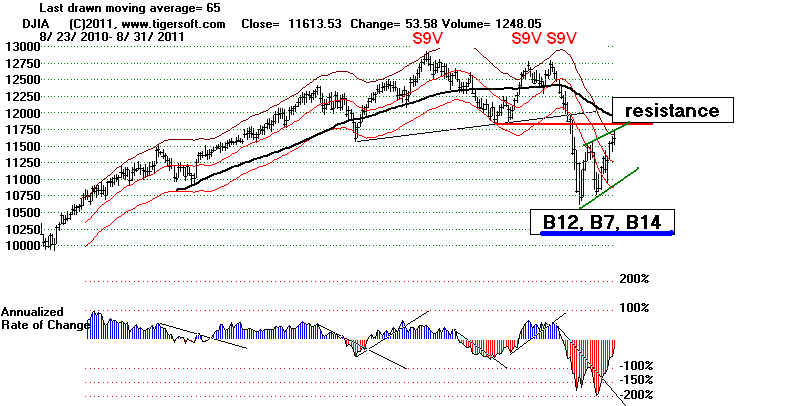
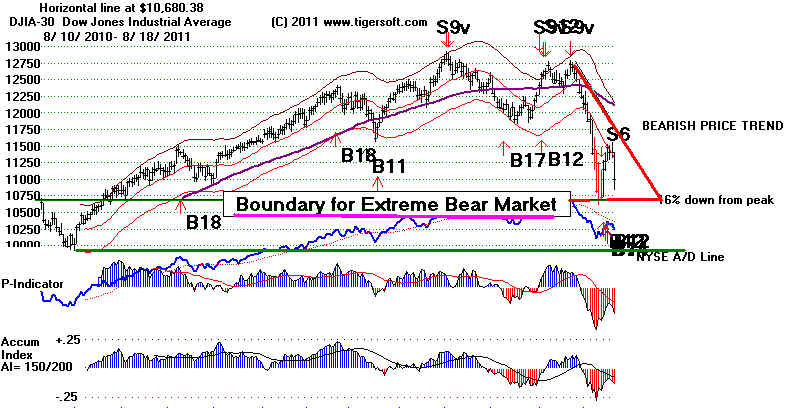
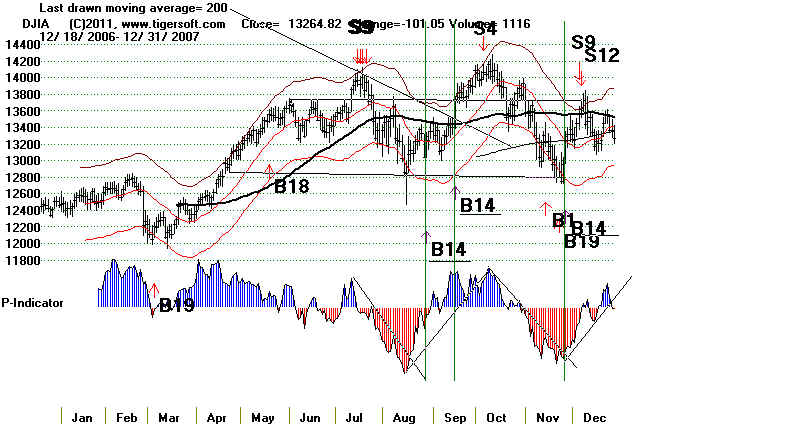
DJIA In
quick succession, Peerless has brought a B12, a B7 and a B14.
I have warned that
these occurred when the market was showing
unusually bearish
downward momentum, was unusually far below the lower
band and with the DJI
having dropped more than 13.5% from its highs,
usually an important
bearish tipping point.
When the signals bunch together, to detail them, use the commands
Operations + Trading Results - All
Signals 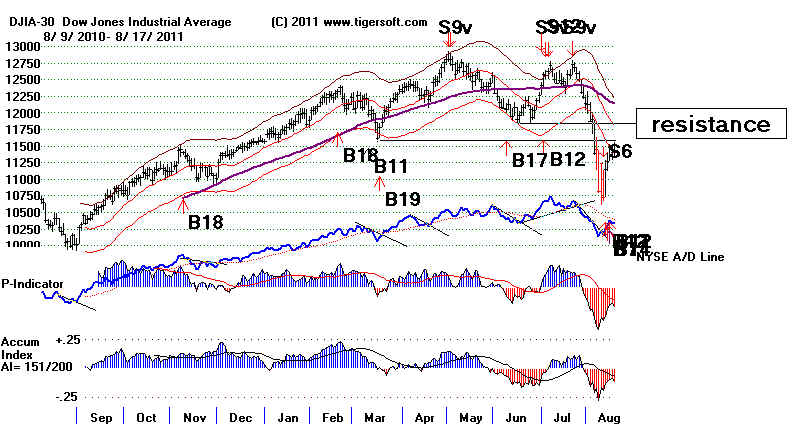 |
DIA
 |
SPY
 |
QQQ
|
==================================================================================
OLDER HOTLINES
==================================================================================
8/16/2011
DJI = 11405.93 -77 la/ma=
.979 21-dmaROC= -.979 P =
-287 (+29 ) IP21= -.087 V= - 287
OP= -.15
BREADTH STATISTICS:
69 (+31) MAXCP stocks - Bullish
MAXCP Stocks
28 (-41)
MINCP stocks - Bearish MINCP Stocks
(MAXCP stocks are those showing Tiger Closing Power
making new highs.
This suggests heavy Professional Buying. Applying the Tiger Power Ranker's
"bullish" to the MAXCP stocks find those with heavy insider buying and
institutional accumulation. Bearish MINCP stocks show the opposite.
At this point these are extended a long ways, so - use well-tested CP trendbreaks
to close out positions. Sell S7s occur when Professionals are much more bearish
than the Public is.
2 new
highs on NASDAQ. 30 new lows on NASDAQ
3 new
highs NYSE
9 new lows on NYSE
8/16/2011 ===> See Key Peerless TigerSoft
Index Charts: Industry Groups and ETFs
DIA
SPY QQQ
DJIA-Peerless TigerDJI TigerSPY
TigerQQQ GLD
SLV Crude
ETFs' Closing Power and A/D Lines Still Rising Short-Term. MAXCP Stocks
Bullishly
Outnumber MINCP
Stocks. Continue to hold Gold.
QQQ's
rise has stalled out at the 54 resistance. Both its Opening and Closing Power
are below their falling 21-day ma.
It has almost recovered 50% of what it lost in July
and August. That is a normal
retracement amount. So, I have to advise selling it,
since it could not stay above 54.
More backing and filling between
11000 and 11500 on the DJI is likely. I would
think that the Fed will continue to
prop up the market, despite charges
of treason
by the Texas
Governor, himself a man who threatened succession in 2009. The
Fed is clearly charged with the
responsibility of preventing a financial debacle.
It was, after all, formed specifically to prevent another
1907-like financial panic.
Consider hedging. This gives
the Peerless Buys more chance to bring a better
recovery. Buying some
bullish MAXCP and selling short some bearish MINCP stocks
seems prudent, considering the
market's unusual weakness. However, the steepness of
the decline should be considered,
in part, the result of the recklessly volatile trading the
SEC now permits big brokerage
computers and hedge funds using leveraged short ETFs
and unlimited short sales on
down-ticks.
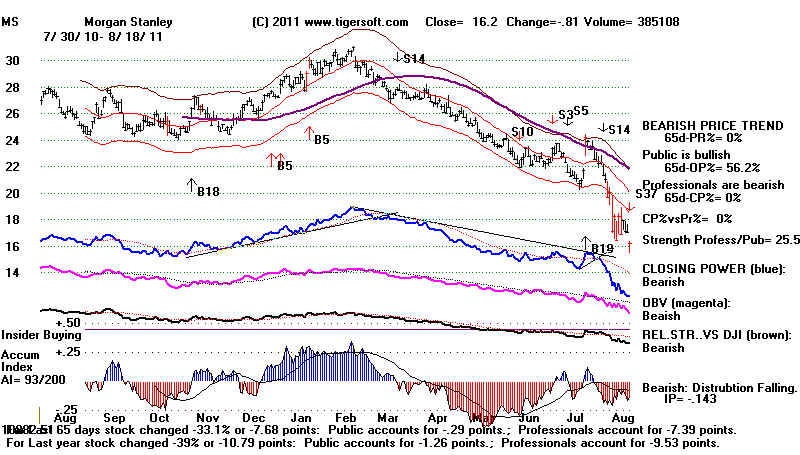
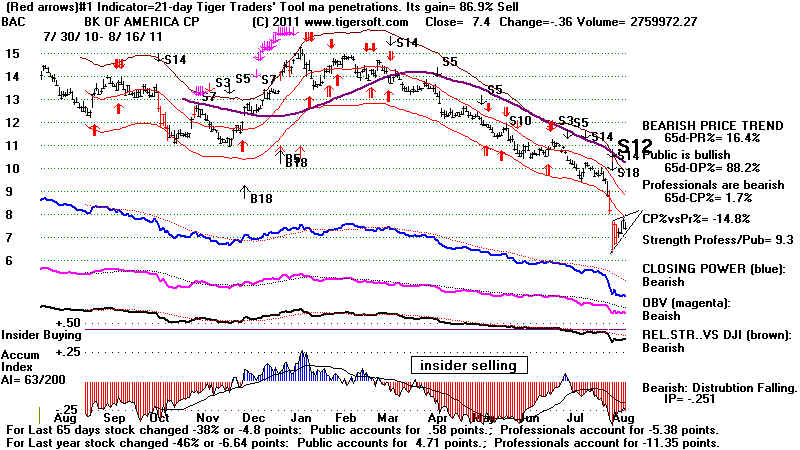
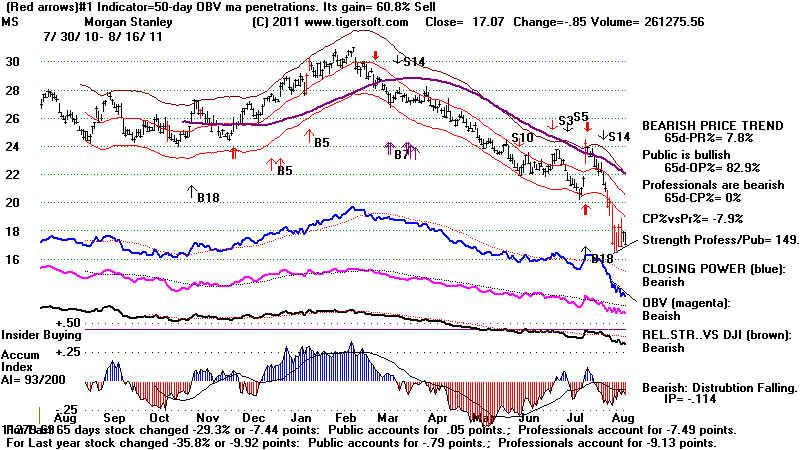
Bank stocks like BAC, C and MS
continue to look weak. Nothing has really been done
to prevent another 2008-like
debacle. This time, bailing them out will be much more
difficult politically. If
they break down now, they will again pull much of the market down
with them.
BAC's
counter-trend rally consists of a bearish rising wedge pattern that
could easily decline sharply from here.
 |
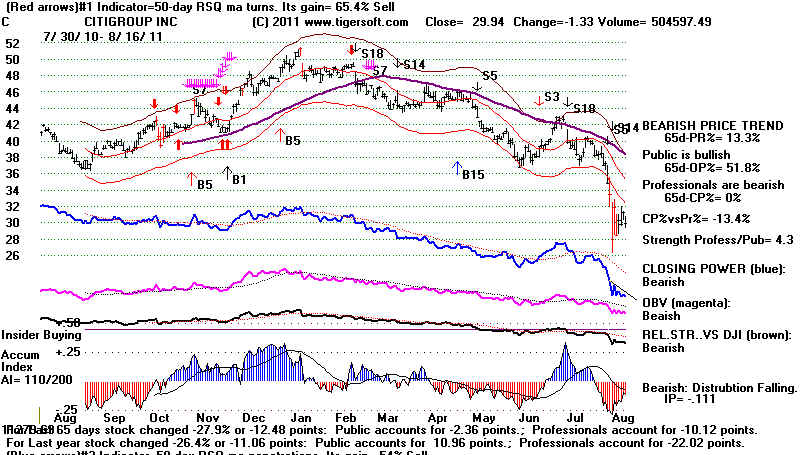
C -
Notice how the Closing Power has not turned up. It could easily breakdown.
That would be bearish.
 |
MS -
The recent Closing Power action is much weaker than prices.
 |
MacroEconomics 101
Watch what the market reacts to. I noticed that the DJI was nicely
recovering from
the early 100 point sell-off when the
news spread that the three conservative leaders of
Germany, France and the UK all together
urged a balanced budget amendment to all Euro
governments. The market knows that
this would likely turn a recession into a
depression. The stock market understands
that if we had had a balanced budget
amendment in 2008, we would now be in a
depression. When the private sector will
not create jobs, the government must to
save capitalism from itself. Google
"How FDR Saved Capitalism."
http://www.hoover.org/publications/hoover-digest/article/7076
http://www.slate.com/id/2203035/
FDR saved
capitalism – now it's Obama's turn - CSMonitor.com
Merkel,
Sarkozy propose eurozone government
Merkel, Sarkozy want balanced budget laws in all eurozone countries
On Tuesday August 16, 2011, 10:49 pm EDT
DJIA
 |
DIA
 |
SPY
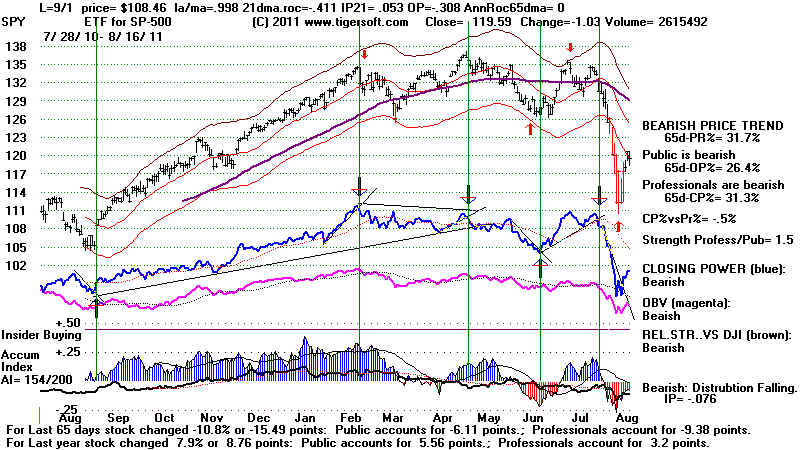
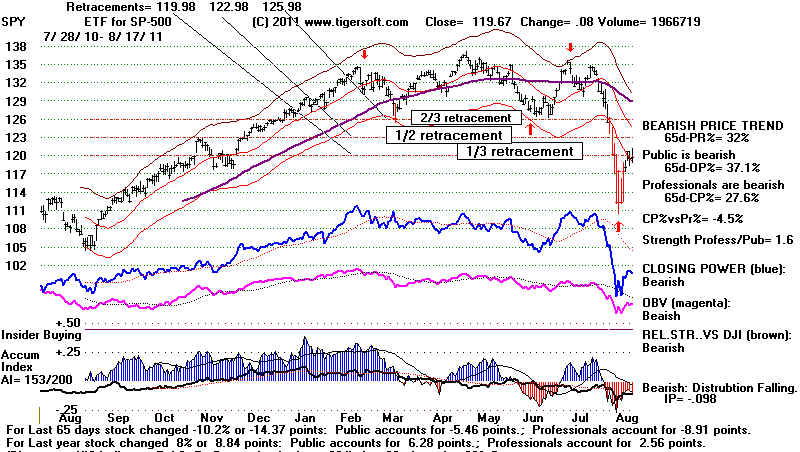
Tiger Index of SP-500 Stocks
|
QQQ
 |
===================================================================================
Older Hotlines
===================================================================================
8/15/2011
DJI = 11482.90 +214 la/ma=
.964 21-dmaROC= -.992 P = -317 (+91 ) IP21= -.089 V= - 285 OP= -.137
BREADTH STATISTICS:
69 (+31) MAXCP stocks - Bullish
MAXCP Stocks
28 (-41)
MINCP stocks - Bearish MINCP Stocks
(MAXCP stocks are those showing Tiger Closing Power
making new highs.
This suggests heavy Professional Buying. Applying the Tiger Power Ranker's
"bullish" to the MAXCP stocks find those with heavy insider buying and
institutional accumulation. Bearish MINCP stocks show the opposite.
At this point these are extended a long ways, so - use well-tested CP trendbreaks
to close out positions. Sell S7s occur when Professionals are much more bearish
than the Public is.
8 new
highs on NASDAQ. 17 new lows on NASDAQ
12 new
highs NYSE 4
new lows on NYSE
8/15/2011 ===> See Key Peerless TigerSoft
Index Charts: Industry Groups and ETFs
DIA
SPY QQQ
DJIA-Peerless TigerDJI TigerSPY
TigerQQQ GLD
SLV Crude
ETFs' Closing Power and A/D Lines Still Rising Short-Term Let's see
how the market
does after the Opening. That is the
key. Gold's Closing Power turned up.
Will the Dollar break down? A
Falling Dollar Has Usually Been Good for Stocks.
MAXCPs outnumber MINCPs: Pros are
more bullish than bearish. But the
Momentum ( 21-dmaROC) is still
steeply falling and that usually means basing
is needed. DJI: 11000 is
expected to be support. The 11500 resistance has
almost been reached..
A new B14 was added to the series of
buy signals this reversal has produced. Usually,
the more Peerless Buy signals, the more
bullish the situation. The Buy B14 occurred
because the ratio of NYSE up volume to
down volume was so high today, 1963.9 to 39.9.
Buy B14s after a sharp decline in 2007
three times signalled buying had returned sufficiently
to bring a recovery to the previous highs
or upper band, though some backing and filling
was needed.
Rate of the Decline (Tiger's AROC)
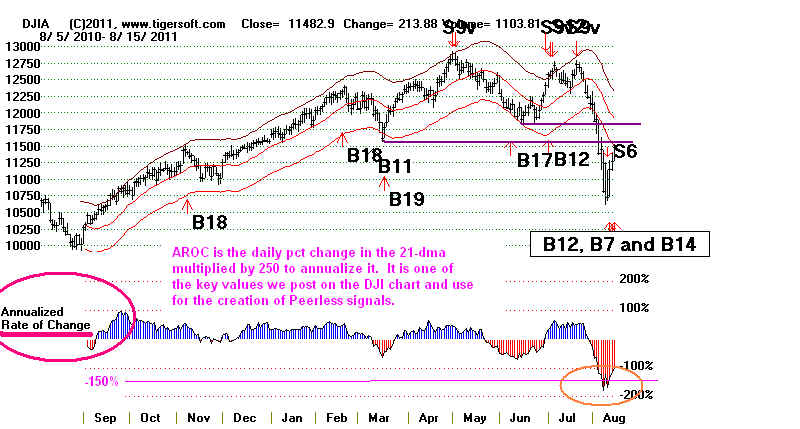
The speed of the decline remains a
technical problem. Tthe Annualized Rate of Change
(AROC) of the 21-dma did not drop below
-1.0 in 2007 when the B14 produced rallies..
This year it reached -1.7 and now stands
at -1.0. From Sept-2008 to March 2009, one
of the warning signs then that we
mentioned on the Hotline was that the AROC fell
below -1.5. It takes a very big
decline to drop it down so much. A history of the 13
occurrences since 1929 of the AROC
dropping below -1.5 shows that it would have
been best to sell at this point in 11
cases. Only in 2 cases did this drop bring a rally
without a significantly deeper decline.
See my Tiger non-Public Blog of 8/15/2011,
Momentum's Tpping Point:
When Does A Correction become A Bear Market.
Look next at the 2007 chart with 3 good
short-term Buy B14s. It will be asking a lot of
the market to reach our upper band, but a
move by the DJIA back to the resistance of
the falling 21-day ma is not out of the
question. More likely we will see the DJI tag the
broken support of the March lows just
above 11500 and then fall back to re-test 11000.
At this writing the DJIA futures are down
69. Only a minor pullback is expected,
as long
as the QQQ Closing Power uptrend is
intact. Take QQQ trading profits if its Closing
uptrend is broken.
Buy B14s in 2007 Brought
Recoveries to Upper Band.
Current PEERLESS
Signals and DJIA
|
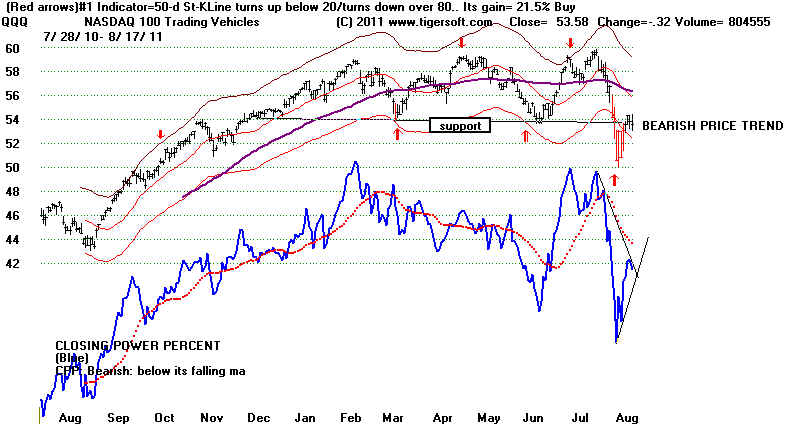
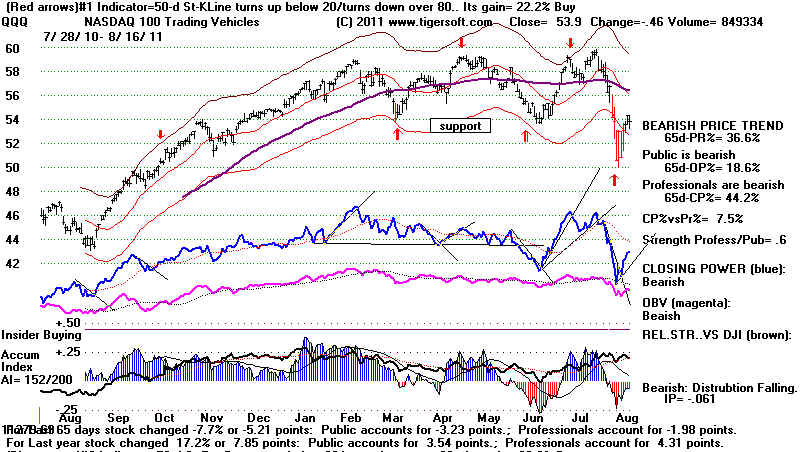
A Warning from the NASDAQ
We do want to see the NASDAQ do better.
Though it was up 47.21, and that seems
very good for the NASDAQ, the DJI rose
214, relatively more. When the Tiger's chart
of the NASDAQ is graphed, we see our
"NASDJI" relative strength indicator. it has
turned (red) negative. This is a warning
that traders again favor safety and dividends
to the unsure prospects speculative
gains. The NASDJI turning negative on a rallyh
usually means the rally has definite
limits. For now, the NASDAQ-100's (QQQ) blue
CLosing Power is still rising. So,
is its brown Relative Strength Quotient (RSQ).
3 Straight Up Days
What was most impressive was the QQQ got
back above 54, the broken support level.
It needs tomorrow to stay above 54 to
keep the good 3-day rally alive. Many short-term
traders take profits after 3 straight
up-days. Our program shows that the QQQ was up
61.9% of the times for an average 3-day
gain of 0.4% on the fourth day after three straight
up days. This is for the 21
occurrences in the last year.
( Peercomm + Charts-2011 + Daily Stocks + QQQ + Operations + Streaking Daily Probabilities
)
The same statistics for each year since 1999 show too much variability to generalize
except to say that a low percentage up on
the 4th day after 3 consecutive-day rallies,
as was seen in 2008, is a sure sign of a
bear market. A pronounced pattern (72.2%)
in which the 4th day is UP after 3
straight up-days was a key bullish attribute of the 2009
bull market.
After 3 Up Days
After 3 Down Days
QQQ
Pct of time
Avg 3-day
Pct of time
Avg 3-day
Year
4th day is Up
Gain after 3 days up 4th day is Down Gain after 4 days down
--------
-------------------
------------------------------
------------------------ ----------------------------------
1999
50.0%
+0.4%
25.0%
+1.6%
2000
62.5%
-0.9%
36.9%
+0.1%
2001
52.9%
-0.6%
33.3%
+1.0%
2002
42.9%
-0.9%
55.0%
+0.5%
2003
47.1%
+0.8%
62.5%
+1.0%
2004
38.9%
0.0%
60.0%
+0.5%
2005
43.8%
+0.3%
38.5%
+0.1
2006
41.2%
-0.2%
63.6%
-0.8%
2007
64.0%
0.0
20.0%
+1.4%
2008
33.3%
-1.9%
35.0%
-0.4%
2009
72.2%
+1.0%
22.2%
+2.1%
2010
55.0%
+0.3%
50.0%
+1.0%
2010-2011
61.9%
+0.4%
41.2%
+0.9%
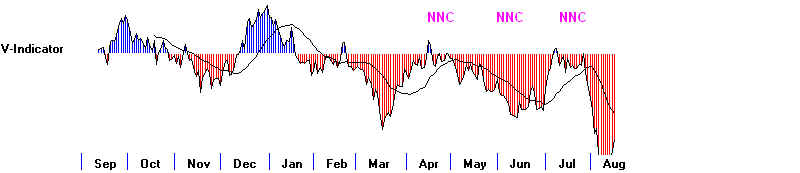
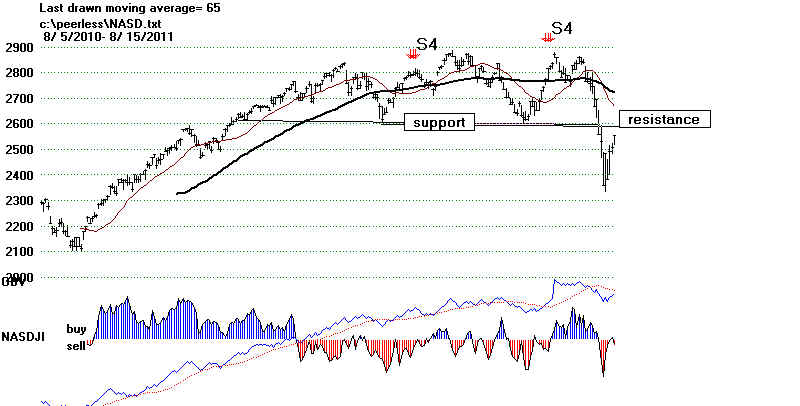
NASDAQ - The S4s are automatic. They show a negative
non-confirmation (NNC) by the
Accum. Index and NASDJI Relative Strength
Indicator on a rally 3% over the 21-dma.
The NASDAQ, unlike the QQQ, has not been
able to get past the broken support
at 2600. Watch to see if it can.
That would be very constructive. On the other hand,
a reversal back down from it, would
suggest a need to re-test the lows.
 |
QQQ
 |
Our Solar Stock Speculation - RSOL
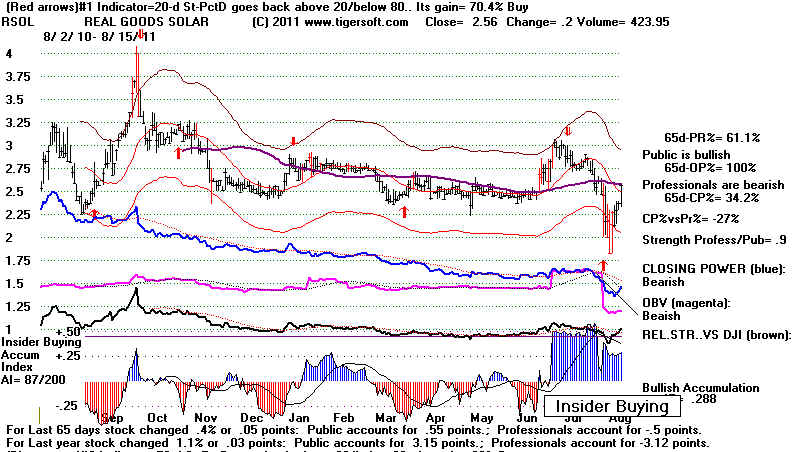 |
====================================================================================
OLDER HOTLINES
====================================================================================
8/12/2011
DJI = 11269 +126 la/ma= .942 21-dmaROC= -1.158 P = -408 (+124 ) IP21=
-.106 V= - 324 OP= -.144
BREADTH STATISTICS:
38 (-20) MAXCP
stocks - Bullish MAXCP Stocks
59 (-70) MINCP stocks
- Bearish MINCP Stocks
(MAXCP stocks are those showing Tiger Closing Power
making new highs.
This suggests heavy Professional Buying. Applying the Tiger Power Ranker's
"bullish" to the MAXCP stocks find those with heavy insider buying and
institutional accumulation. Bearish MINCP stocks show the opposite.
At this point these are extended a long ways, so - use well-tested CP trendbreaks
to close out positions. Sell S7s occur when Professionals are much more bearish
than the Public is.
2 new
highs on NASDAQ. 20 new
lows on NASDAQ
6 new
highs NYSE
19 new lows on NYSE
8/12/2011
===> See Key Peerless TigerSoft
Index Charts: Industry Groups and ETFs
DIA SPY QQQ DJIA-Peerless TigerDJI
TigerSPY TigerQQQ GLD
SLV Crude
While the QQQ Closing Power is Rising, Nimble Traders Should Be In QQQ Long.
However, another test by the DJI of its lows is likely.
Be sure to cover short sales when their Closing Power downtrends are broken.
High Accumulation High Caps are apt to be the best upside performers.
Bears, be careful here. This Summer we have still not seen a serious NYSE A/D
Line bearish divergence from the DJI. Usually such bearish A./D divergences
and our normal Sell S9s occur just before big declines of 20% or more since 1929.
New Buy B7. Again we get a
hard-to-believe buy signal right after this sharp 15%
decline in the DJI. It is based on
the idea that we should be buyers on the next decline
to the lower band after a Buy B12.
Unlike the Buy B12 and Buy B14 (which I dismissed).
the earlier Buy B7s have previously
occurred as far below the lower band as we are now
and with as much downward momentum.
Here are cases with the DJI
Date of B7 DJI
Gain Reversing
Sell Date DJI
Short Gain
---------------- ------- ------------
---------------------- ------------- ---------
-----------------
10/23/1933 88.1
+12.3%
Sell S12
12/1/1933 98.9
1.7%
la/ma ann.roc P-I
IP21 V-I Opct
.934 -1.193 -103 (56) -.12 -370
-.086
No Paper Loss
DJI rallied to resistance of neckline in overhead head and shoulders, fell back to
a second Buy B7 anf then rose past upper band.
------------------------------------------------------------------------------------------------------------
12/11/74 595.35 +42.0%
Sell S9
8/29/75
845.34
la/ma
ann.roc P-I
IP21 V-I Opct
.933 -1.75
-314 (-29) -.238
-4
-.397
DJI rose immediately and then
rallied strongly. Note how low the P-Indicator
was in this instance.
------------------------------------------------------------------------------------------------------------
8/11/11 11269
+126
la/ma ann.roc P-I
IP21 V-I Opct
.942 -1.158 -408 (+124
-.106 - 324 -.144
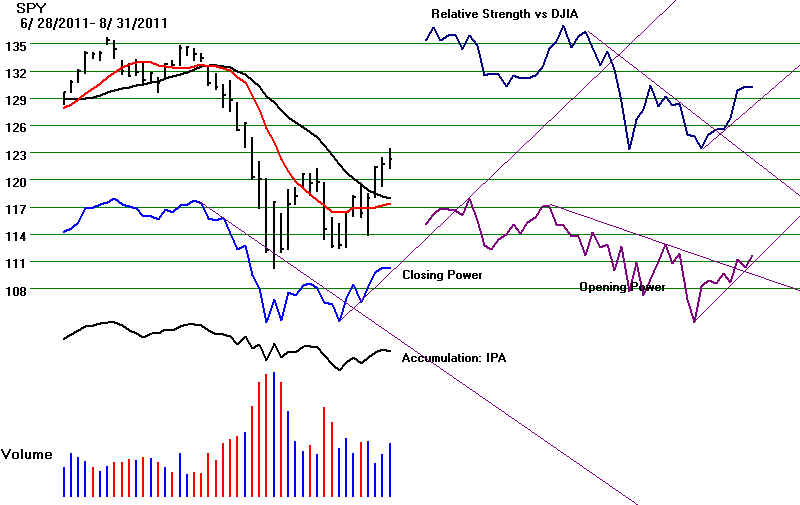
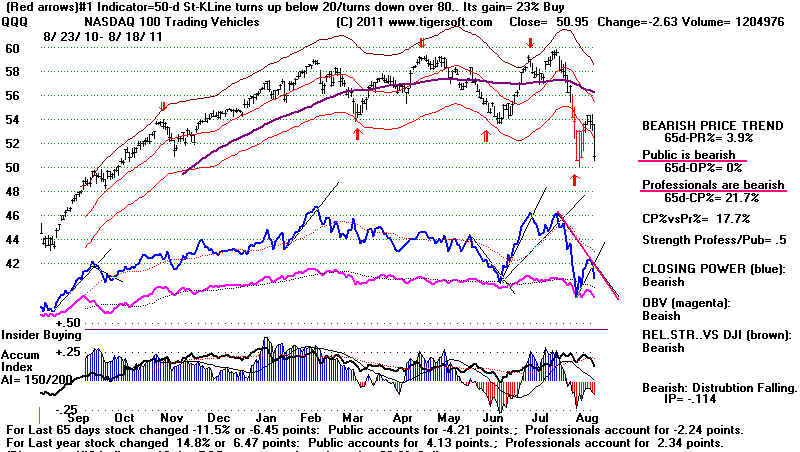
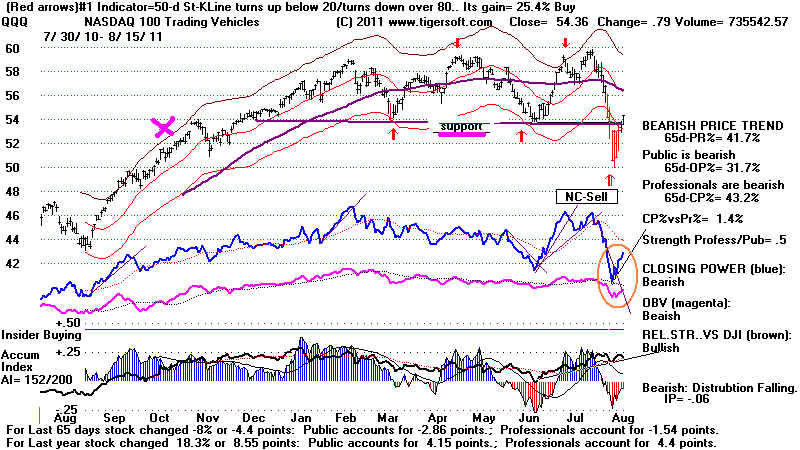
The QQQ
(53.57) is the leader of the 3 key general market ETFs. Its QQQ/DJI (brown)
Relative Strength Line is rising,
If it can surpass 54 on a closing basis, I would remain
short-term bullish and stay long any QQQ
trading position. But if the QQQ falters
on Monday or Tuesday and fails to get
past 54, expect the QQQ's Closing Power
uptrend to be broken. That will be a
short-term Sell.
More Tests for a Bottom Are Usually Needed
Have we seen a bottom? We might
want to look at how the DJI bottomed after the 10%-
15% mini crashes of October
1978, October 1979, March 1980, Janaury 1990, October 1997
and January 2000.
These 10%-12%declines would probably have been a more rapid
15% free-fall, If the easy-to use
leveraged short selling ETfs had been present then along
with the right to sell short on
down-ticks, as is legal now. Note that the 1978 bottom
required four tests of 790 level before a
rally, the 1979 bottom needed 3 tests of 800,
the 1980 bottom had to have 3 tests of
760 as did the March 2000 bottom of 10000. Even
the Jan-Feb 1990 10% decline needed a
second test of 2550 a month after the initial
plunge, before the DJI could resume its
advance.
October 1997's bottom did see a
rapid spring-back upwards all the way to the declining 21-day
ma. The Accumulation Index hardly
went negative in the 1997 decline, unlike now. There
were multiple Peerless buy signals and
the Closing Power for the 1997-SPY reversed itself
dramatically. This time around the SPY's CLosing Power is rising, but not nearly so
quickly as in October 1997.
I have warned that most often after such
a steep sell-off, notably 1940, 1950, 1990 and 1998,
the DJI
retests the first set of lows and even breaks below them. So, until the QQQ gets
back above 54, more new lows is a scary
scenario we cannot afford to dismiss
even with the new Peerless Buys.
The jury is still out. Except for nimble traders,
I have suggested mostly waiting on the
sideline is the prudent thing to do. A close by the
QQQ above 54 would help remove the
bearish scenario of 1940, 1950, 1990 and 1998.
A retest of the lows would still seem
likely though before a rally back above the 65-day
ma is likely.
But for now, rallies are under way to the
points of breakdown for the DIA and SPY.
The QQQ has already reached the
resistance created by the June low at 54. A further
move up by the QQQ past this resistance
will be bullish, but a turn down on Monday
by it, will bring new selling by
chartists. Mondays this past year have been the most
bearish day of the week. Since
1965, the DJI has risen only 46.7% of the time in the
week after August 13th (next Sunday), but
over the next two weeks it has risen 55.6%
of the time. (Peercomm + Charts-2011 + Runs/Setups + DJI Future
based on past Seasonality + 8 + 13 ).
I would say that the seasonality and the
charts favor a pullback and quite possiblu a
a new low. If the lows hold,
a the suprise move might be to the upside.
QQQ
7/28/2010 - 8/12/2011
Avg. Daily Trading Results
(Peercomm + Charts-2011 + Daily Stocks + QQQ + Ind-3 + Day of Week Trading.Results).
Pct Up Avg Gain
Monday 48.9% -0.2%
Tuesday 51.8% +0.1%
Wednes. 61.1% +0.0%
Thurs. 61.1% -0.1%
Friday 49.0%
-0.1%
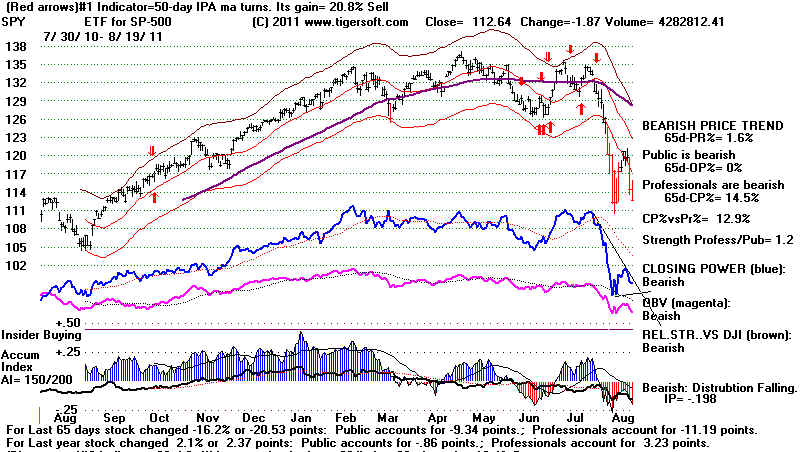
PROFESSIONALS HAVE COVERED AND ARE BUYING VERY SELECTIVELY
The Closing Powers are still rising
for the DIA, QQQ and SPY. I believe this shows
Professionals have shifted to
covering and some buying. The quick decline in the
number of MINCP stocks (those with
Closing Power at new lows) from over 1000 at the
beginning of the week to only 59
shows that they have locked in profits on their
short sales, as we have mostly.
But since the number of MAXCP stocks (showing
Closing Power new highs) is still
under 60, I would say that Professionals are
very careful in what they are
buying, if anything. And it's not hard to understand why.
Many stocks are down sharply from
their levels 6 months ago. 4 of first 9 days this
August have seen the DJI down more
than 275 points. There are too many air pockets
to invest prudently.
8/2/2011 DJI -276
8/4/2011 DJI -513
8/8/2011 DJI -634
8/10/2011 DJI -520
WHAT STOCKS SHOULD BE CONSIDERED FOR PURCHASE?
Safer blue-chip DJI and
SP-500 stocks with highest AI/200 have done the best since
the reversal upwards, over
the last 5 days. As a group, the top ones do much better than
the lowest. Some of the
lowest AI/200 stocks have bounced back, but most have
rebounded quite weakly.
Use Peercomm + Older Charting + Ranking Results +
User Set Ranking + 4 +2
SP-500 Stock AI/200
4-day Recovery Pct
--------------------- ----------
-------------------------------
COG
181
+21%
ED (utility)
176
+6%
ABC
174 +10%
BCR
174 +6%
EQT
174 +13%
|
...
TGT
50
+4%
WFR
50
+31% (shows why we cover when Closing
Power breaks its downtrend.
BBY
41
+2%
MBI
40
+2%
YHOO
37
+22% (shows why we cover when Closing
Power breaks its downtrend.)
DJI Stock
AI/200 4-day Recovery Pct
--------------------- ----------
-------------------------------
CVX
165 (#1) +6%
Below
from the highest Accumulation stocks (ACCUMHOR in our data base)
are
the stocks whose Closing Power is zig-zagging up in the manner of the
QQQ.
Using the CP uptrendline as a point of reversal makes these stocks
more
appealing as long trades now.
SPECULATIVE SOLAR STOCK SHOWING INSIDER BUYING
The White House is promoting solar energy jobs through big government
loan guarantees. RSOL is the solar stock
showing the biggest recent surge
of Accumulation. It is up 29% in the last 4 trading days.
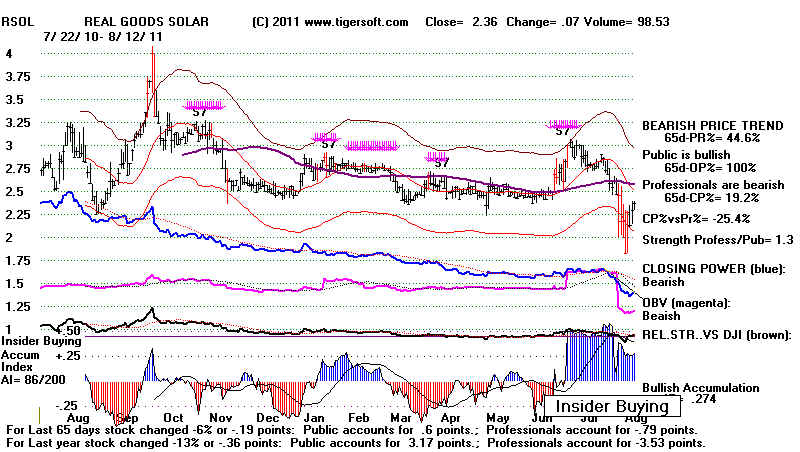
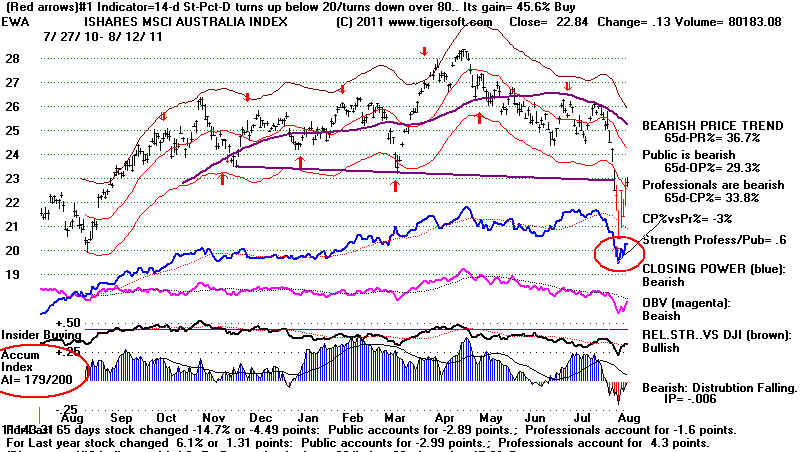 |
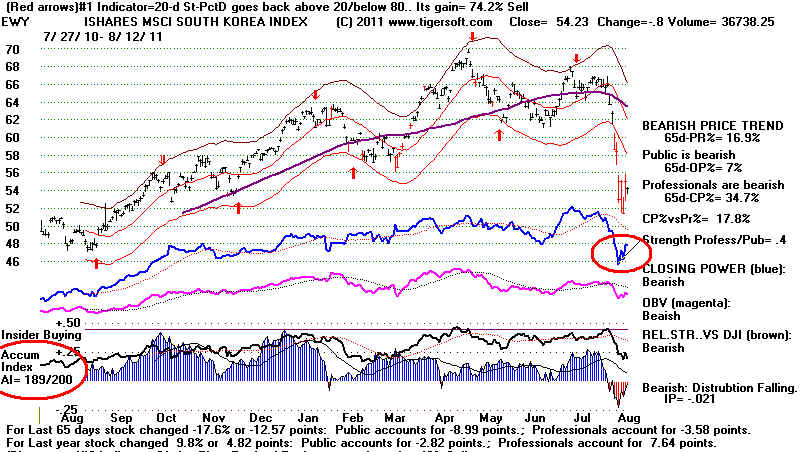 |
y
DJIA
New Buy B7 today. See below. Resistance - 11500
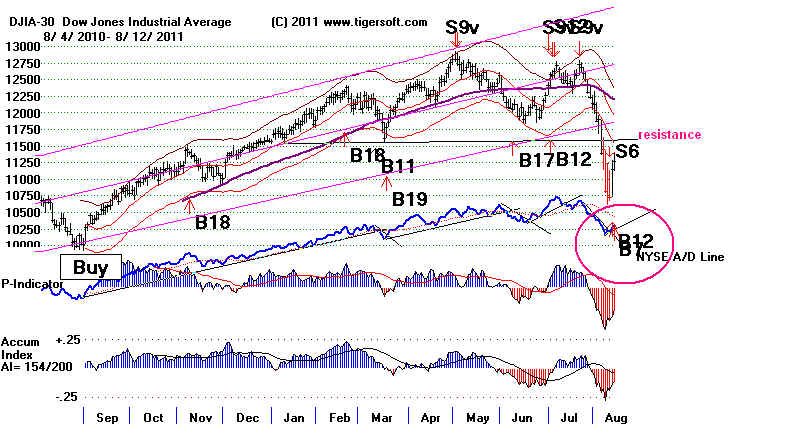 |
DIA
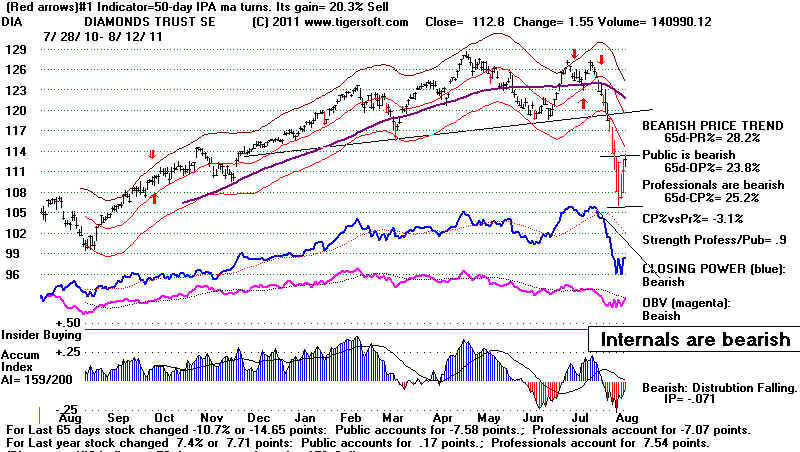 |
SPY
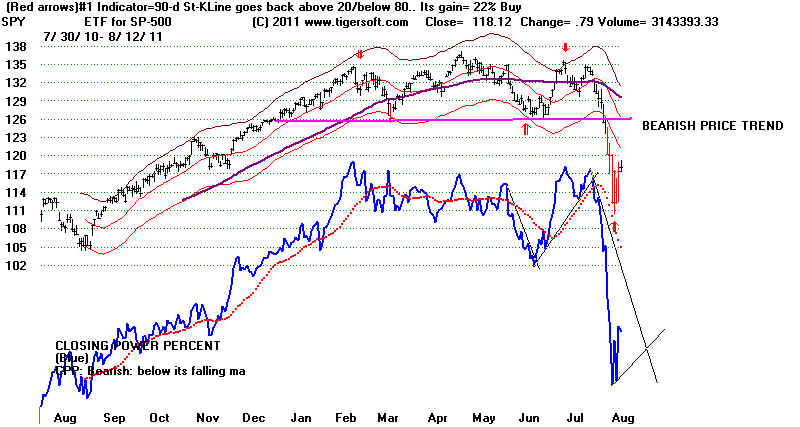 |
QQQ
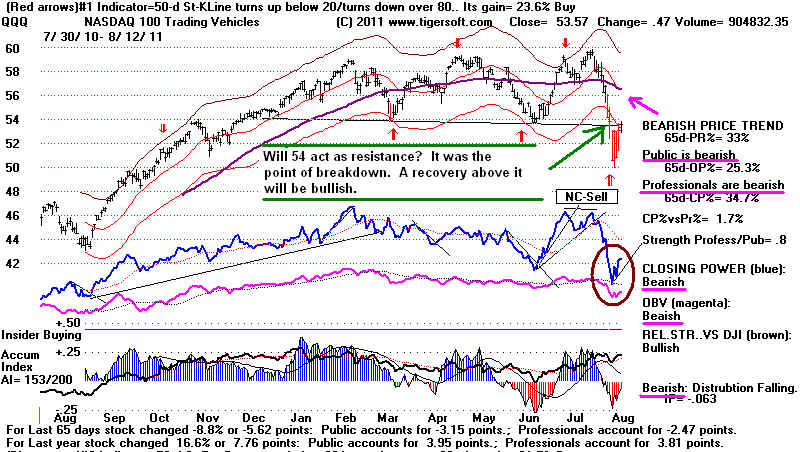 |
|
 TIGER HOTLINE
 A Guide To Profitably Using The
Tiger Nightly HOTLINE
A Guide To Profitably Using The
Tiger Nightly HOTLINE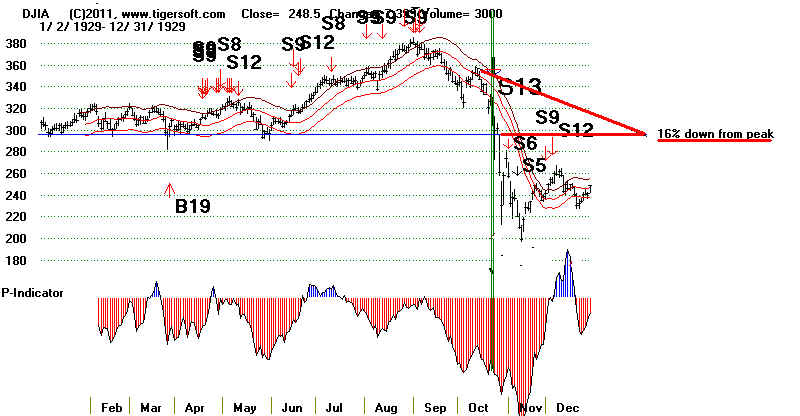
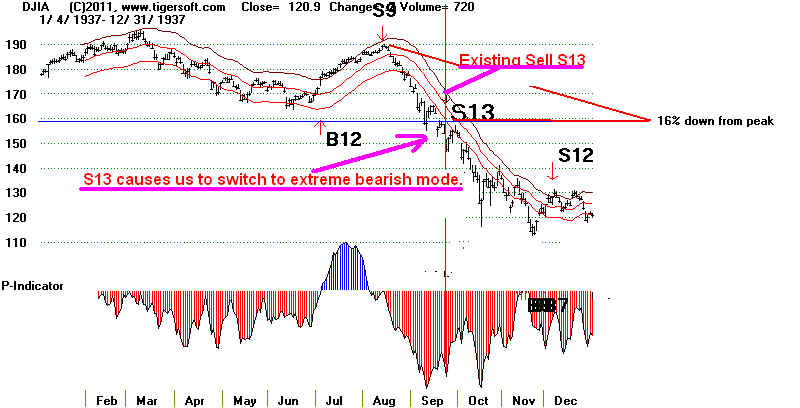
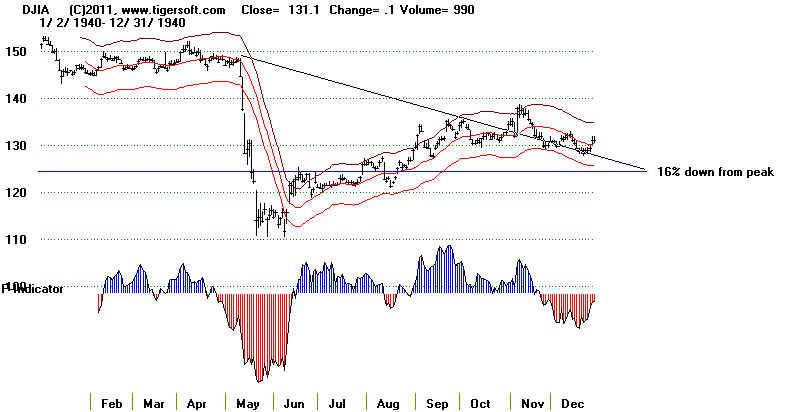
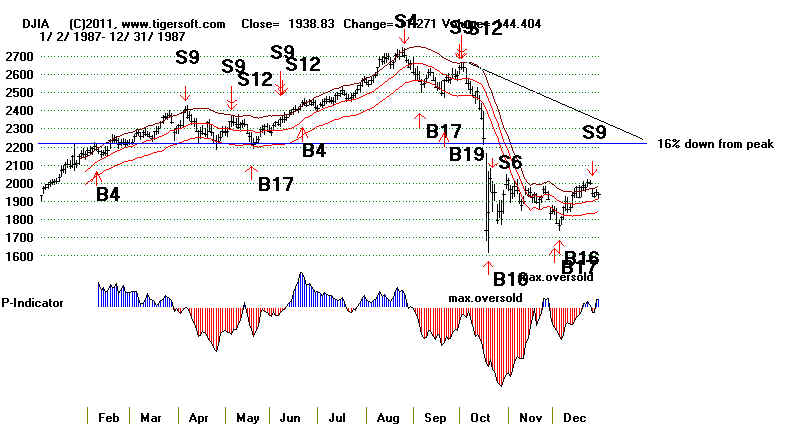
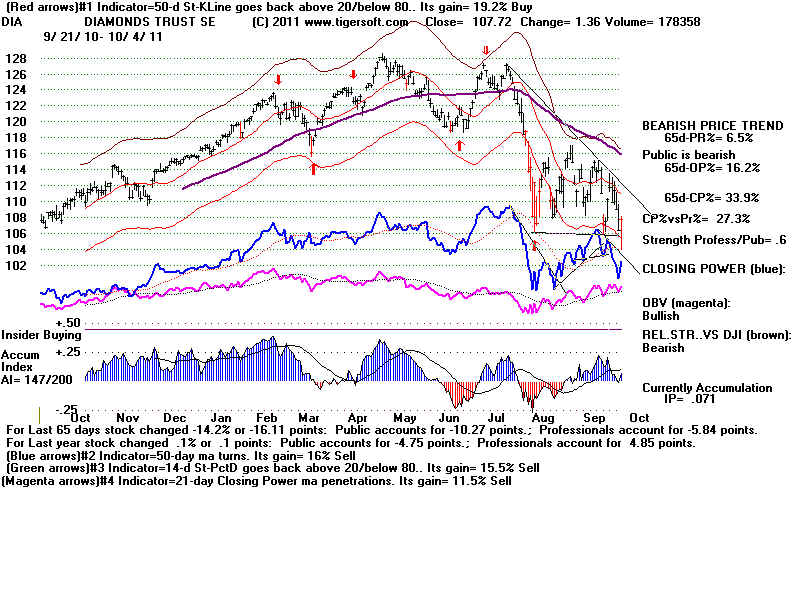
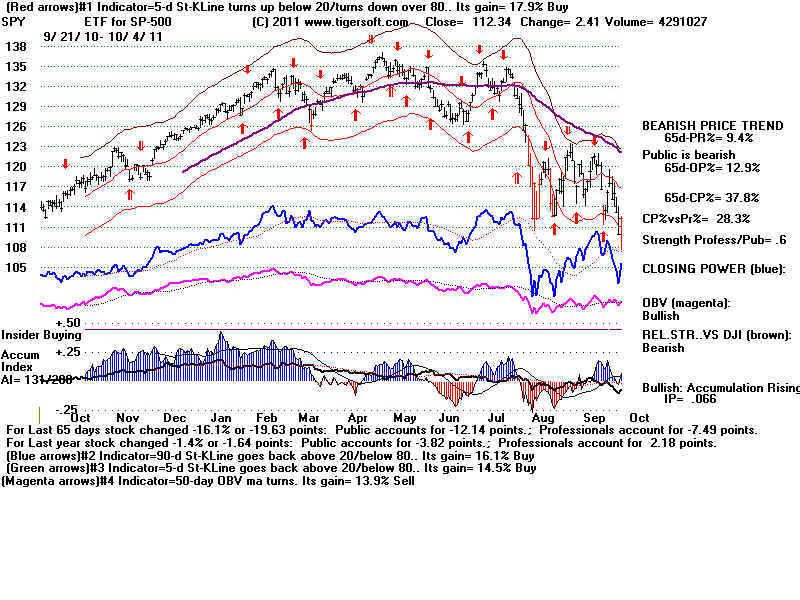
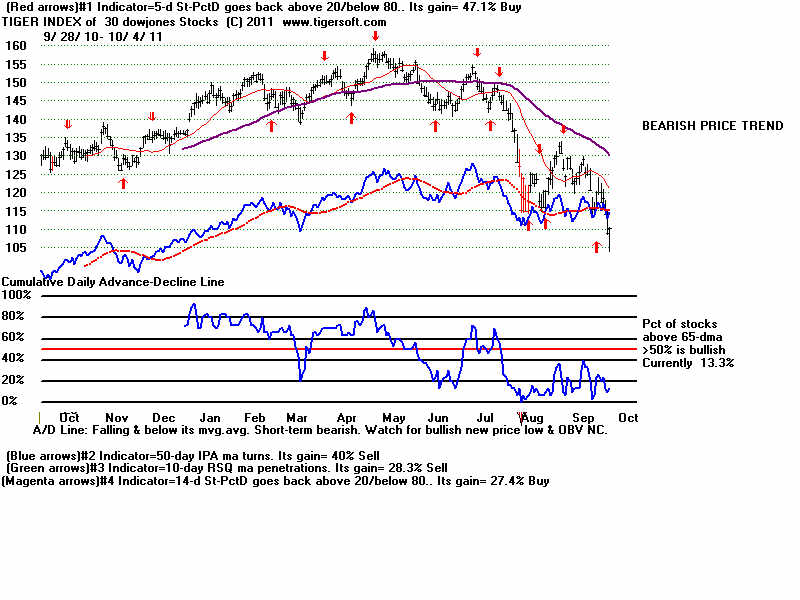
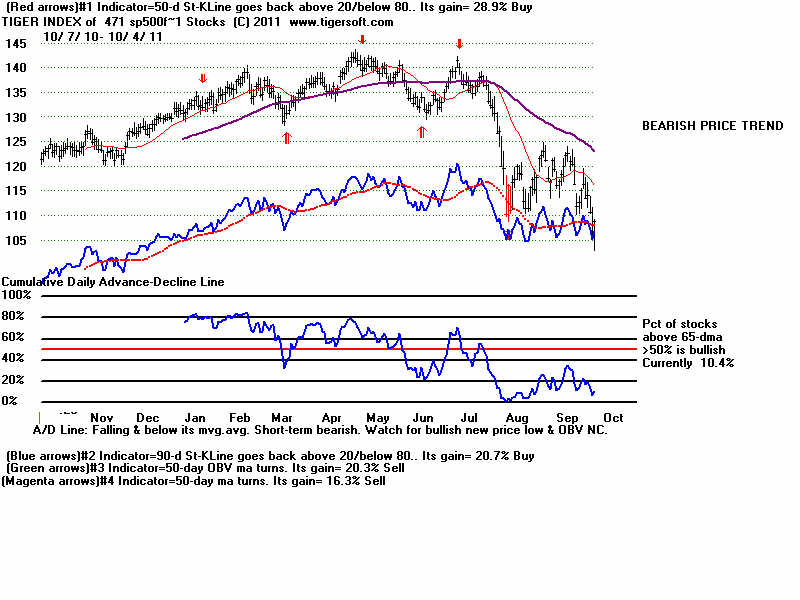
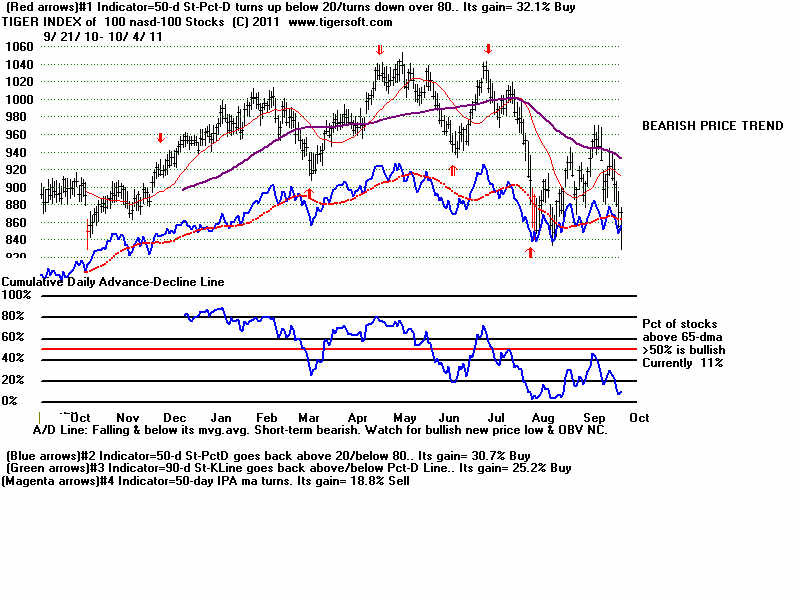
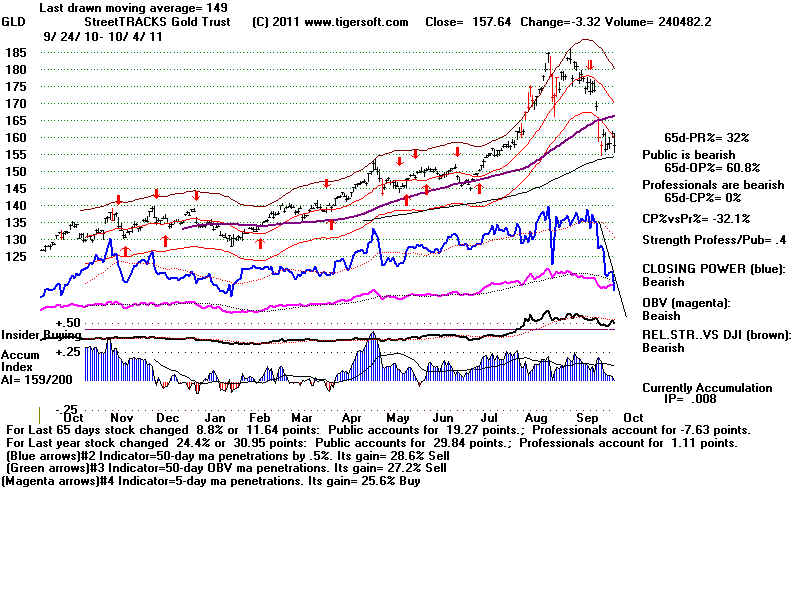
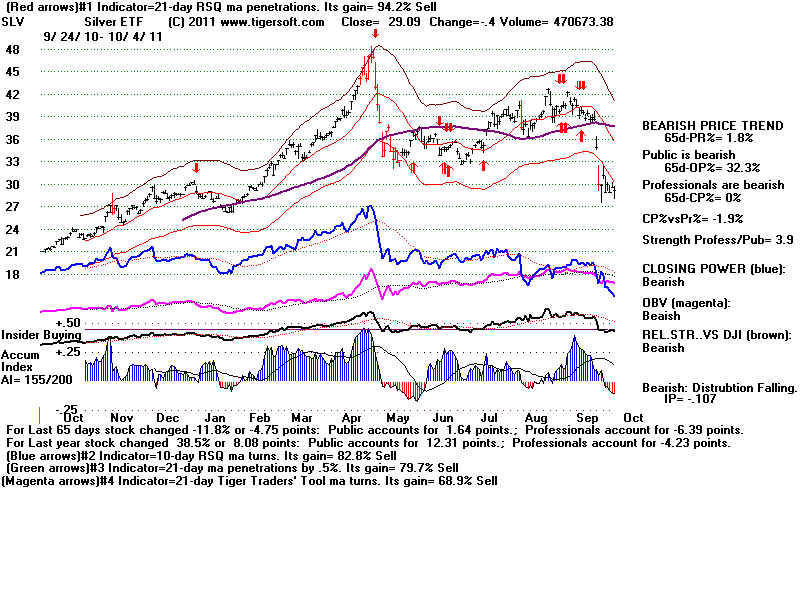
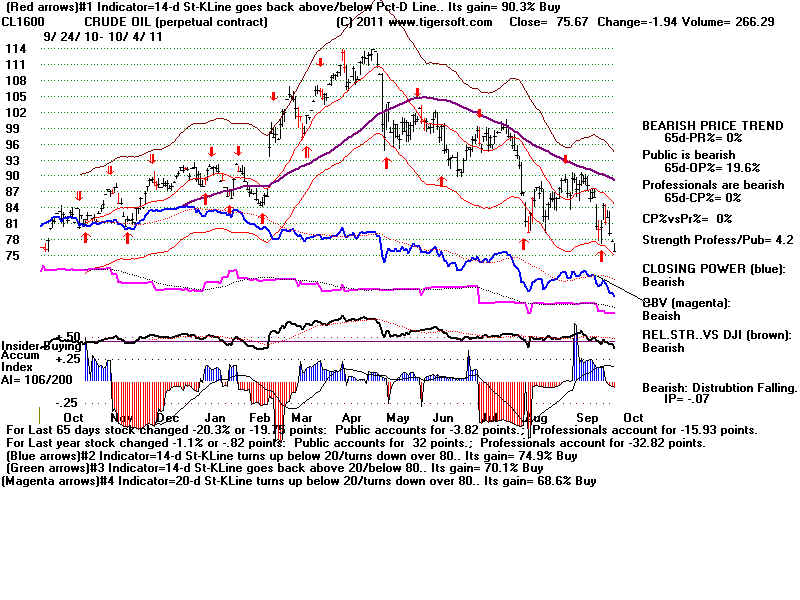
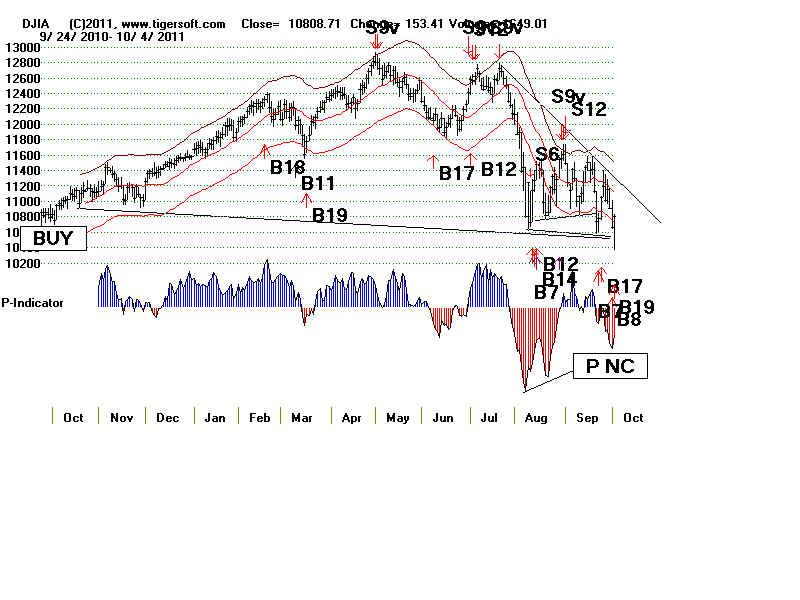
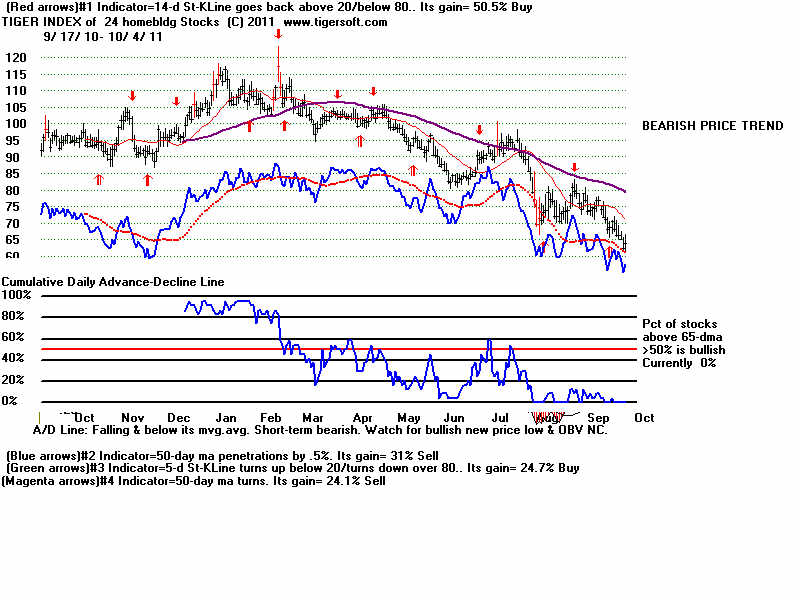
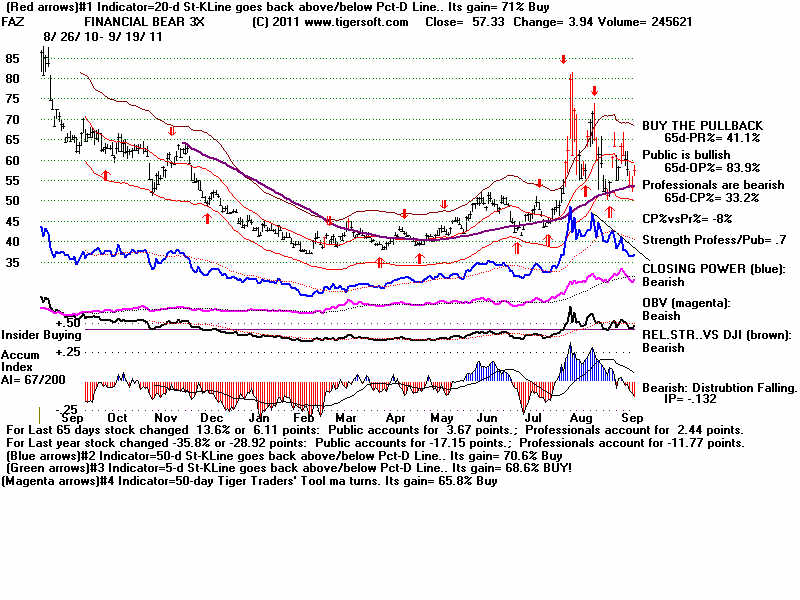
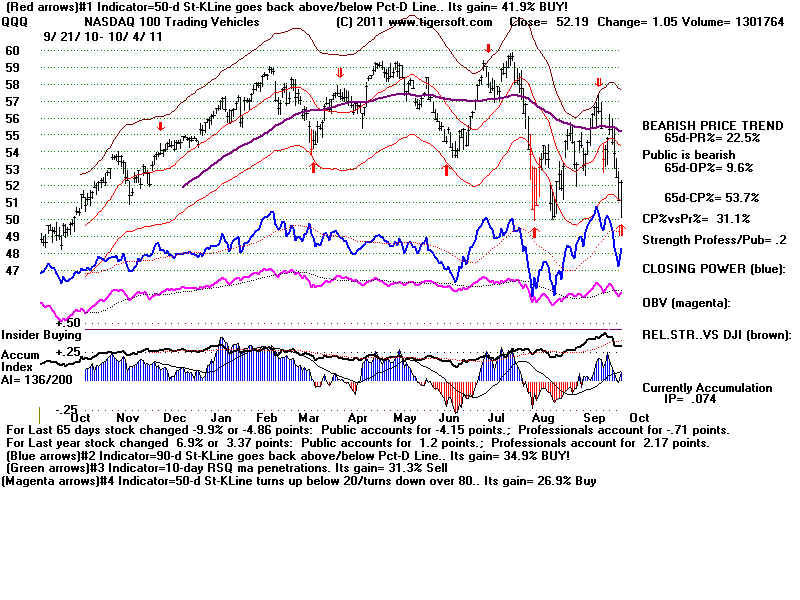
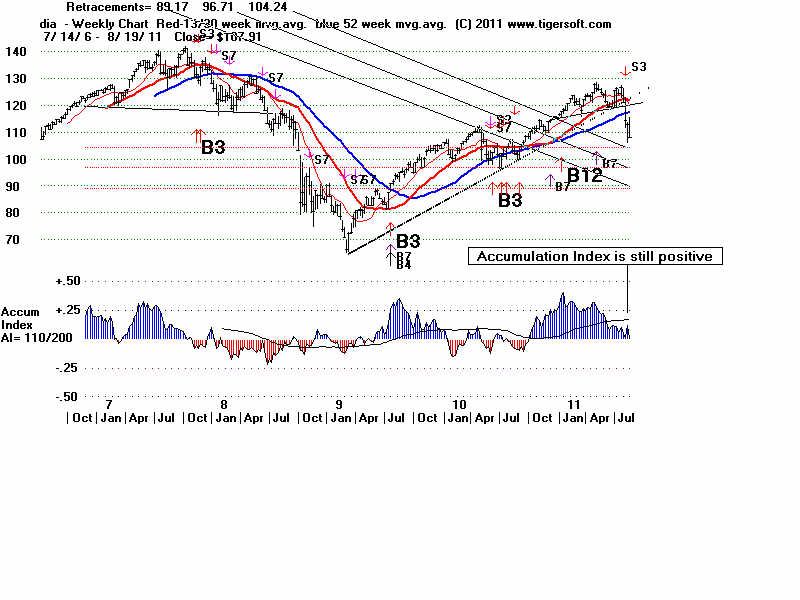
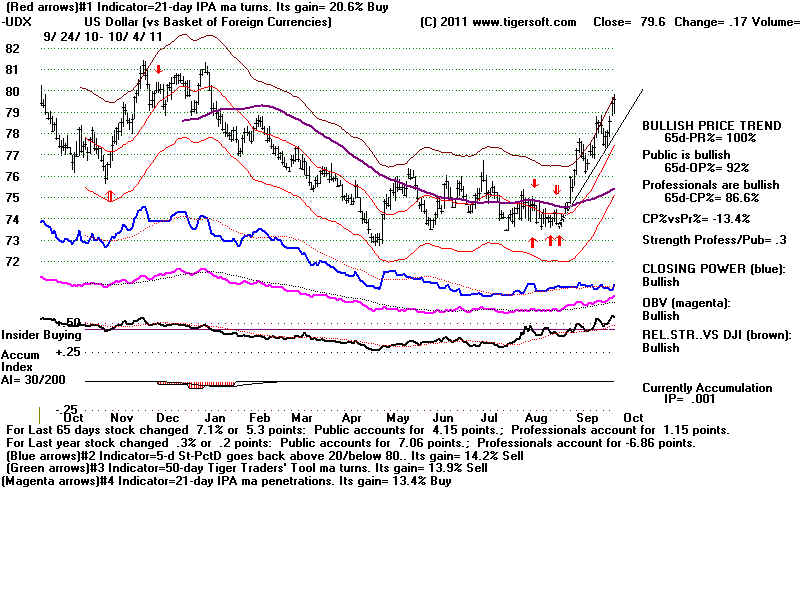
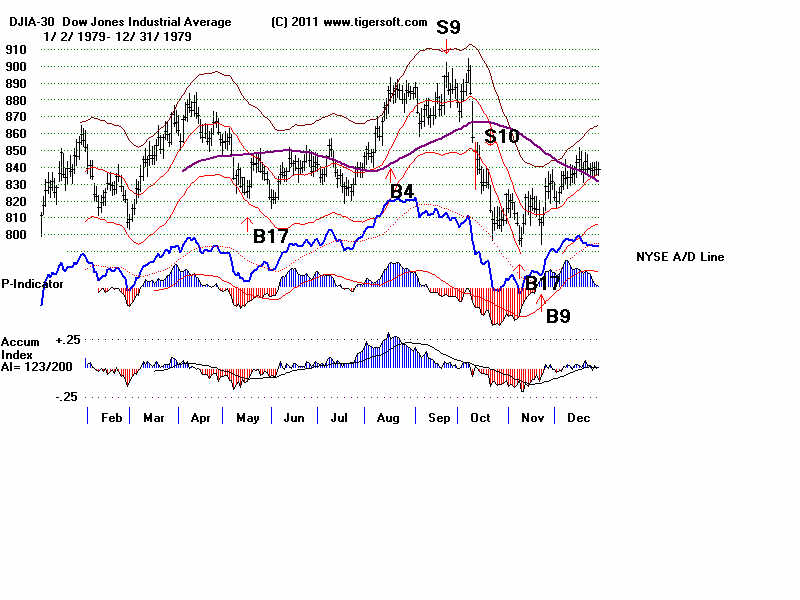
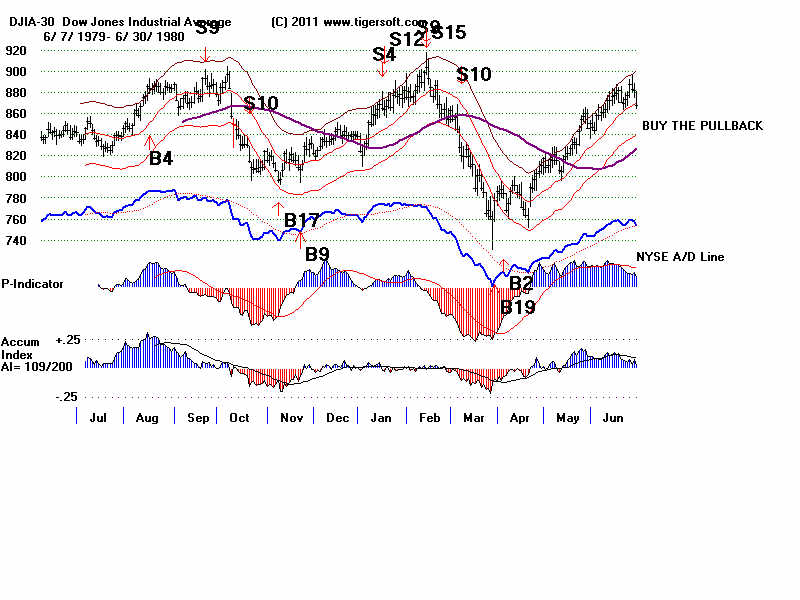
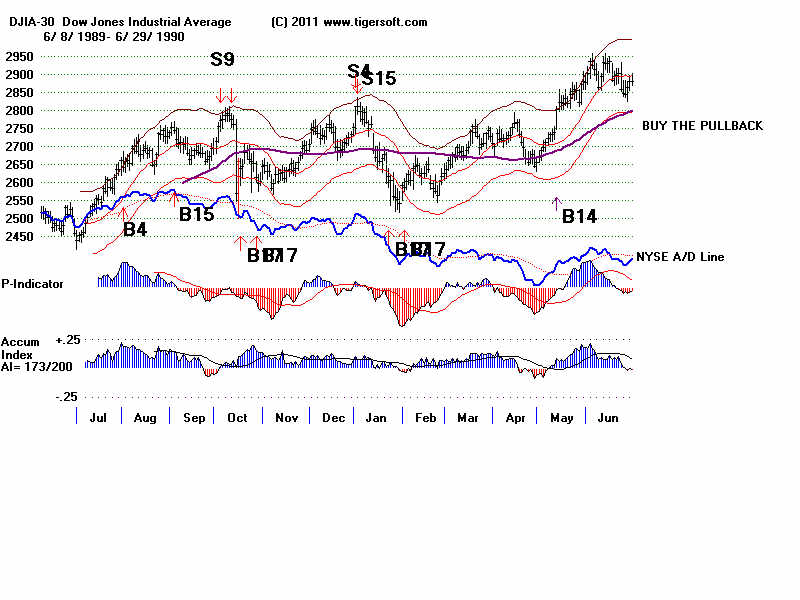
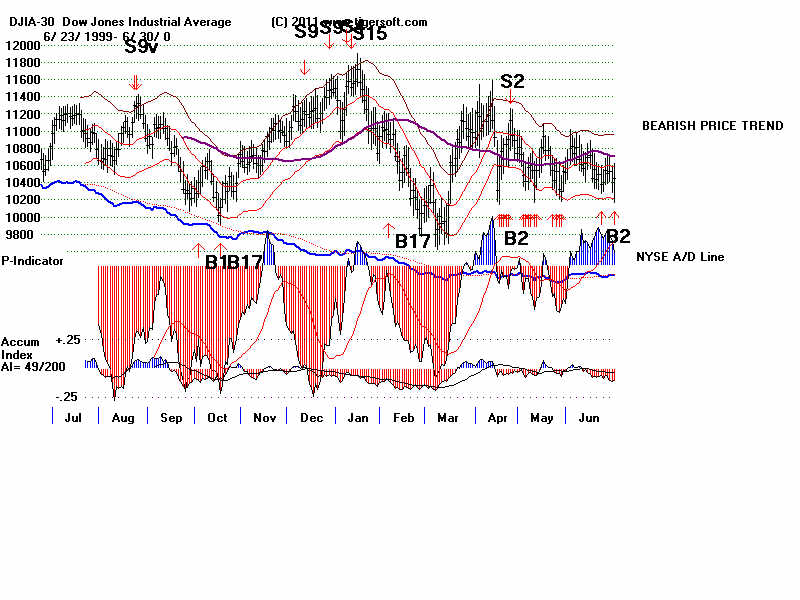
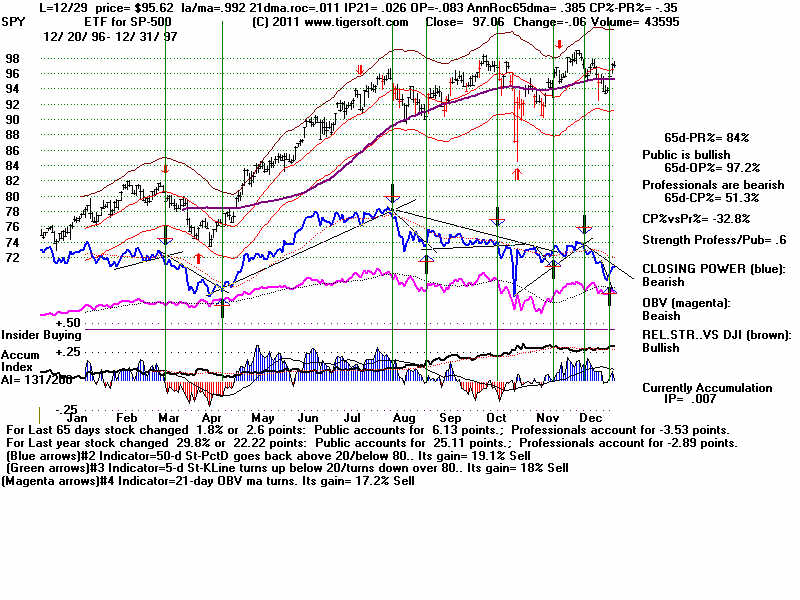
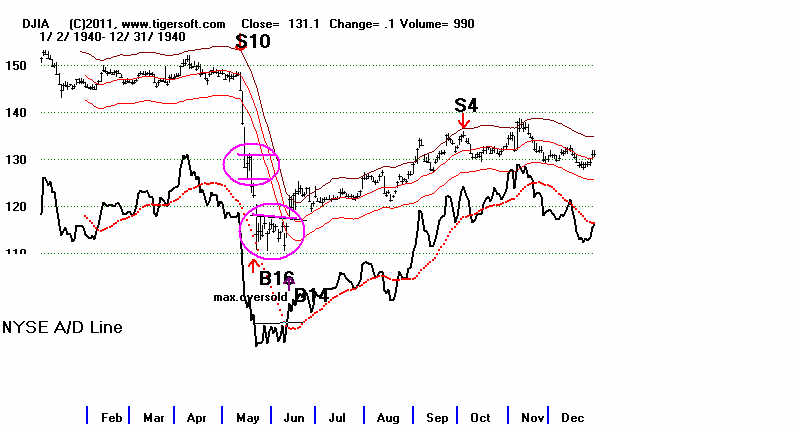
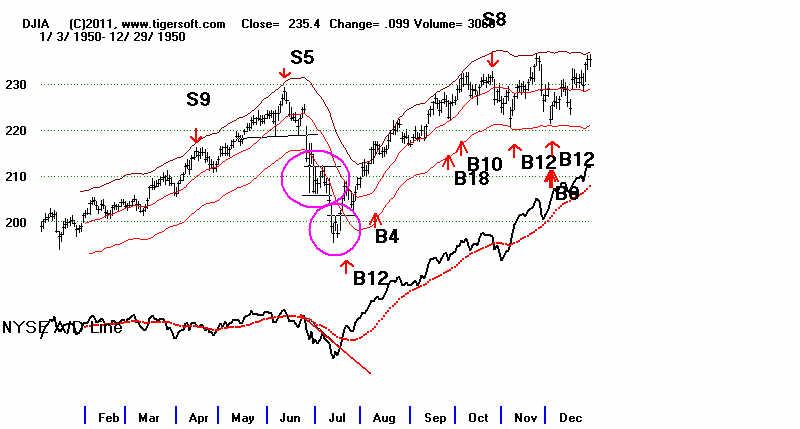
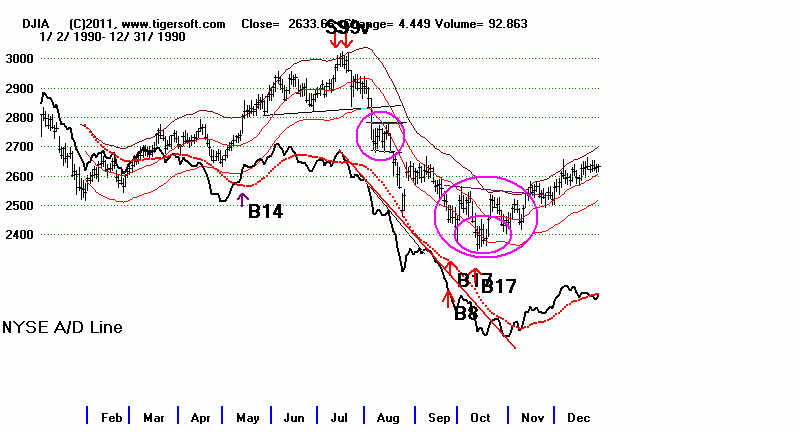
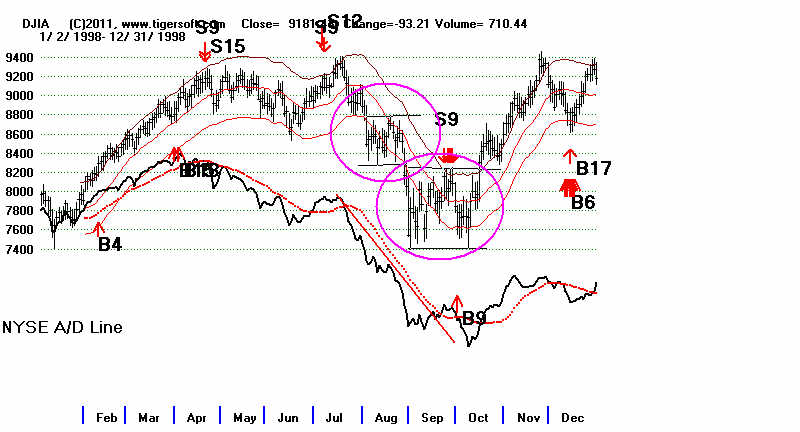