http://www.sentimentrader.com/
2) Professionals versus Public Buying/Selling
Tiger's Path to Stock Market Profits:
Predicting The
Stock Market
and Safefy Riding
the Major Trend
7/2/2011 - William Schmidt, Ph.D.
1) News Environment: Investor Sentiment: How Market Reacts
Greek General Strike, Widespread Bearishness but Market
Rallied Monday.
May 19 2011 Bearish sentiment,
expectations that stock prices will fall over the next six months, jumped 5.8 percentage
points to 41.3%. This is the highest level of pessimism since September 2, 2010. It is
also the 12th time in 13 weeks that bearish sentiment has been above its historical
average of 30%.
AAII Survey - http://wallstcheatsheet.com/trading/aaii-sentiment-survey-investor-pessimism-is-at-another-high.html/
Mutual Funds Suffer 6th Straight Week Of
Outflows (07/01/11)
http://www.sentimentrader.com/
2) Professionals versus Public Buying/Selling
3) Seasonality: June Gloom, Summer Bloom: July-August
21 trading-days after April 30 - DJI is up 47.8% of time since
1965 MAY weak
21 trading-days after May 31 - DJI is up 47.8% of time since 1965
JUNE weak
21 trading-days after June 30 - DJI is up 54.3% of time
since 1965 JULY rising
21 trading-days after July 31 - DJI is up 57.8% of
time since 1965 AUGUST strong
21 trading-days after August 31 - DJI is up
35.6% of time since 1965 September Weak
PEERLESS
4) Presidential 4 Year Cycle
---> Peerless
July and August rise more than 60% of the time and June is
Up, too
5) Chart Patterns and MA
Support/Resistance ---> Peerless
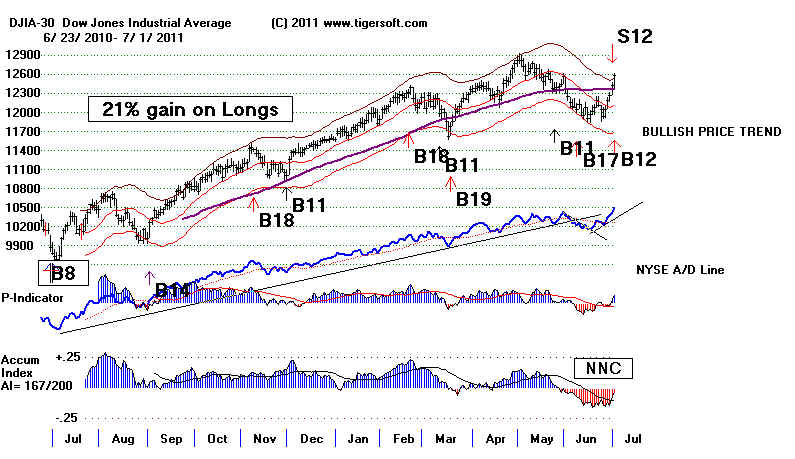
6) Peerless Buys and Sells.
7) Peerless Internal Strength
Indicators, P-I, A/D Line, IP21 (AI)
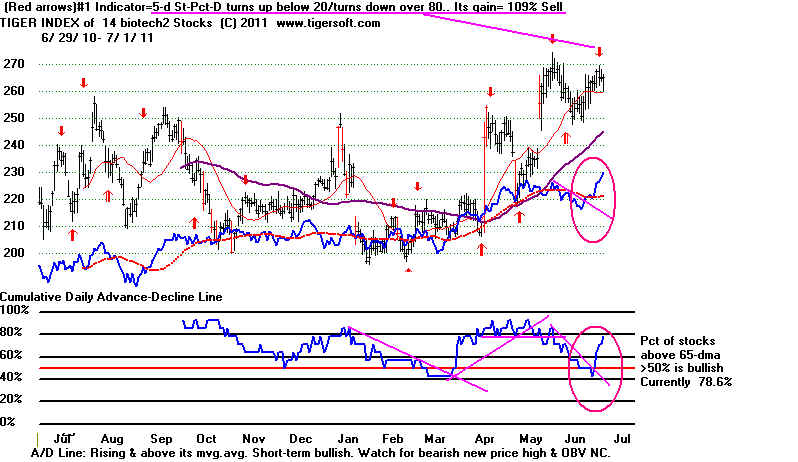
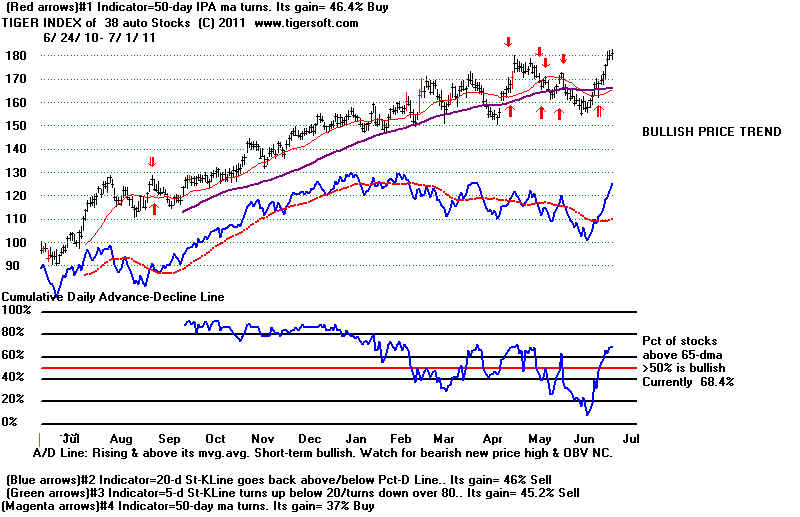
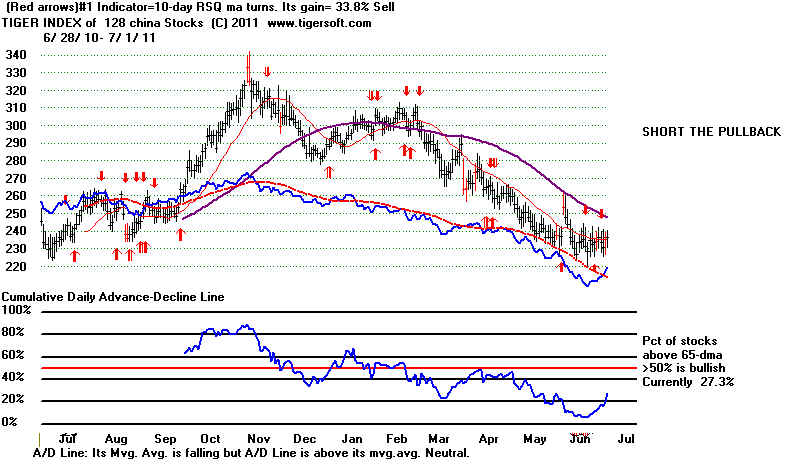
8) Industry Strength
---> Tiger
Defensive - (Biotechs) near a top
Cycle (Autos) - Bullish
Weakest China
Pct of Stocks over
65-dma - Daily Change
7/1/2011
6/27/2011
6/20/2011
6/13/2011
6/6/2011
-----------------------------------------------------------------------------------------------------------------------------------------------------------
----------------
S Bond Funds
92% +2%
90% -1%
85% +1%
88% -4%
94% +1%
B REIT Stocks
82% +5% 32% +5%
68% +13%
59% +4%
74% -4%
B DJI-30 stocks
80% +10%
13% +2%
23%
23% +3%
37% -3%
highest AI = CVX AI/200=184
B Biotech (XBI and IBB) 79% +8%
50% +7% 50%
57%
64% -4%
B Utility Stocks
76%
51% +4%
57% +8%
44% +4%
51% -8%
B Auto Stocks
68%
54%
14% +6%
19%
-3%
24%
B SP-500 stocks
66% +11%
31% +5%
31% +5%
25% +1%
31% -6%
BCR 108.67 AI/200=193 #2 LH
96.5 AI/200=191 up off 65-dma
B QQQ-100 stocks
64% +10%
33% +8%
25% +5%
28% -1%
38% -7%
B Gaming Stocks
64%
+14% 29% --7%
29% +8%
14%
36% -7%
B Industrial Materials
57% +6%
30% +9%
20% +4%
22% +1%
24% -7%
B Finance Stocks
53%
+9%
32% +8%
30% +6%
21% +7%
23% -3%
B Foreign ETFs' Stocks
53% +16% 10%+2%
3%
10% -5%
34% -16%
B Transportation Stocks
50% +9%
26% +4%
17% +1%
11% -2%
21% -7%
-----------------------------------------------------------------------------------------------------------------------------------------------------------------------------------------------
S Homebuilding Stocks 46%
9) Tiger and Tiger Power Ranker
Stock Selection
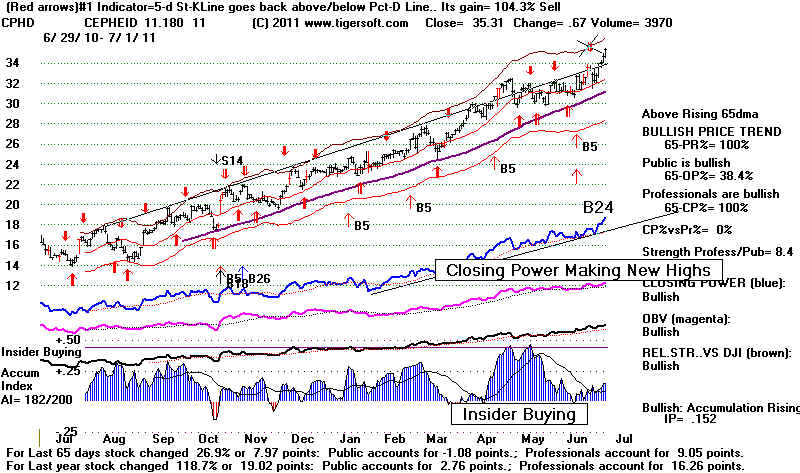
Buy Bullish MAXCPs (CP NH plus Accumulualtion) - CPHD
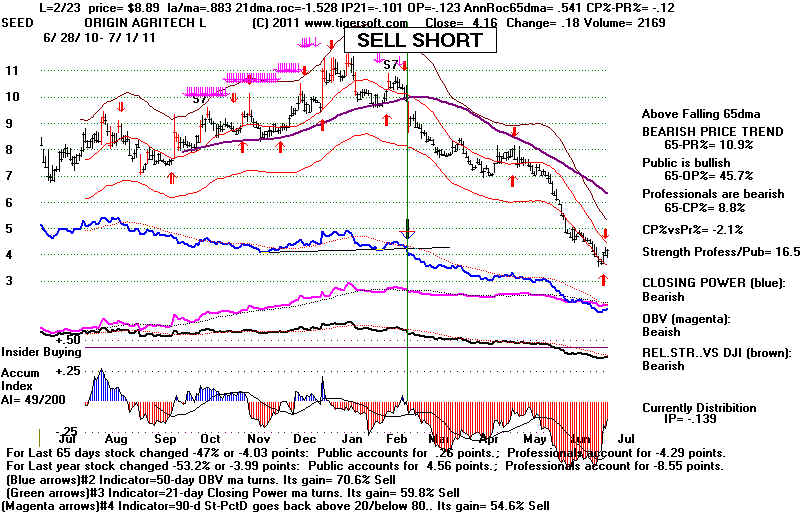
Sell Short MINCPs (CP NL plus Distribution) - SEED
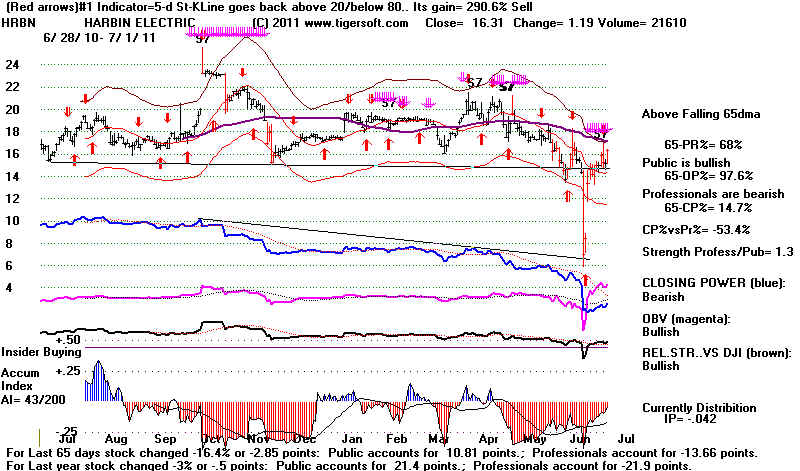
See also APWR, CAAS, CGA, CSKI, HRBN
but not all - See ATAI, BIDU, CYDU