THE CONFIRMED TREND IS YOUR FRIEND - DO THE MATH.
Tiger Software makes Analysis of Stocks Simple, Easy and Profitable!
TigerSoft Shows You When It's Best To Buy or Sell
Any Stock, Commodity, Currency, ETF...

858-273-5900 -- PO Box 9491 -- San Diego, CA 92169
Email - william_schmidt@hotmail.com
ORDER TIGERSOFT's Automatic Signaling Software & Data: $295
8/20/2009
Trends do change. We have to be ready for them.
We spot the intermediate-term trend changes with automatic signals.
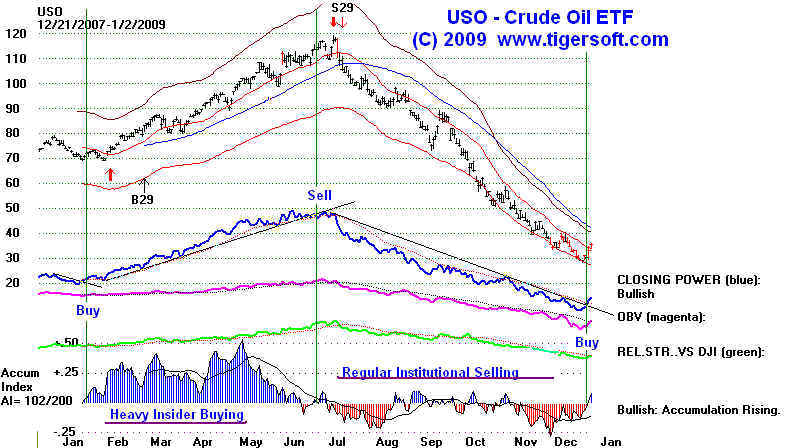
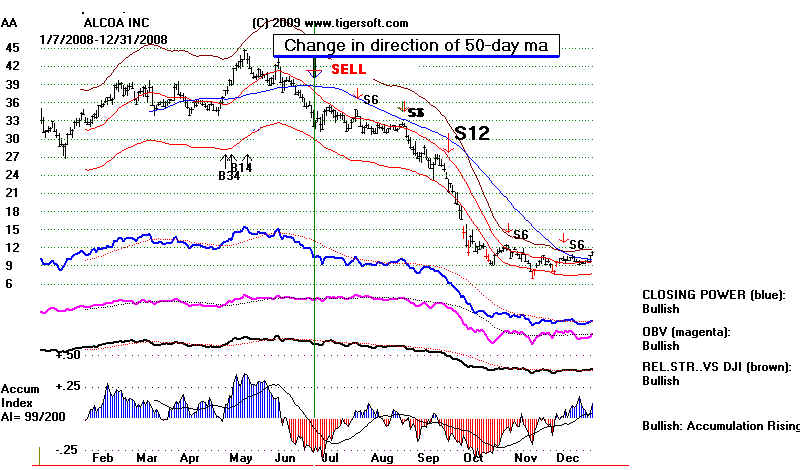
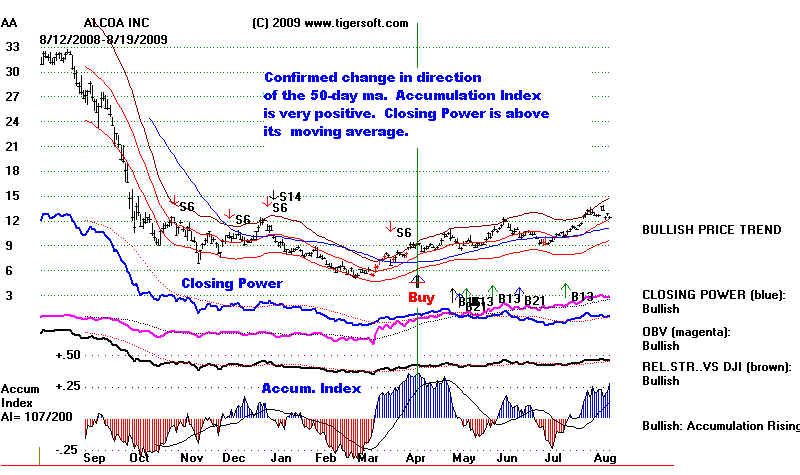
Look at the charts of Crude Oil and Alcoa to understand better how we
use the principle of a "confirmed trend" changes.
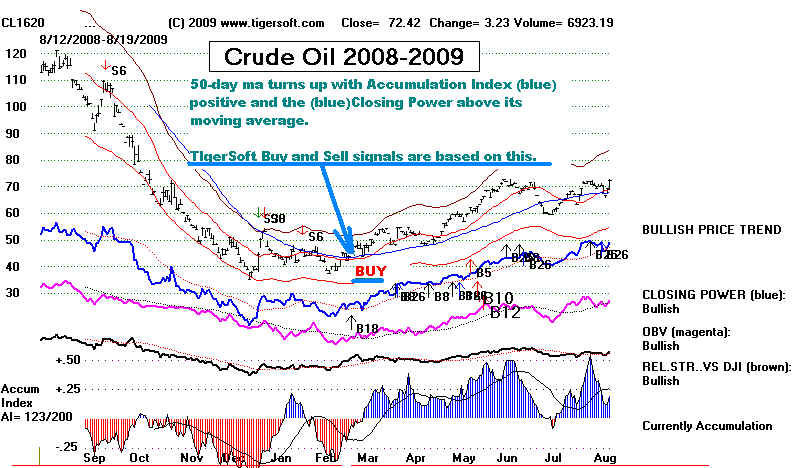
Sell signals are based on a change in direction by the key 50-day moving average
confirmed by having the TigerSoft Accumulation Index turn (red) negative and
the Closing Power fall below its moving average.
BUY signals are based on a change upwards in the direction by the key 50-day
moving average confirmed by having the TigerSoft Accumulation Index turn (blue)
positive and the Closing Power rise above its moving average.
|
Recognize A Trend Change - More Information - 4/16/2009 Simple TIGERSOFT Trading Rules TigerSoft's Simple Rules for Trading Stocks Very Profitably while Liming Risk. THE TREND IS YOUR FRIEND - DO THE MATH. Case One. You Buy 1000 shares in a stock at 20. You're lucky. It goes up to 40. You buy 500 more there. At this point you've invested $40,000 and you are ahead $20,000. But then insiders sell. The bad news comes out. Institutions sell. So, does the public. The stock goes goes all the way down to 10, as many did between 2007 and 2008. Your $40,000 investment has fallen by $25,000 when it is 10. Assume it next rises to 20. You are still down $10,000. with a portfolio worth $30,000. Case Two. You Buy 1000 shares in a stock at 20 and you buy 500 shares at 40, as above. But when the stock drops below its blue 50-day mvg.avg. with negative and falling readings from the Tiger Accumulation Index, you sell all 1500 shares at, say, 33. You see that insiders are selling. You join them. You gained $13000 on the stock you bought at 20 and lost $3500 on the stock you bought at 40. Your net profit is $9500. So you now have $49,500. As the waves of selling engulf the stock, you note that the stock still has not risen above the 50-day mvg. avg. You wait and wait. Then when the stock falls to10 you watch it closely, because insiders are no longer selling it. When the stock rises back above its 50-day mvg.avg with positive and rising readings from the Tiger Accumulation Index (measuring insider buying) and Closing Power (measuring big money institutional buying) you buy again with $25,000. Let's say you buy at 12.5. So you buy 2000 shares. When the stock reaches 20, you're ahead $15,000 more. So you now have $40,000 worth of stock and $24,500 in cash, or $64,500. In one year, you are ahead a "buy and hope" approach by more than 100%. Think of how much this approach would help a Retirement Account over 10 years. The chart below does not conform exactly to this example. But you should get the idea. Morale: Don't try to sell out at the top or buy at the bottom. The trend of the 50-day moving average is your friend, as long as it is confirmed by TigerSoft's internal strength indicators. This is the approach we advocate. For more details 4/16/2009 Simple TIGERSOFT Trading Rules TigerSoft's Simple Rules for Trading Stocks Very Profitably while Liming Risk. THE RULES ARE SIMPLE - CALL US. WE CAN HELP. 858-273-5900 Below is a year price chart of a volatile silver stock. At the top are the daily price range bars. The red Buy and Sell arrows are TigerSoft's best trading system for this period of time and for this stock. You should see in the chart below that prices reached 42 in February 2008 but then sell all the way to 10 recently. Find the blue line that goes through prices. That is the stock's 50-day mvg.avg. We watch that closely. Is it rising or falling? That is the first step to take when predicting the stock's prices. The "trend is your friend". The trend turned up at the end of the chart below. That is bullish. Underneath the prices are four internal strength measures TigerSoft uses to confirm the price trend. The computer tells you that they are each graded automatically as being "Bullish". But back where the vertical green line is shown, you can see how all the key internal strength indicators shifted to declining. That confirmed the weakness shown by prices dropping below the 50-day ma. That should have been used by TigerSoft users as a Sell. The 4 key internal strength indicators here are: 1. Blue - TigerSoft's Closing Power - This measures the trend in institutional buying and selling. 2. Magenta - OBV - A crude measure of aggressive buying and selling. 3. Dark brown - Relative Strength - the stock versus the DJIA. 4. Blue/Red - TigerSoft Accumulation Index - This detects the presence of key insider buying and selling. 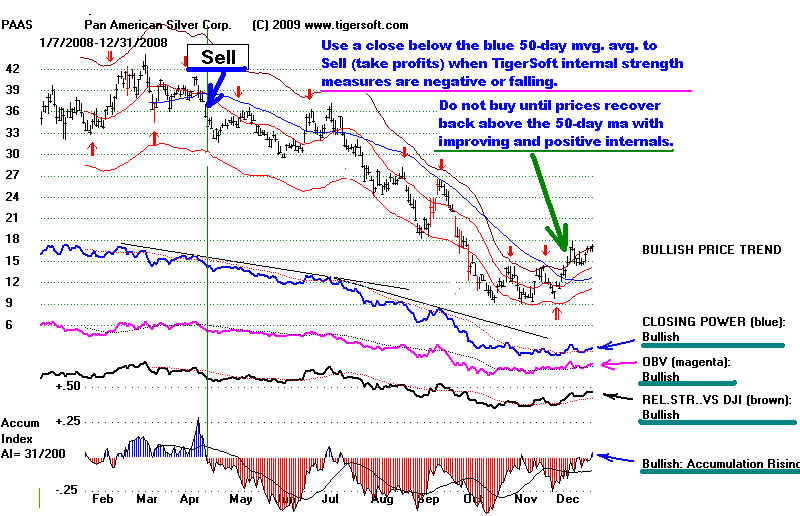 ------- Heavy insider selling --------------- |
More Links after reading this page:
www.tigersoft.com
The TigerSoft Blog
How To Find Explosive Super Stocks
SUPER STOCKS -
2009 Some
TigerSoft's Picks
Automatic Buys and Sells Introduction
to TigerSoft.
4/16/2009 Simple Trading Rules
TigerSoft's Simple Rules for Trading
Stocks Very Profitably while Liming Risk.
Bull Market or Bear Market? Peerless Stock Market Timing:
1915-2009
Past TigerSoft
Predictions based on Insider Activity
TigerSoft
Predictions Have Made Lots of Subscribers Bundles of Money
and BUY or SELL AND TRADE PROFITABLY.
|
Introduction: We study stock market history and look for historic parallels, seasonality patterns and signs of insider buying and selling. There is an extensive literature of technical analysis of stocks and commodities, currencies and metals. The most important findings in classic works like Edwards and Magee, we use, too. You will see references in our work below to such classic ideas as "head and shoulder patterns", "price breakouts", "breakdowns", "breakout-failures" and the "50-day mvg.avg." We started writing software for investors in 1981 with the advent of personal computers. This technology has has helped us make many breakthroughs. None are more important than giving everyday investors extraordinarily effective ways to detect and measure insider buying and selling as well as big institutional buying and selling. |
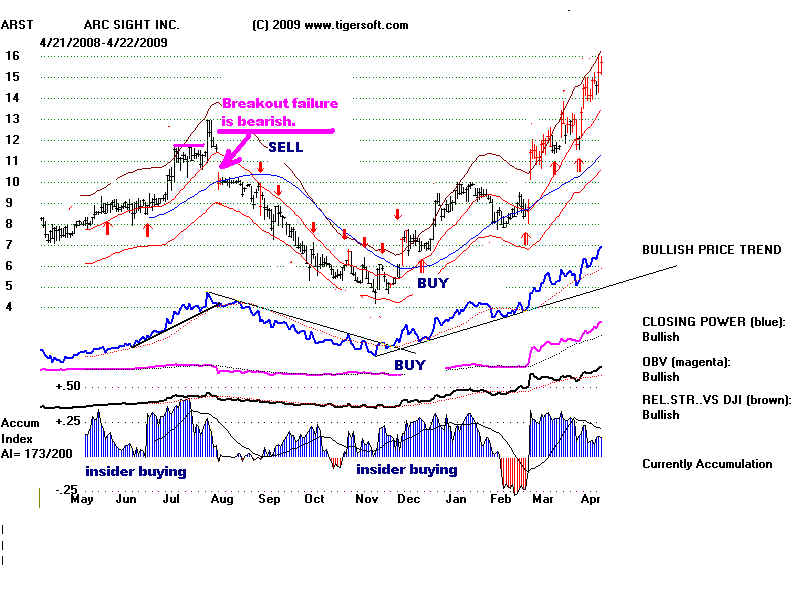
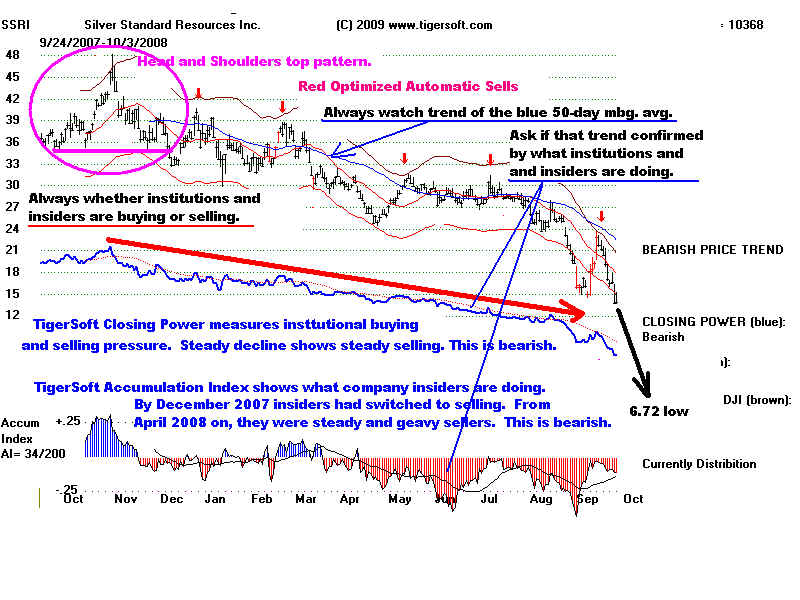
Two Examples: Bearish (SSRI) and Bullish (ARST) There are many examples of these and other concepts on our website. On this page you will see how easily our indicators would have alerted you to the developing price drop in a silver stock - SSRI - Silver Standards, as it fell from 35 t0 7 in a matter of months. The blue Tiger Closing Power showed the bearish pressure of big institutional selling. Our Tiger Accumulation Index highlighted heavy insider selling in this silver stock while it was still in the 30s. By contrast, see the persistent and heavy insider buying in ARST. Note its big waves of institutional buying in ARST. Buying and holding the stock when it was above its rising Blue with a rising Closing Power and positive Accumulation has been very profitable in a difficult market. |
Knowing When To Sell and When To Buy Is Easy
BEARISH SIGNS
THAT WARN OF IMPENDING DECLINES
IMPENDING BIG RALLIES.